
GBP/USD Price Forecast: Targets 1.3500 barrier near moving averages
Di Akhtar Faruqui
Data di Pubblicazione: 2 Mar 2026 | Data di Modifica: 2 Mar 2026


ARTICOLI POPOLARI

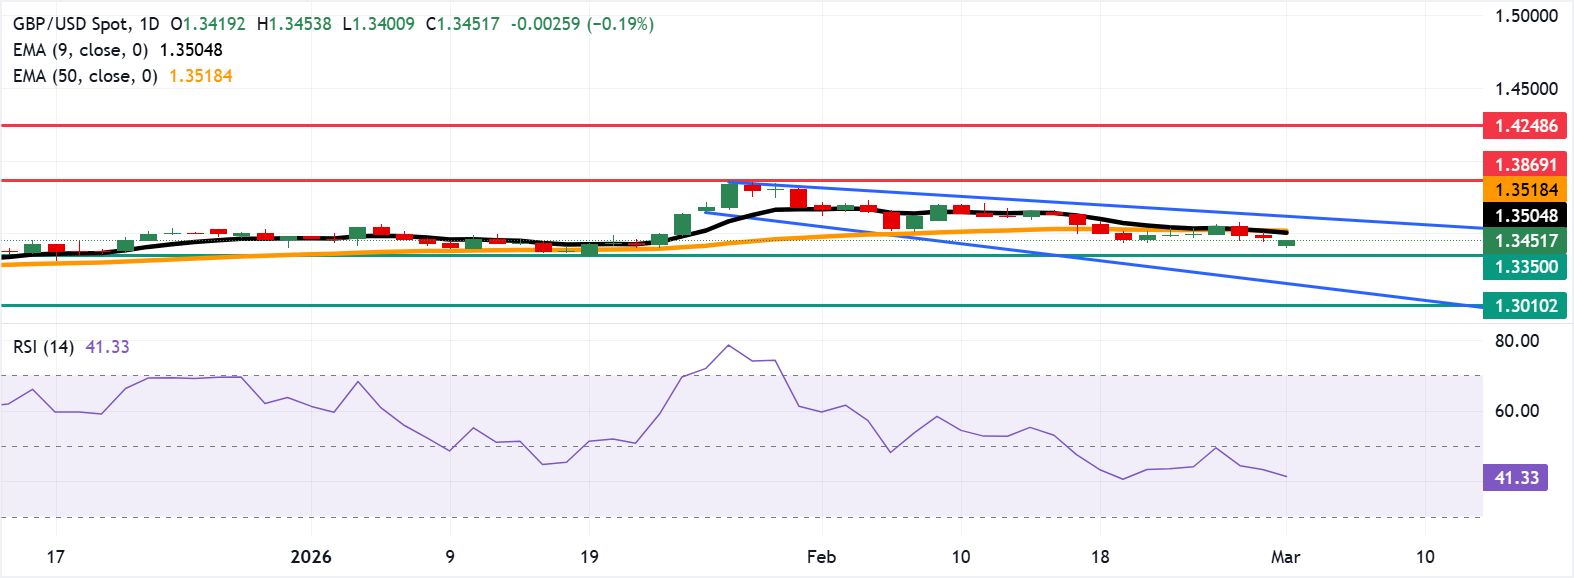
GBP/USD rebounds from the daily losses, trading around 1.3450 during the Asian hours on Monday. The technical analysis of the daily chart indicates an ongoing bearish bias, as the pair trades within a descending channel pattern.
- GBP/USD could find the primary support lies at the reversal zone around 1.3350.
- The 14-day Relative Strength Index at 40 signals sustained bearish pressure while remaining above oversold levels.
- The immediate barrier lies at the nine-day EMA at 1.3504.
GBP/USD rebounds from the daily losses, trading around 1.3450 during the Asian hours on Monday. The technical analysis of the daily chart indicates an ongoing bearish bias, as the pair trades within a descending channel pattern.
The 14-day Relative Strength Index (RSI), a momentum indicator, is at 40 points to sustained bearish pressure without oversold conditions, suggesting sellers retain control but lack capitulation extremes.
The near-term bias is mildly bearish as spot holds below the nine-day Exponential Moving Average (EMA) and slides toward the flatter 50-day average, indicating fading upside momentum.
The initial support lies at the reversal zone around 1.3350. The proximity to the 50-day EMA could attract dip-buying interest toward the descending channel around 1.3140, followed by the 10-month low at 1.3010.
On the upside, the immediate barrier is seen at the nine-day EMA at 1.3504, followed by the 50-day EMA at 1.3518. A break above these averages would improve the momentum and expose the upper descending channel boundary around 1.3630. Further advances above the channel would cause the emergence of the bullish bias and support the GBP/USD pair to test the 1.3869, the highest since September 2021, reached on January 27.
(The technical analysis of this story was written with the help of an AI tool.)
Pound Sterling Price Today
The table below shows the percentage change of British Pound (GBP) against listed major currencies today. British Pound was the strongest against the Euro.
| USD | EUR | GBP | JPY | CAD | AUD | NZD | CHF | |
|---|---|---|---|---|---|---|---|---|
| USD | 0.22% | 0.21% | 0.08% | 0.05% | 0.17% | 0.20% | -0.03% | |
| EUR | -0.22% | -0.02% | -0.15% | -0.16% | -0.05% | -0.02% | -0.24% | |
| GBP | -0.21% | 0.02% | -0.13% | -0.15% | -0.04% | -0.01% | -0.23% | |
| JPY | -0.08% | 0.15% | 0.13% | -0.01% | 0.10% | 0.14% | -0.09% | |
| CAD | -0.05% | 0.16% | 0.15% | 0.00% | 0.11% | 0.14% | -0.08% | |
| AUD | -0.17% | 0.05% | 0.04% | -0.10% | -0.11% | 0.04% | -0.19% | |
| NZD | -0.20% | 0.02% | 0.00% | -0.14% | -0.14% | -0.04% | -0.23% | |
| CHF | 0.03% | 0.24% | 0.23% | 0.09% | 0.08% | 0.19% | 0.23% |
The heat map shows percentage changes of major currencies against each other. The base currency is picked from the left column, while the quote currency is picked from the top row. For example, if you pick the British Pound from the left column and move along the horizontal line to the US Dollar, the percentage change displayed in the box will represent GBP (base)/USD (quote).

Oltre un milione di utenti si affida a FXStreet per dati di mercato in tempo reale, strumenti di charting, approfondimenti di esperti e notizie Forex. Il loro calendario economico completo e i webinar formativi aiutano i trader a rimanere informati e a prendere decisioni ponderate. FXStreet conta circa 60 professionisti tra la sede di Barcellona e diverse regioni globali.
Leggi di più


