
Hyperliquid Price Forecast: HYPE rises on commodities demand amid US-Iran war
Di Vishal Dixit
Data di Pubblicazione: 3 Mar 2026 | Data di Modifica: 3 Mar 2026


ARTICOLI POPOLARI

Hyperliquid (HYPE) steadies above $33 at press time on Tuesday, marking its fourth consecutive day of recovery in a broadly volatile market due to the ongoing US-Israel strikes on Iran.
- Hyperliquid has held above $33 so far on Tuesday, approaching a crucial resistance level.
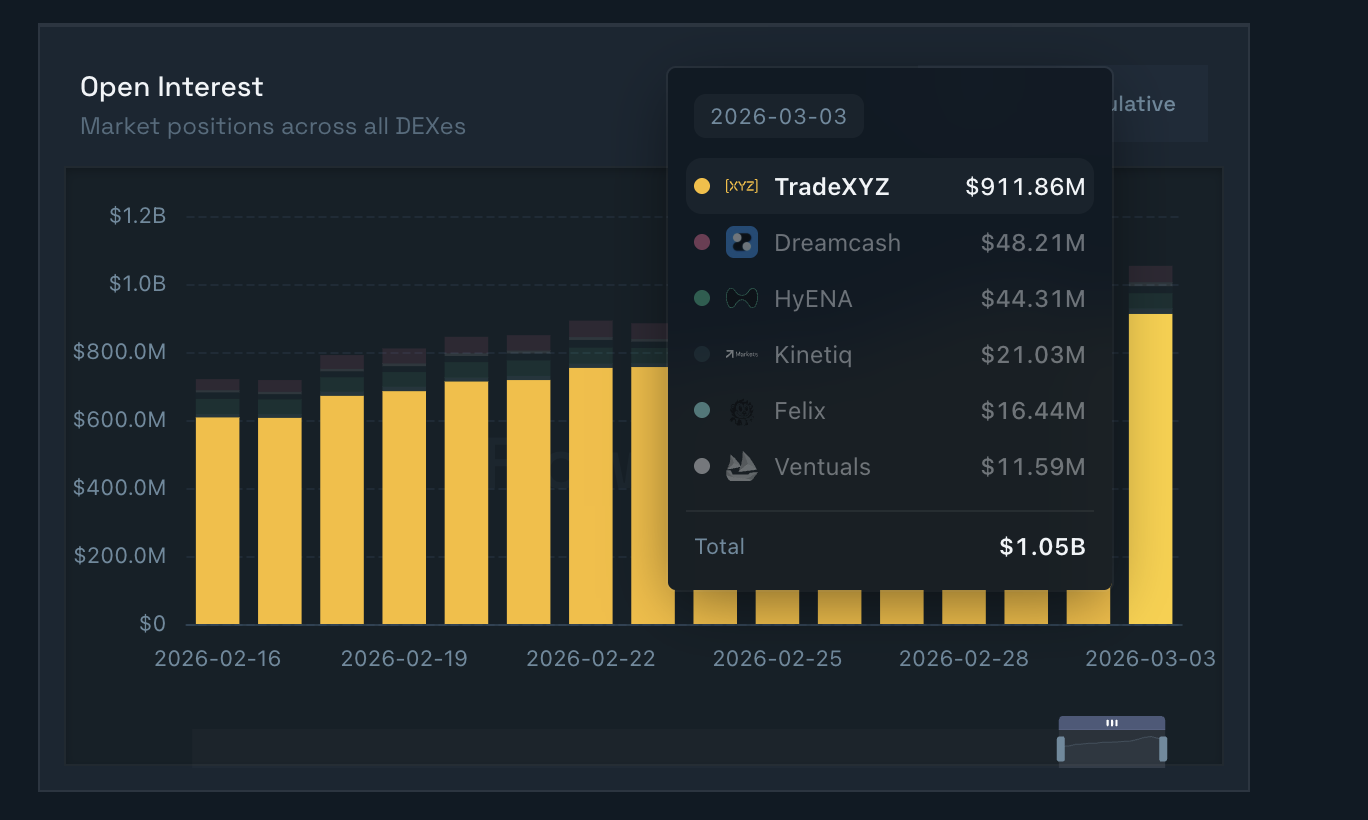
- Hyperliquid’s HIP-3, which offers commodity futures trading, holds over $1 billion in Open Interest, suggesting rising macro demand.
- Derivatives data shows a bullish skew in retail interest, with short liquidations surging while Open Interest holds steady.
Hyperliquid (HYPE) steadies above $33 at press time on Tuesday, marking its fourth consecutive day of recovery in a broadly volatile market due to the ongoing US-Israel strikes on Iran. Risk-off sentiment drives the nudge investors to high-demand commodities such as oil, Gold (XAU), silver (XAG), and their tokenized versions on Hyperliquid. The HYPE Open Interest holds steady amid increased short liquidations, suggesting persistent demand for the exchange token.
Hyperliquid’s rise in the macro market
The US-Israel joint operation against Iran started on Saturday, triggering a sharp surge in demand for commodities such as Crude Oil and safe havens like Gold and Silver. However, the global market closed for the weekend, directing the capital toward Hyperliquid, a Decentralized Exchange (DEX) that operates 24/7.
Hyperliquid Improvement Protocol 3 (HIP-3) allows users to build futures contracts for a deposit of 500,000 HYPE tokens. Data from Flowscan shows that the Open Interest (OI) on HIP-3 stands at $1.05 billion as of Tuesday, after reaching a high of $1.13 billion on Saturday.
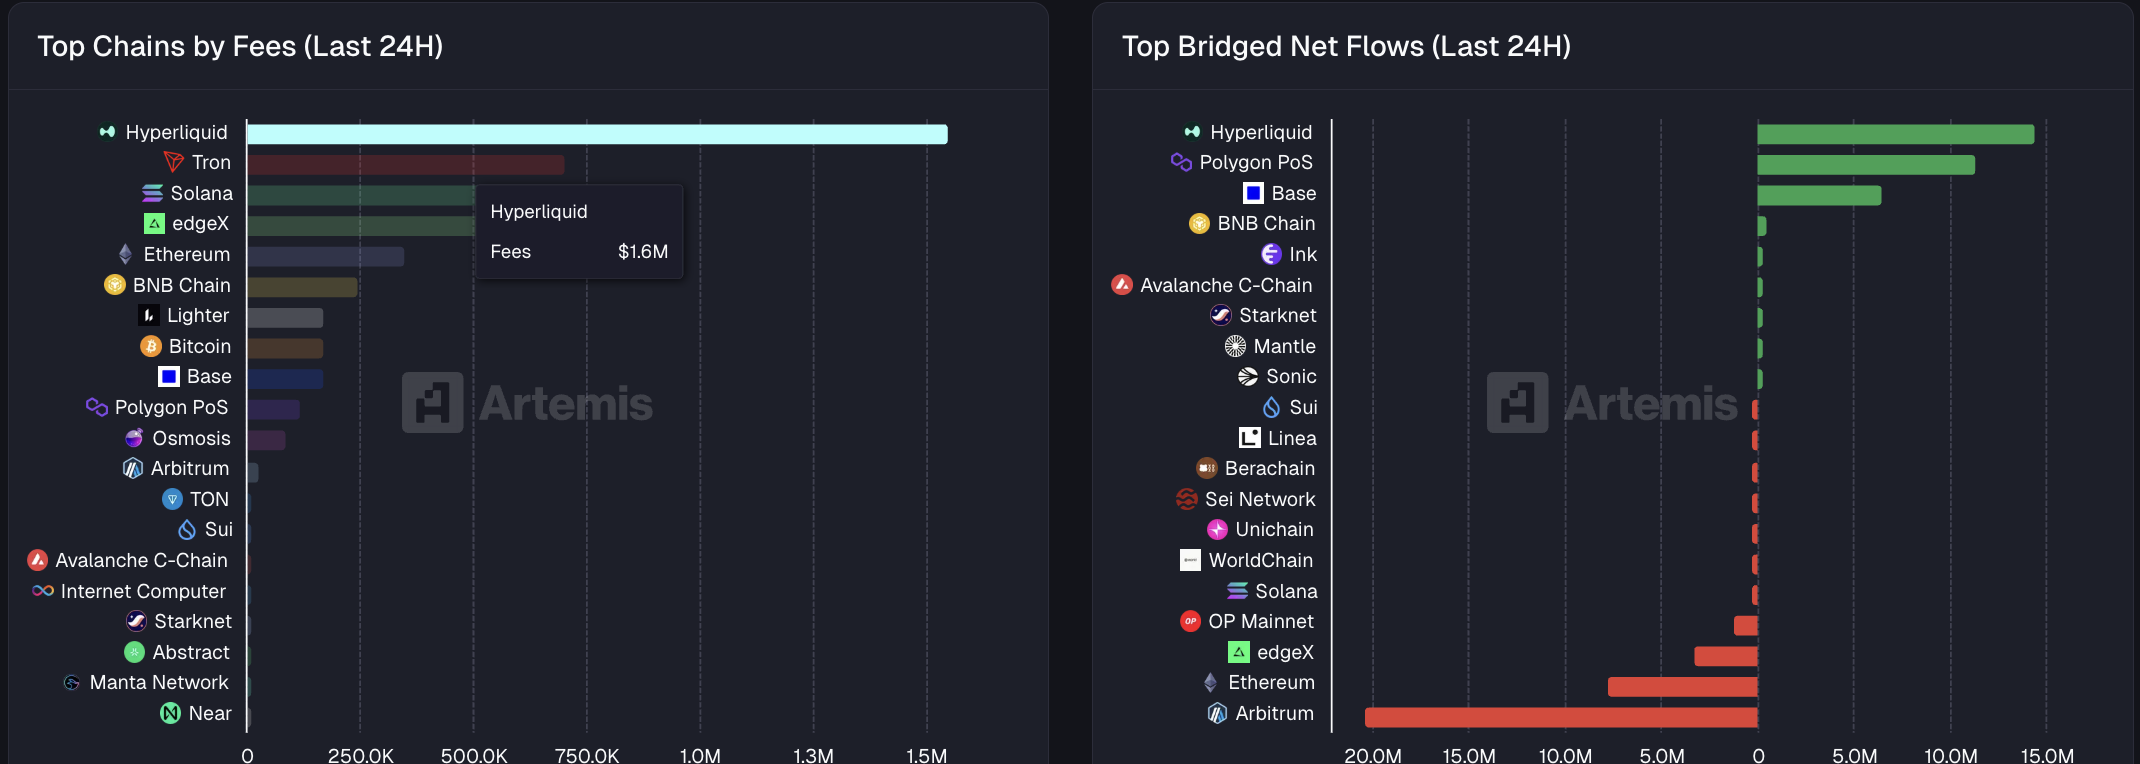
Meanwhile, consistent netflows and the highest fee collection among top protocols indicate strong demand for Hyperliquid. Artemis data shows Hyperliquid collected $1.6 million in fees over the last 24 hours, outpacing Tron (TRX) with $703,500. Hyperliquid also ranks highest among chains based on bridged netflows, with $14.4 million in the same time period, followed by Polygon with $11.3 million.
Short positional wipeout skews derivatives market bullish
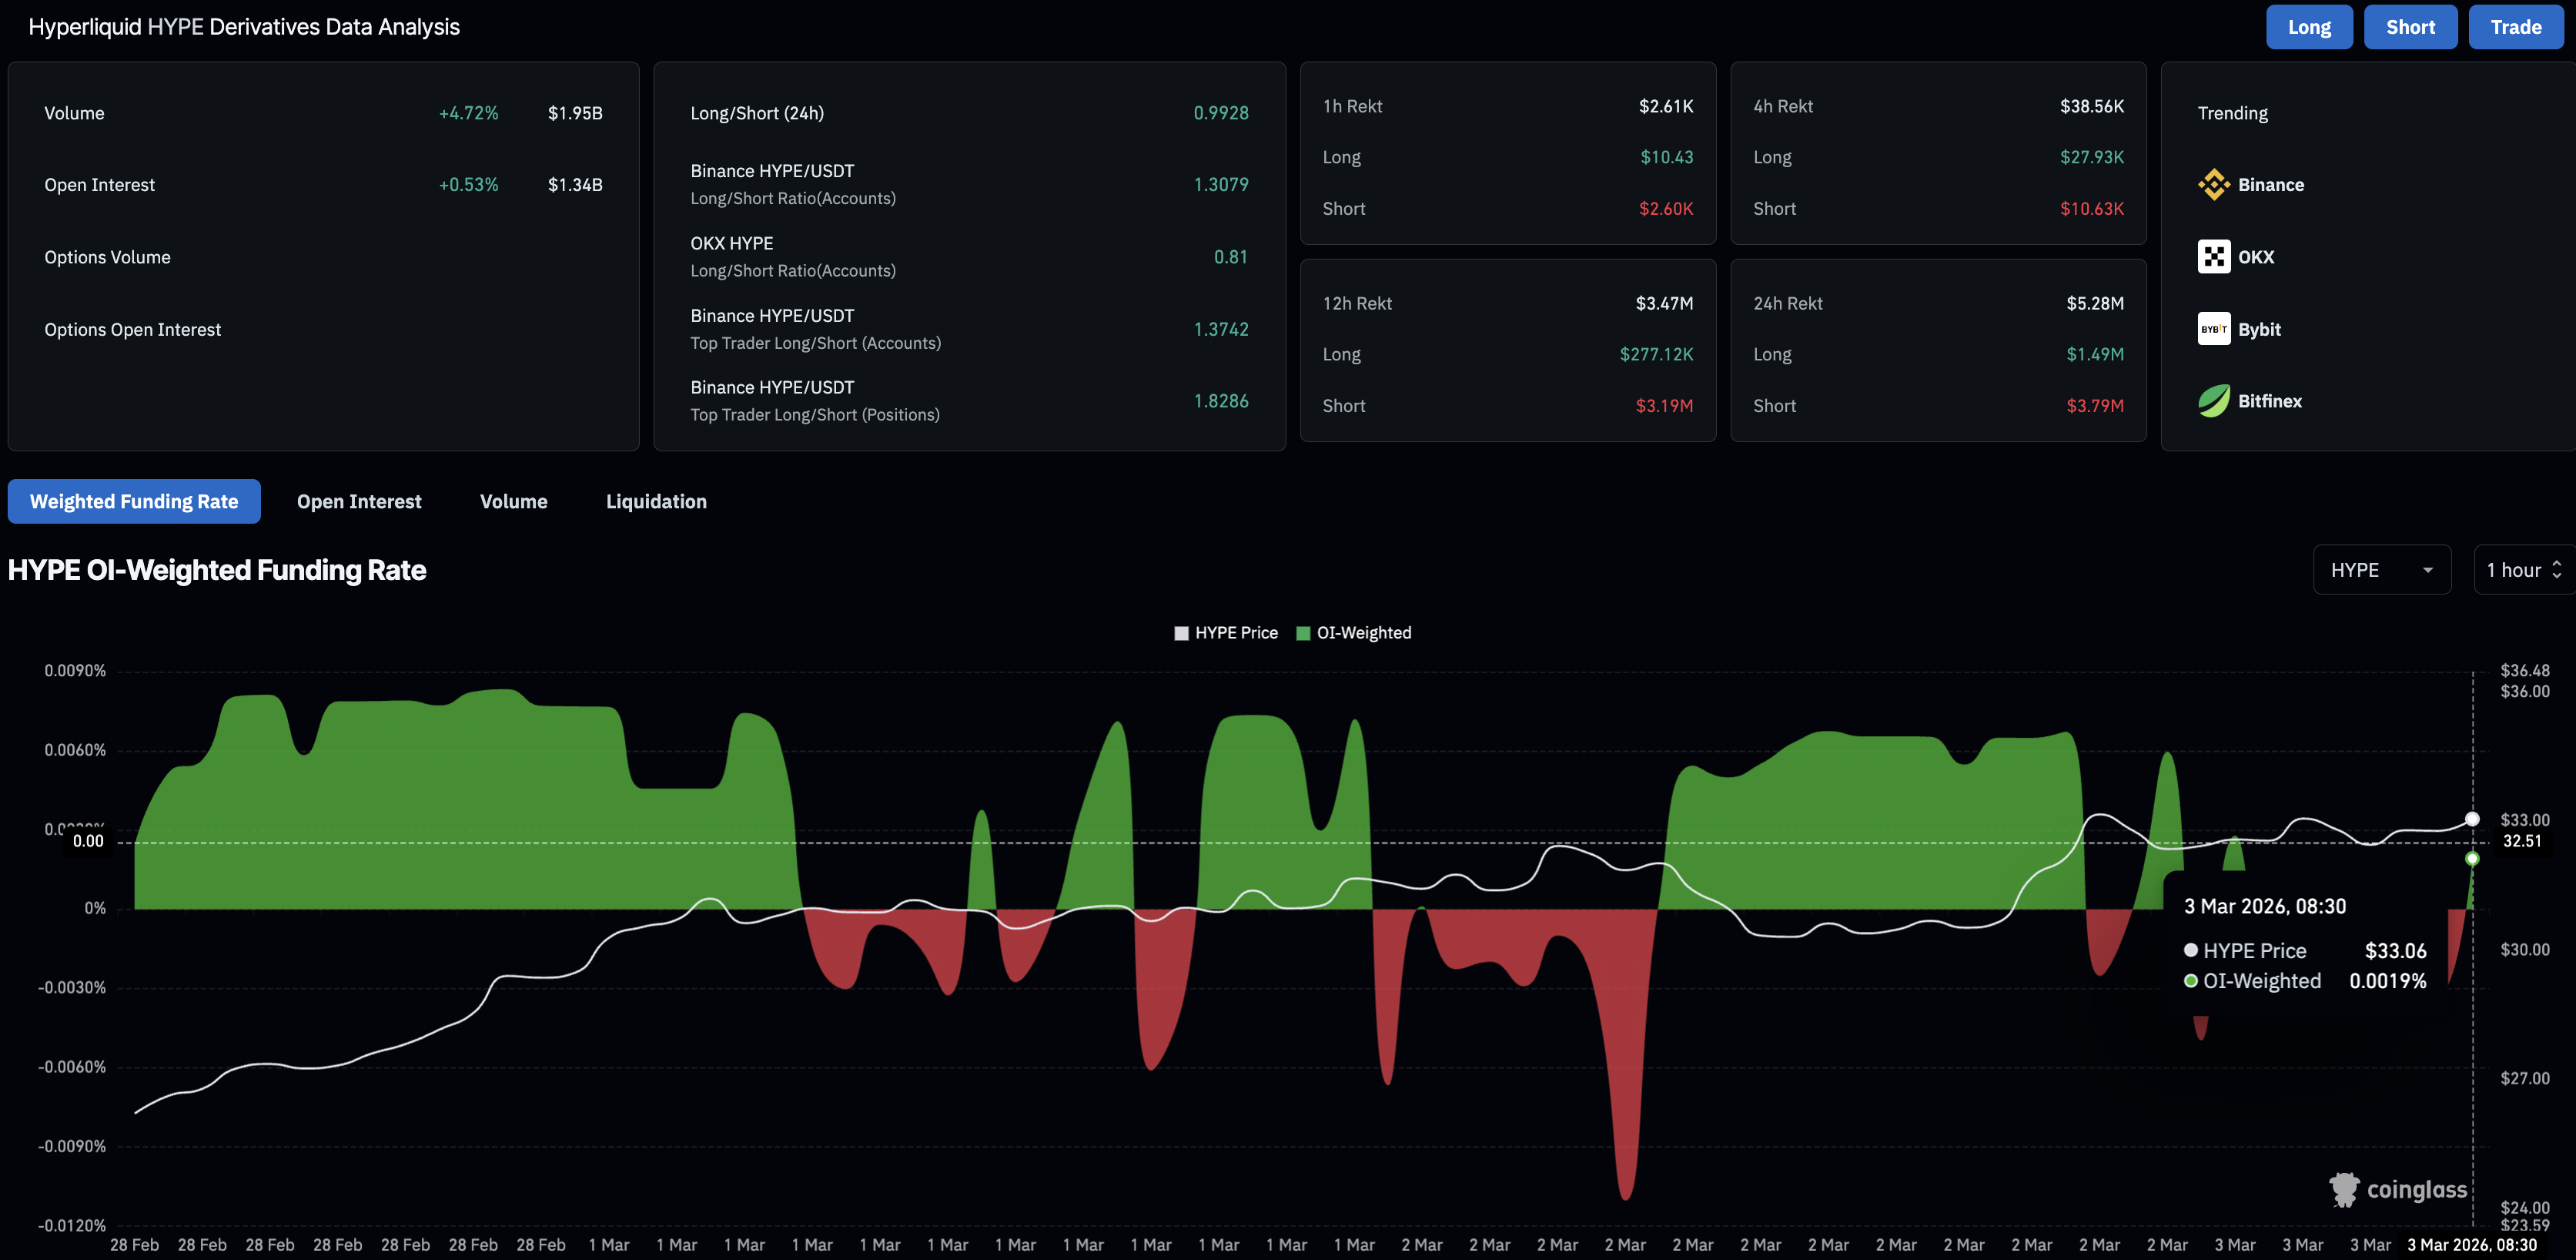
Hyperliquid derivatives data shows persistent buy-side demand. According to CoinGlass, liquidations totaled $5.28 million over the last 24 hours, led by short liquidations of $3.79 million, indicating a biased wipeout of bearish positions. However, HYPE futures Open Interest (OI) is at $1.34 billion, up 0.53% over the same period, indicating that the notional value of outstanding contracts remains strong as investors anticipate further upside.
Additionally, the funding rate is at 0.0019%, up from -0.0032% earlier in the day, suggesting persistent bullish interest.
Technical outlook: Will Hyperliquid extend its recovery above $35?
Hyperliquid extends gains above its 200-day Exponential Moving Average (EMA) at $32.13 at press time on Tuesday. The upward-sloping 50-day EMA aims for a potential crossover above the 200-day EMA, a Golden Cross, which could be considered a buy signal from price action traders.
The Moving Average Convergence Divergence (MACD) extends above its signal line on the daily chart after a crossover on Sunday, indicating increased bullish momentum. The Relative Strength Index (RSI) is at 60 on the same chart, indicating firm buying pressure, with further upside before reaching the overbought zone.
The recovery in HYPE targets the $35.47 resistance level, marked by the August 2 low, which previously capped gains in early February. A decisive close above this level could target the $49-$50 supply zone, last tested in late October.
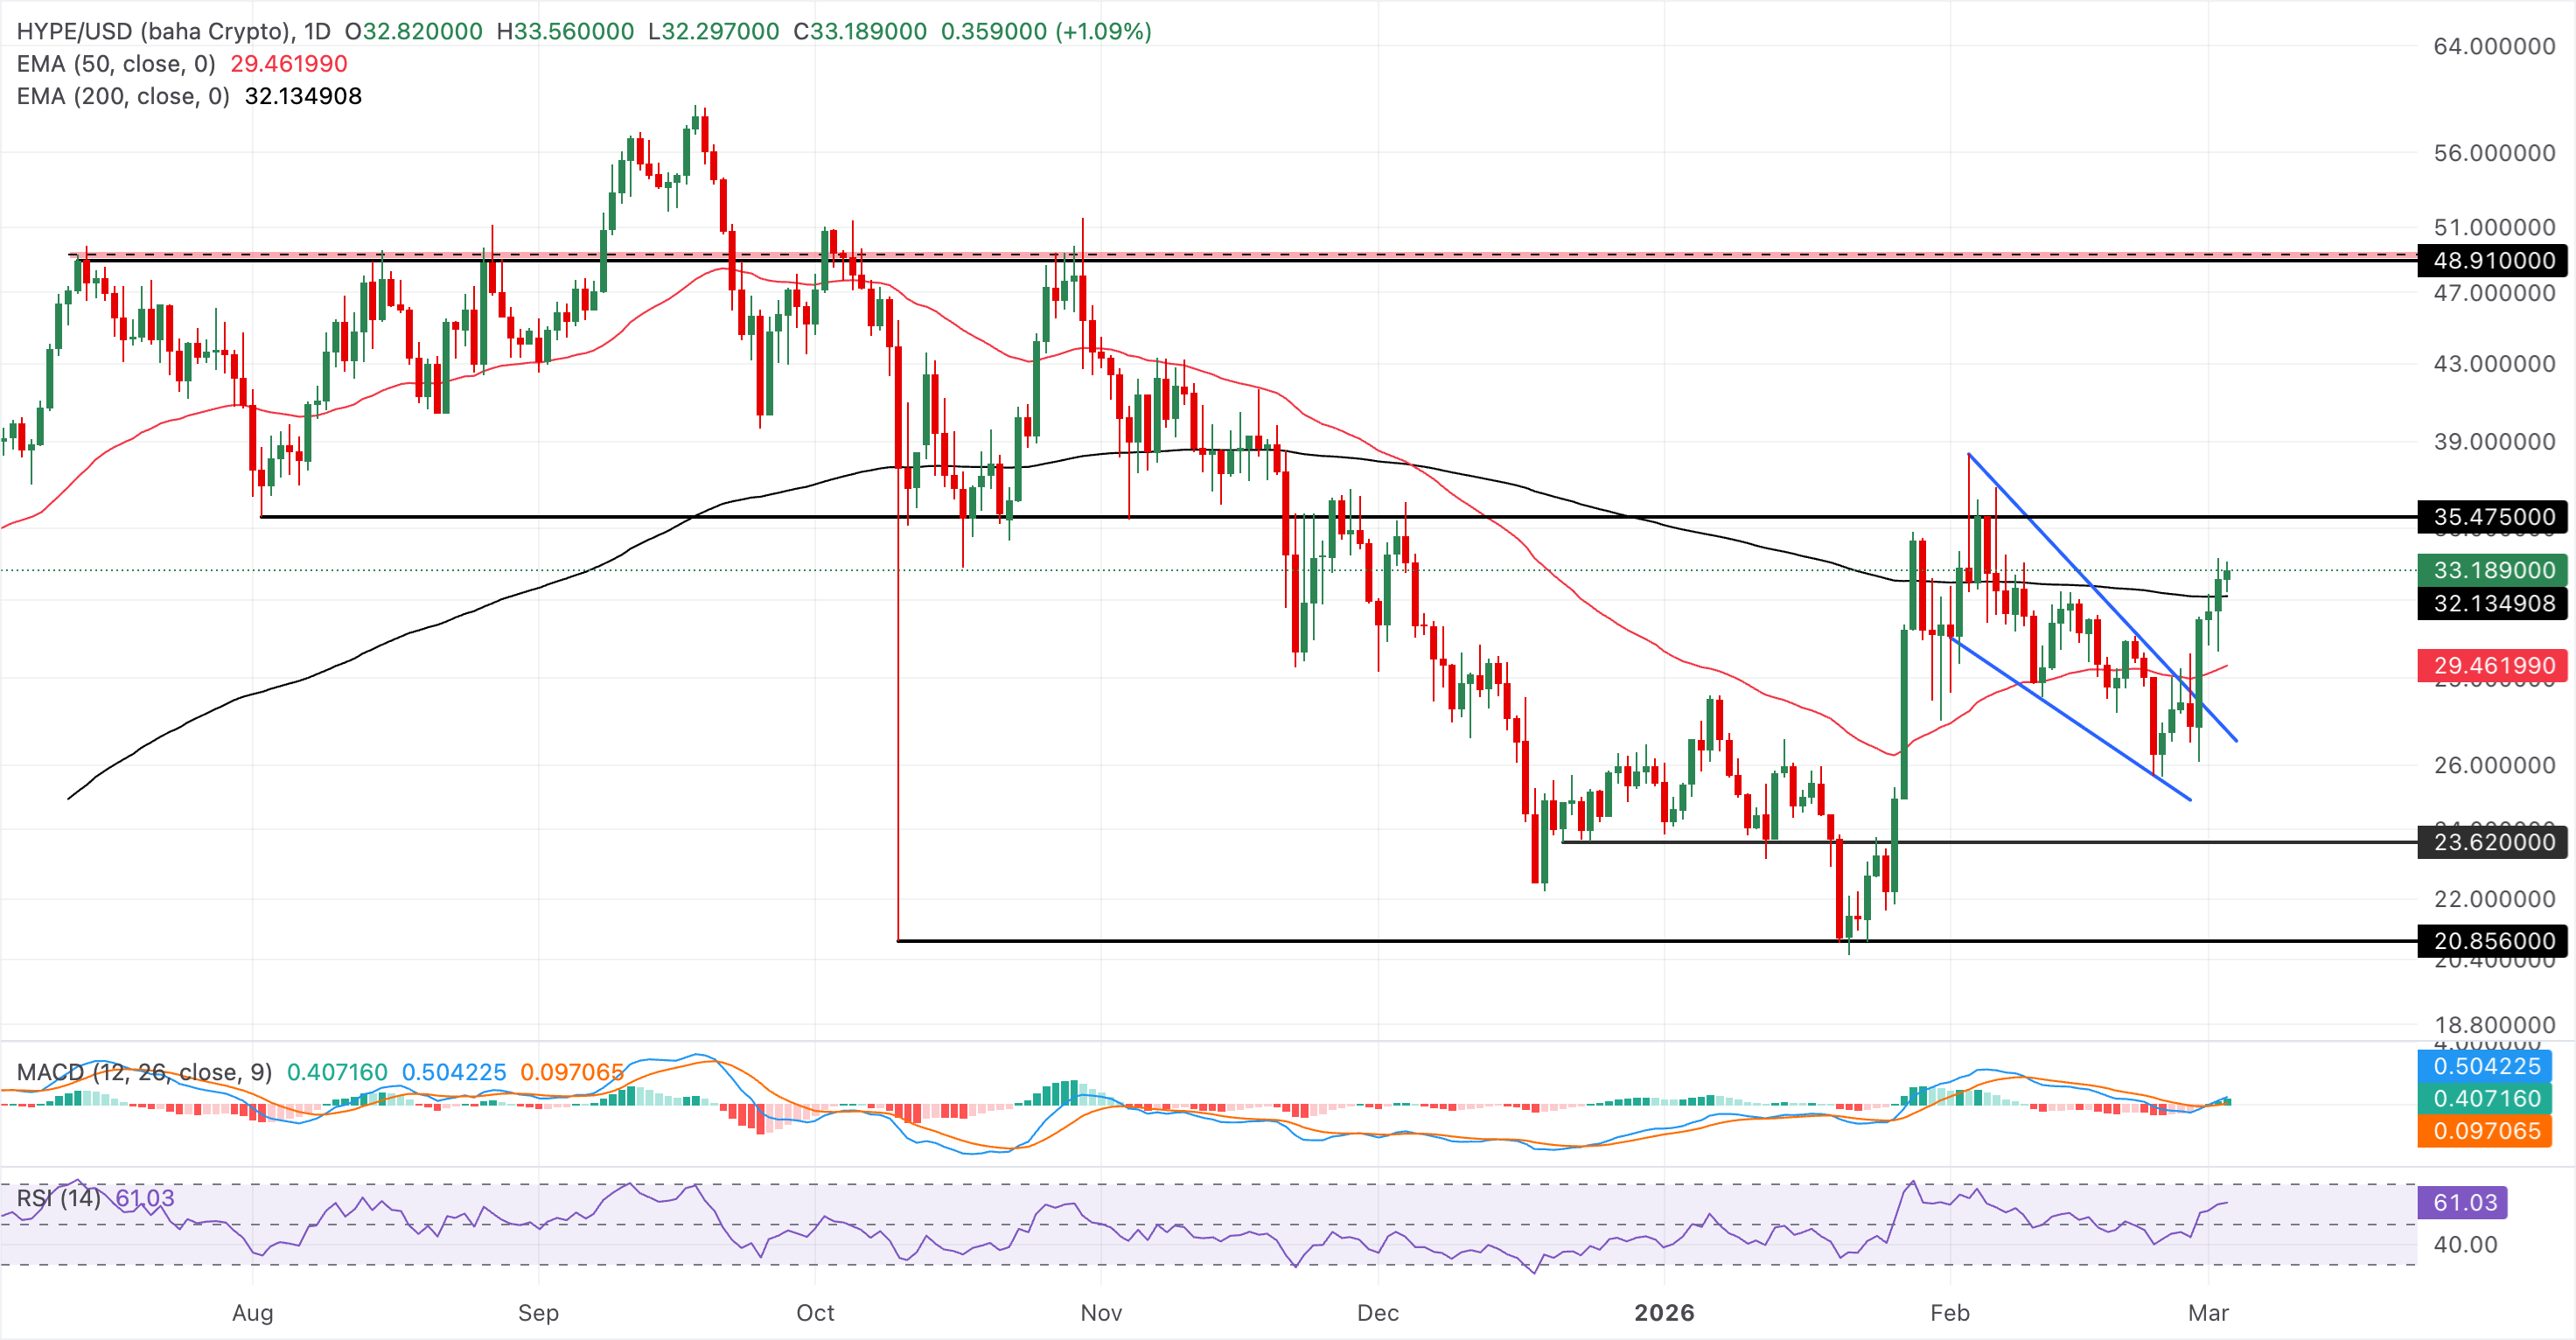
On the downside, the 200-day and 50-day EMAs at $32.13 and $29.46, respectively, could serve as crucial support levels.
(The technical analysis of this story was written with the help of an AI tool.)

Oltre un milione di utenti si affida a FXStreet per dati di mercato in tempo reale, strumenti di charting, approfondimenti di esperti e notizie Forex. Il loro calendario economico completo e i webinar formativi aiutano i trader a rimanere informati e a prendere decisioni ponderate. FXStreet conta circa 60 professionisti tra la sede di Barcellona e diverse regioni globali.
Leggi di più


