
Meme Coins Price Prediction: Bears push Dogecoin, Shiba Inu, Pepe to the ropes
Di Vishal Dixit
Data di Pubblicazione: 17 Feb 2026 | Data di Modifica: 17 Feb 2026


ARTICOLI POPOLARI

Meme coins, including Dogecoin (DOGE), Shiba Inu (SHIB), and Pepe (PEPE), are under pressure on Tuesday, extending Sunday’s decline. The derivatives data show substantial outflows from DOGE, SHIB, and PEPE futures Open Interest, primarily driven by long-side-skewed liquidations.
- Dogecoin extends its decline for the third consecutive day on Tuesday.
- Shiba Inu edges lower, stretching the downside reversal from a crucial resistance.
- Pepe trades below the 50-day EMA as bullish momentum fades.
Meme coins, including Dogecoin (DOGE), Shiba Inu (SHIB), and Pepe (PEPE), are under pressure on Tuesday, extending Sunday’s decline. The derivatives data show substantial outflows from DOGE, SHIB, and PEPE futures Open Interest, primarily driven by long-side-skewed liquidations. Technically, the meme coins are facing downside risk as selling pressure resurfaces.
Meme coins under broader market pressure lose investors' confidence
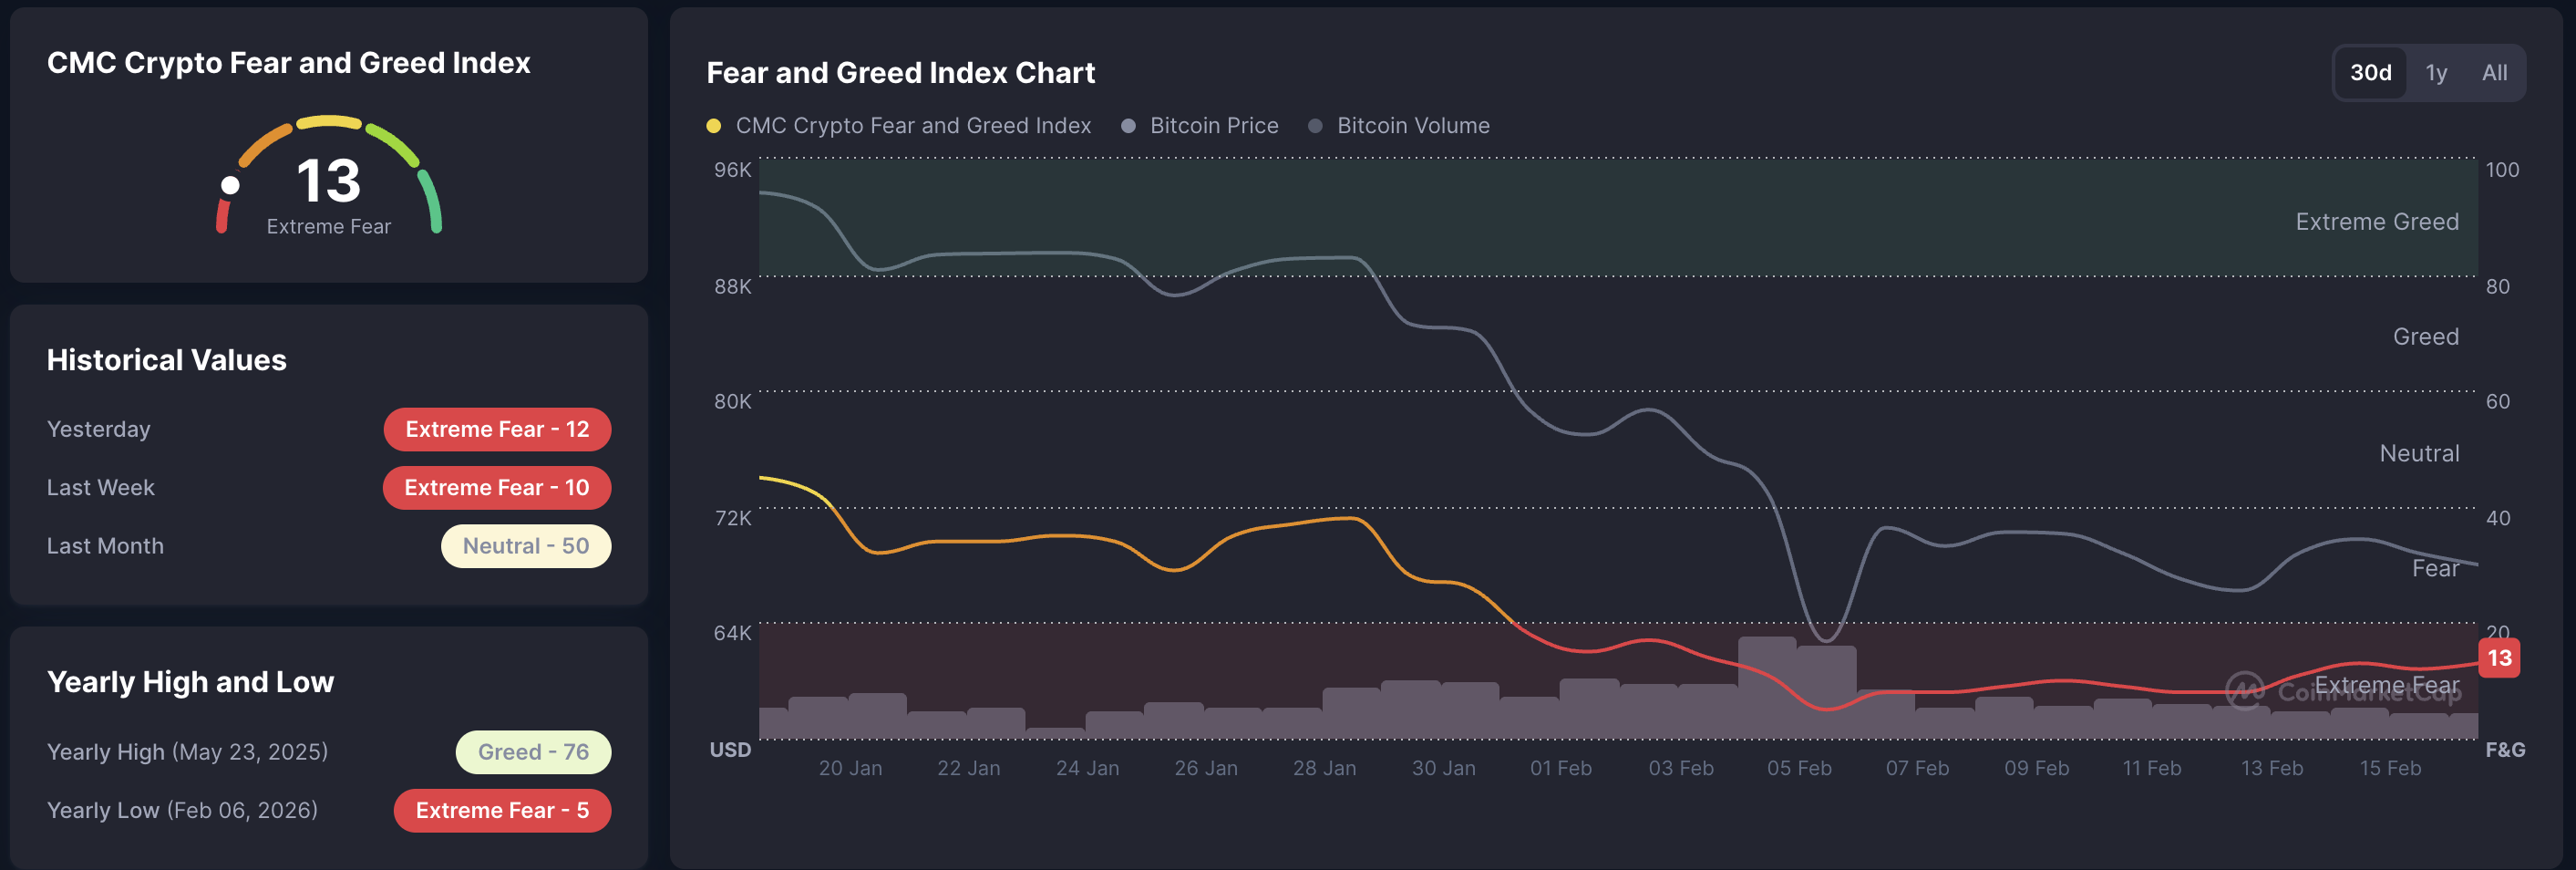
Meme coins are struggling to sustain their retail surge amid broader cryptocurrency market volatility. The Crypto Fear and Greed Index stands at 13 on Tuesday, reflecting extreme fear in the market.
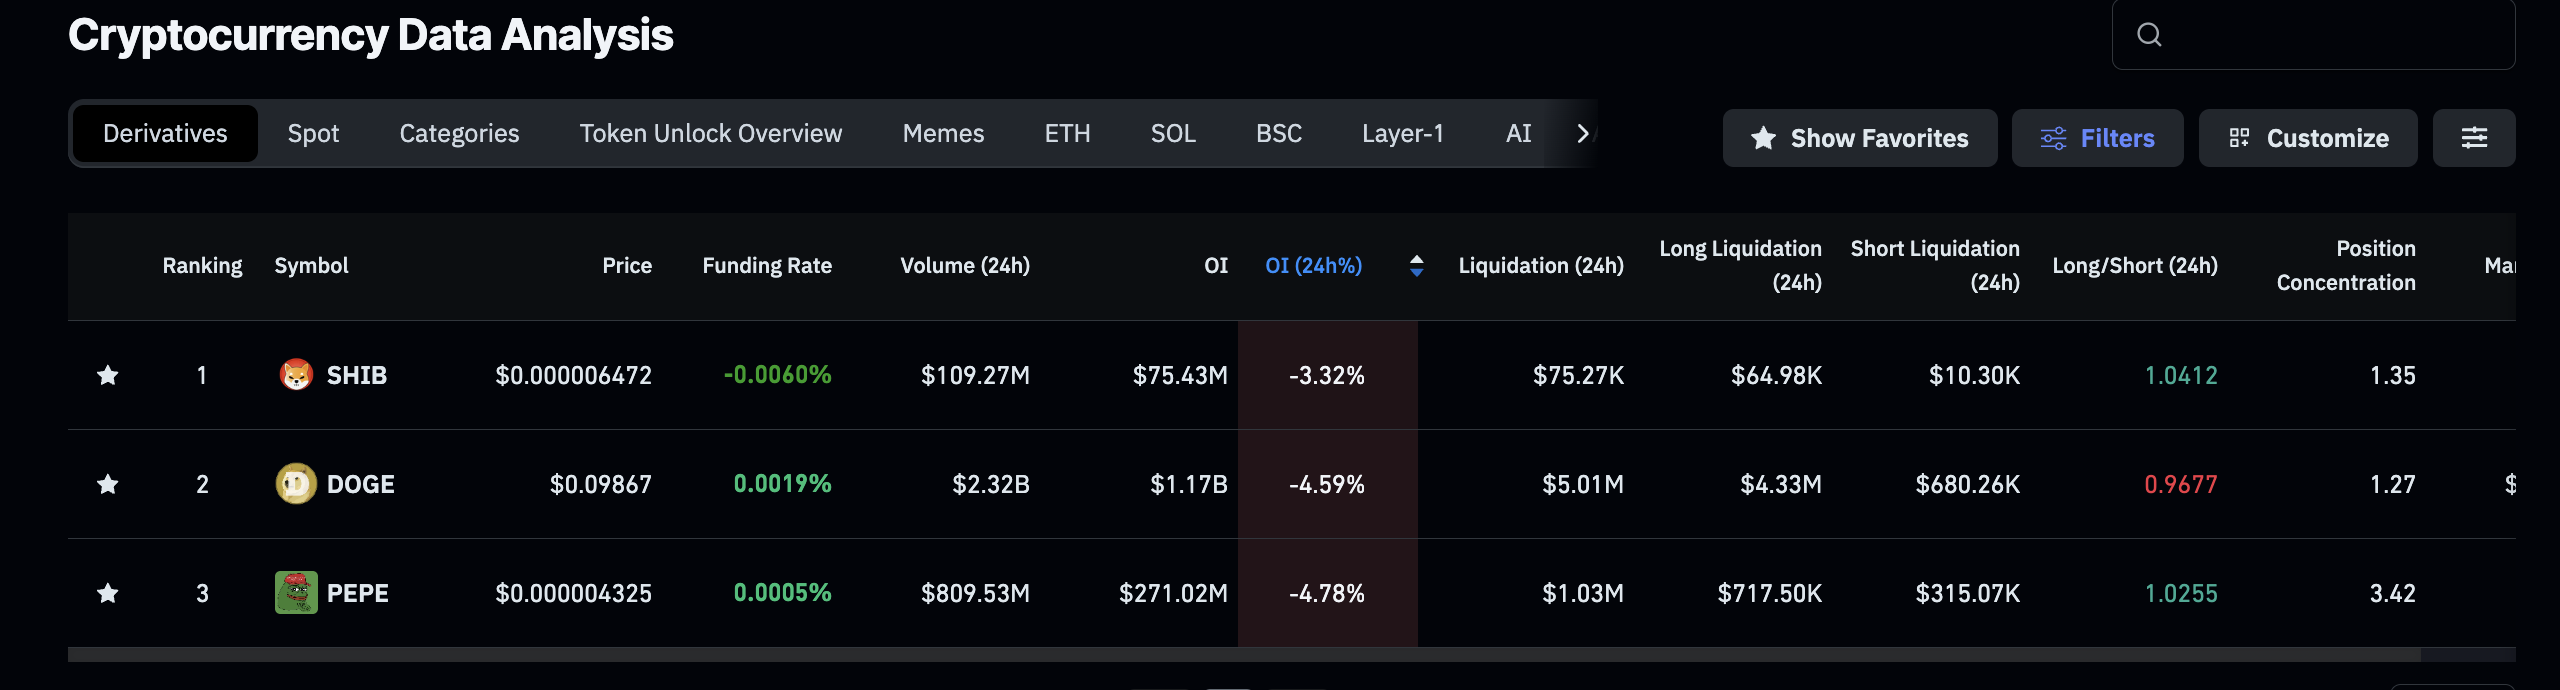
CoinGlass data indicate that Dogecoin Open Interest (OI) is $1.17 billion on Tuesday, with an over 4% decline over the last 24 hours, indicating reduced risk exposure among traders. This risk-off sentiment is consistent with 24-hour liquidations totaling $5.01 million, of which $4.33 million were long liquidations, suggesting that capital outflows are driven by forced liquidations of long positions.
As a result, the long-to-short ratio is down to 0.9677, which reflects short positional buildup below 1.
Similarly, SHIB and PEPE futures OI are down to $75.43 million and $271.02 million on Tuesday, recording a loss of over 3% and near 5%, respectively.
Dogecoin on a losing streak risks last week's gains
Dogecoin is trading below the $0.1000 psychological level at press time on Tuesday, recording a 2% decline so far on the day. The dog-themed meme coin extends the decline for the third consecutive day, testing the February 6 closing price of $0.0984.
A decisive close below this could test the February 11 low at $0.0879, with additional support at the S1 pivot point at $0.0803.
The technical indicators on the daily chart suggest a fading bullish momentum. The Relative Strength Index (RSI) at 42 slopes lower from the midline, with further downside before reaching the oversold zone. Meanwhile, the Moving Average Convergence Divergence (MACD) remains upward, but the contracting positive histogram suggests a loss in bullish momentum.
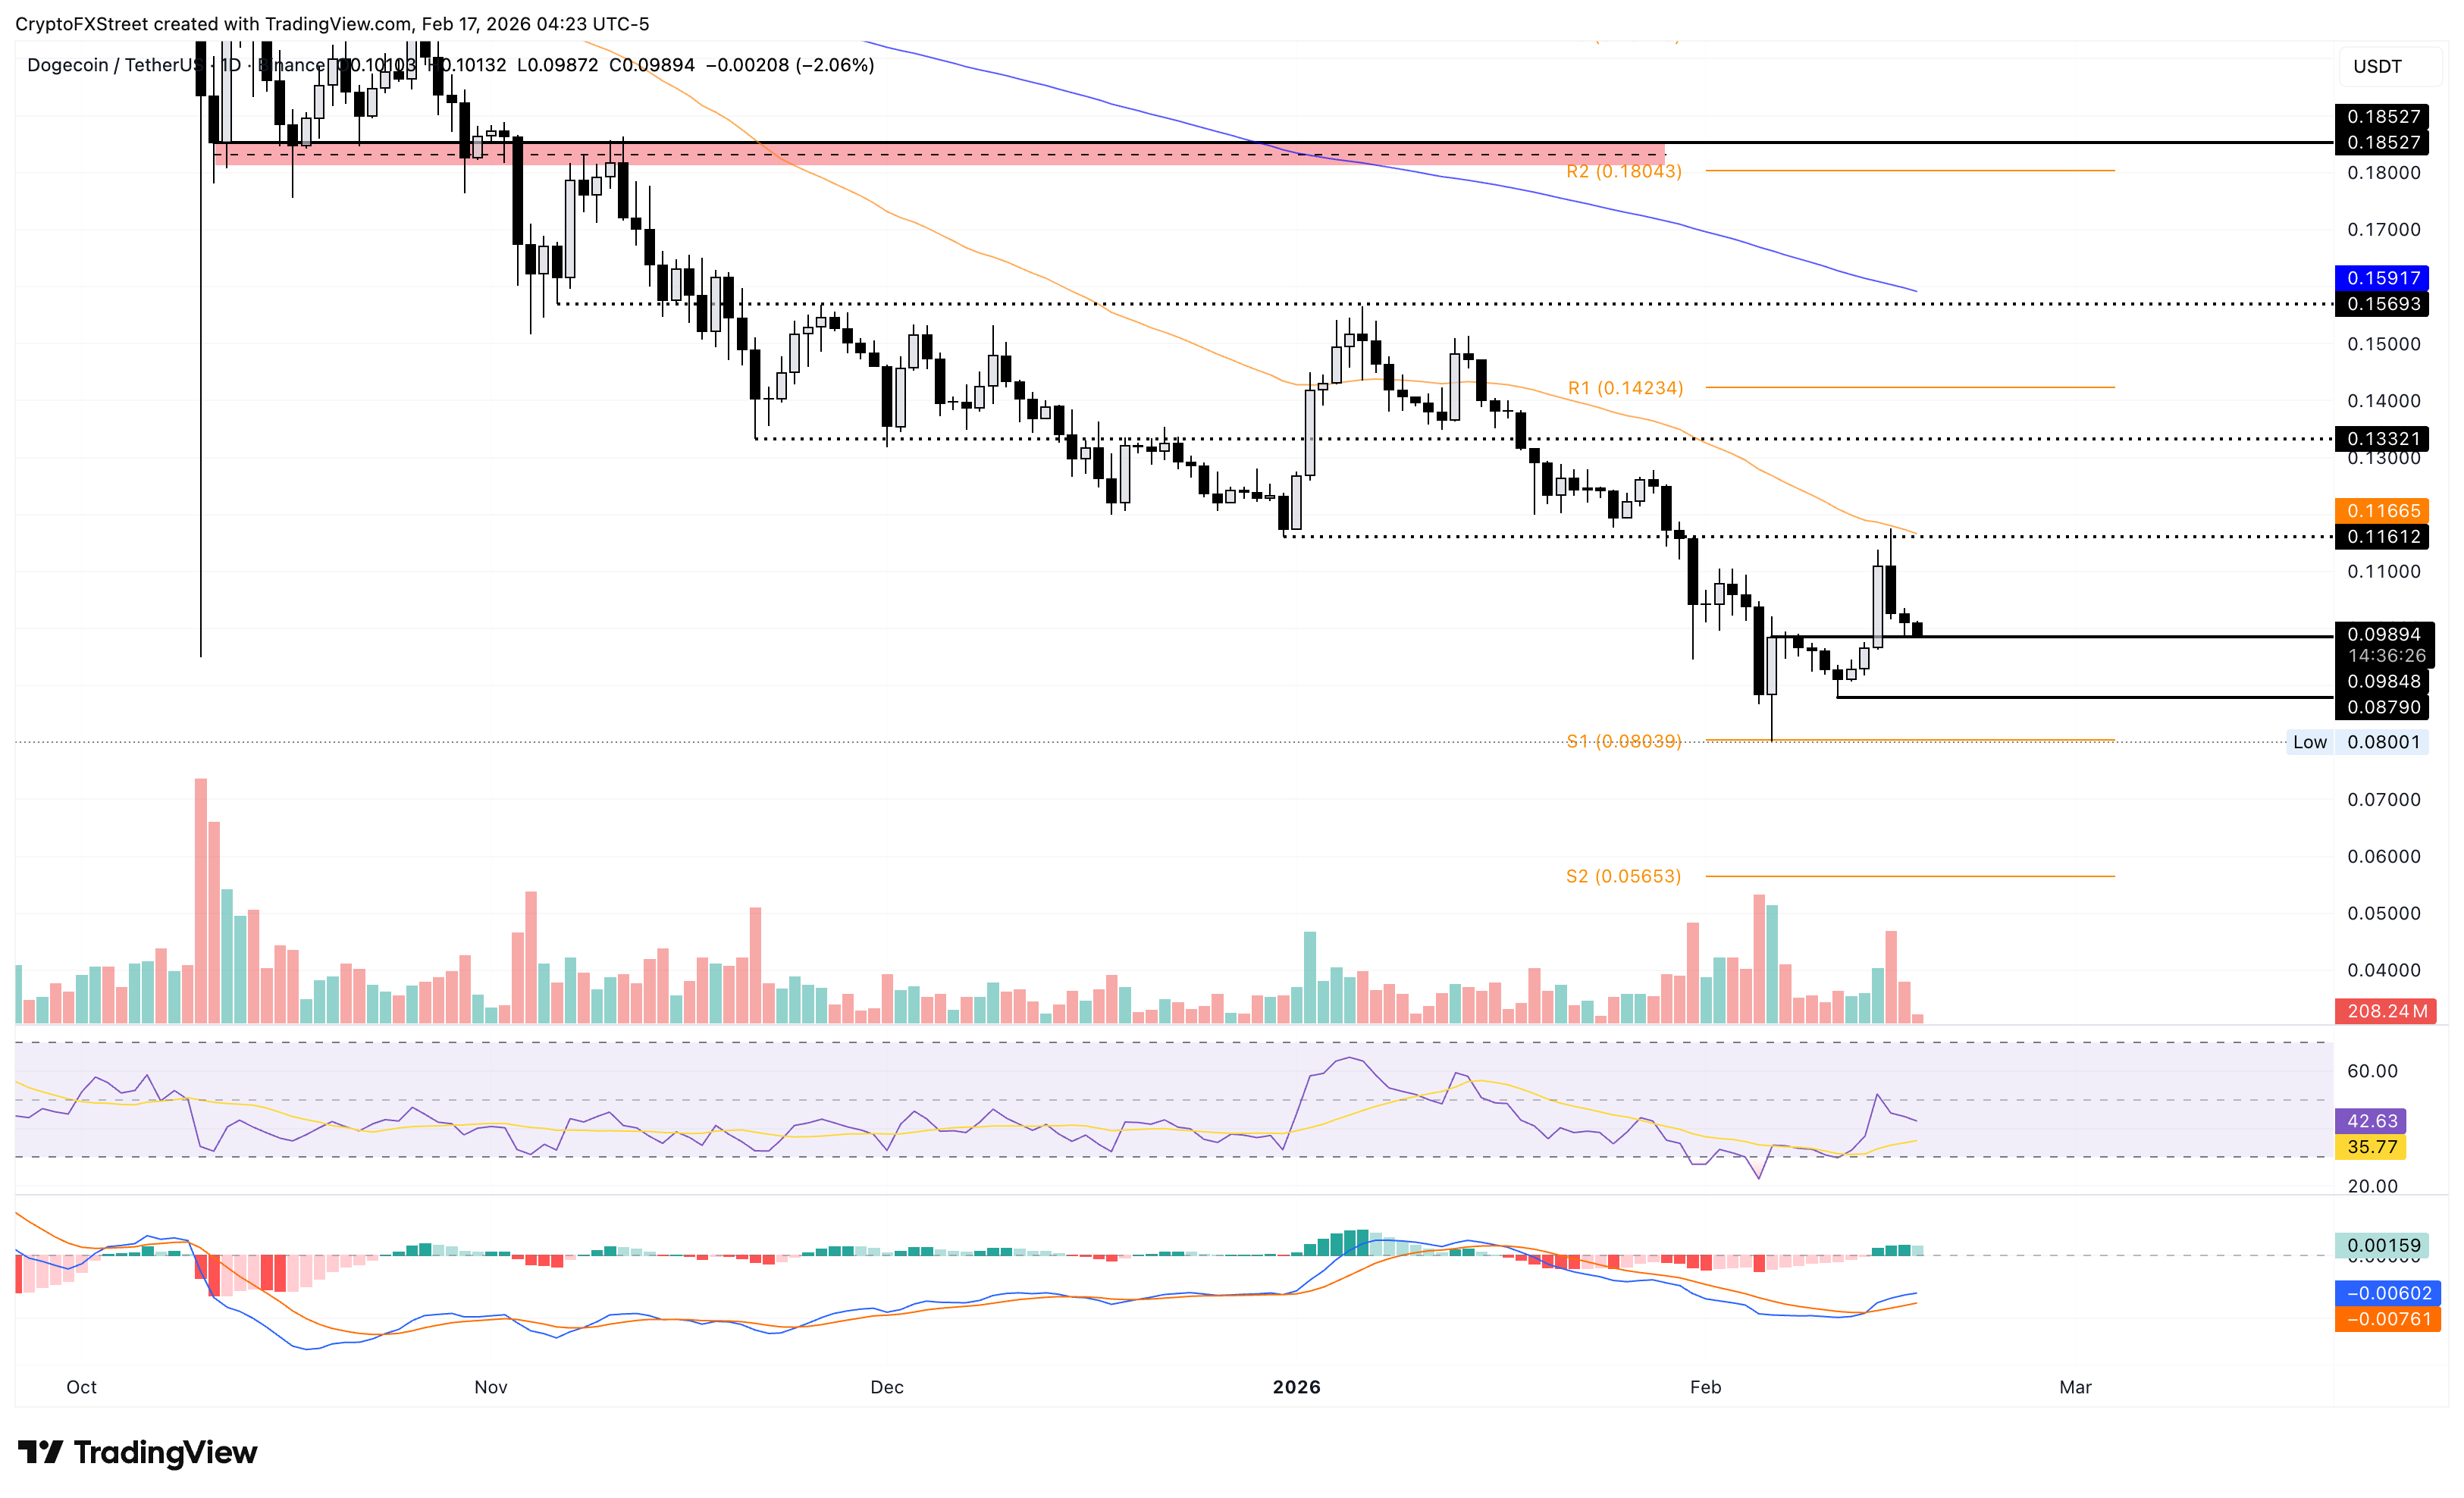
If Dogecoin reclaims a daily close above the $0.1000 psychological level, it would signal an easing of downside pressure and likely extend the recovery to $0.1161.
Shiba Inu under pressure risks further losses
Shiba Inu is down 1.67% at the time of writing on Tuesday, extending its reversal from the $0.00000700 supply zone. The path of least resistance indicates a pullback to the S1 pivot point at $0.00000528, with a downside potential of approximately 20%.
Similar to Dogecoin, the technical indicators on the daily chart suggest a pullback in bullish momentum for Shiba Inu. The RSI at 45 slips below the midline, while the MACD positive histogram contracts, indicating reduced buying pressure.
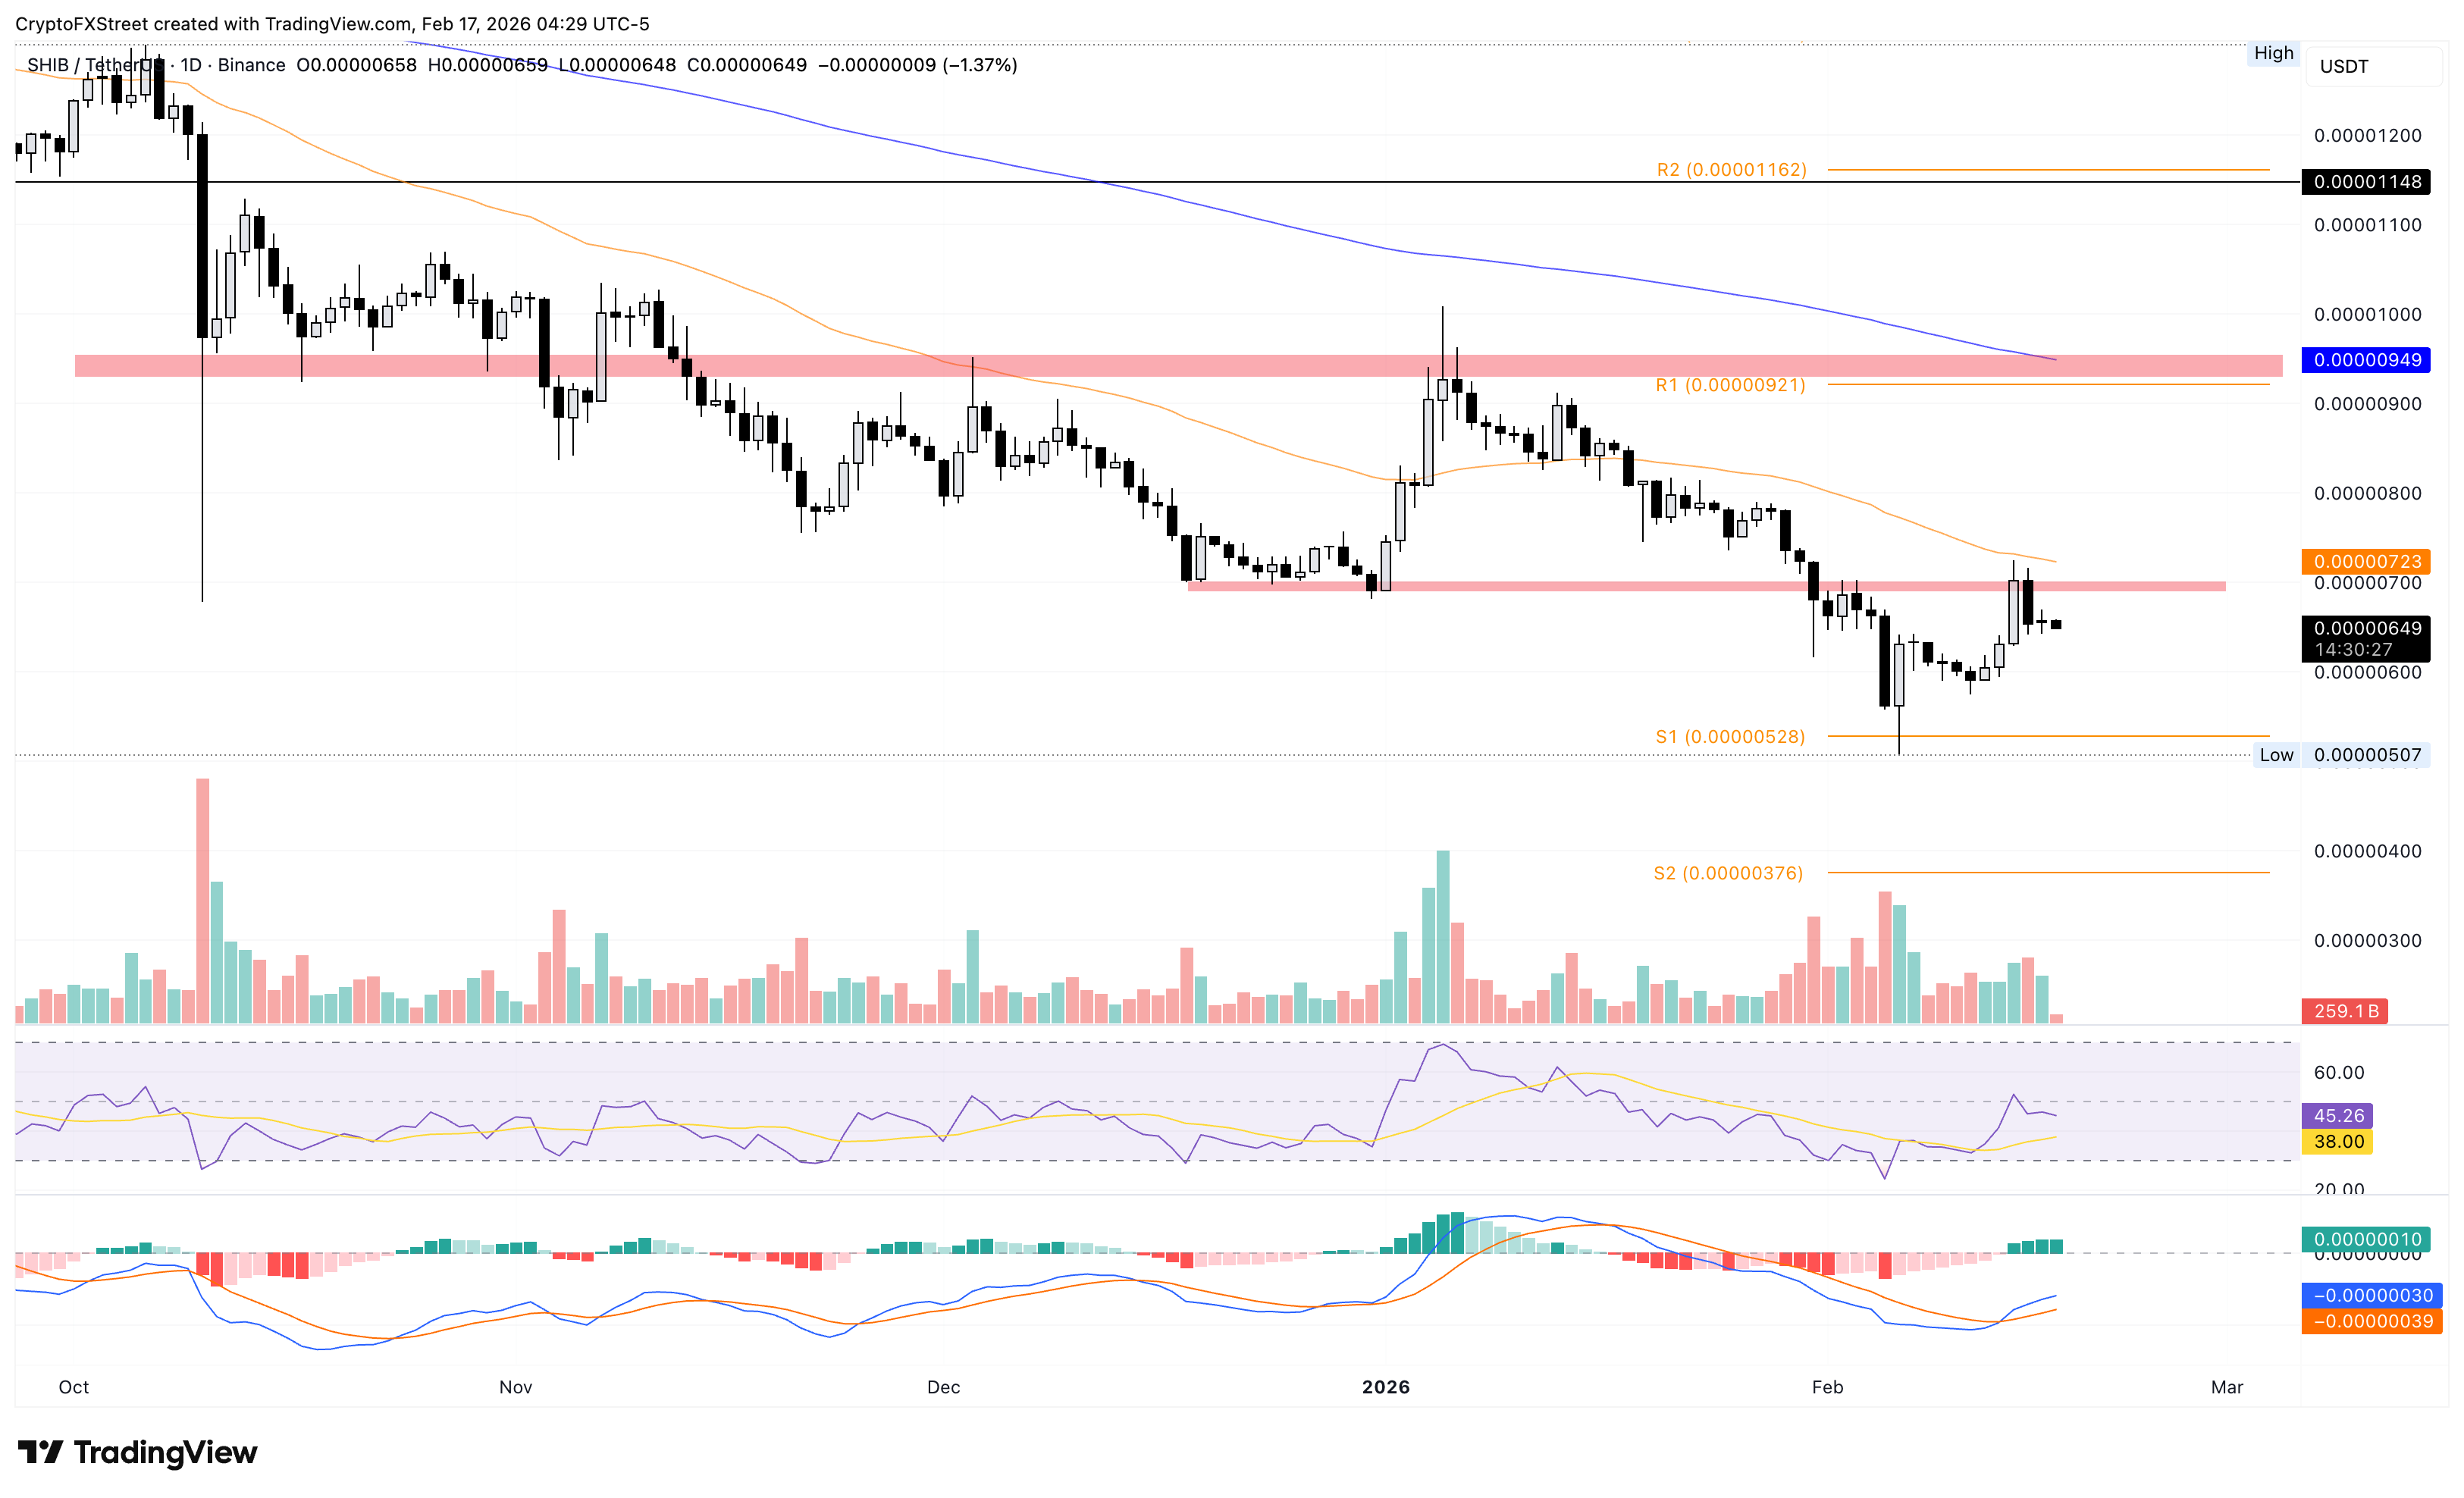
To reinstate an upward trend, Shiba Inu must surpass its 50-day Exponential Moving Average (EMA) at $0.00000723, which would open the door to the R1 pivot point at $0.0000921.
Pepe risks a drop to the local low
Pepe dropped below the 50-day EMA at $0.00000462 on Sunday with an over 8% decline. At the time of writing on Tuesday, the frog-themed meme coin continues its pullback, with a 3% drop, as bears target the $0.00000363 support level marked by the December 18 low.
As with other meme coins, bullish pressure is waning in Pepe. The RSI is at 49, slipping below the midline as buying pressure fades, while the MACD and signal line remain in negative territory, with histograms above the zero line waning.
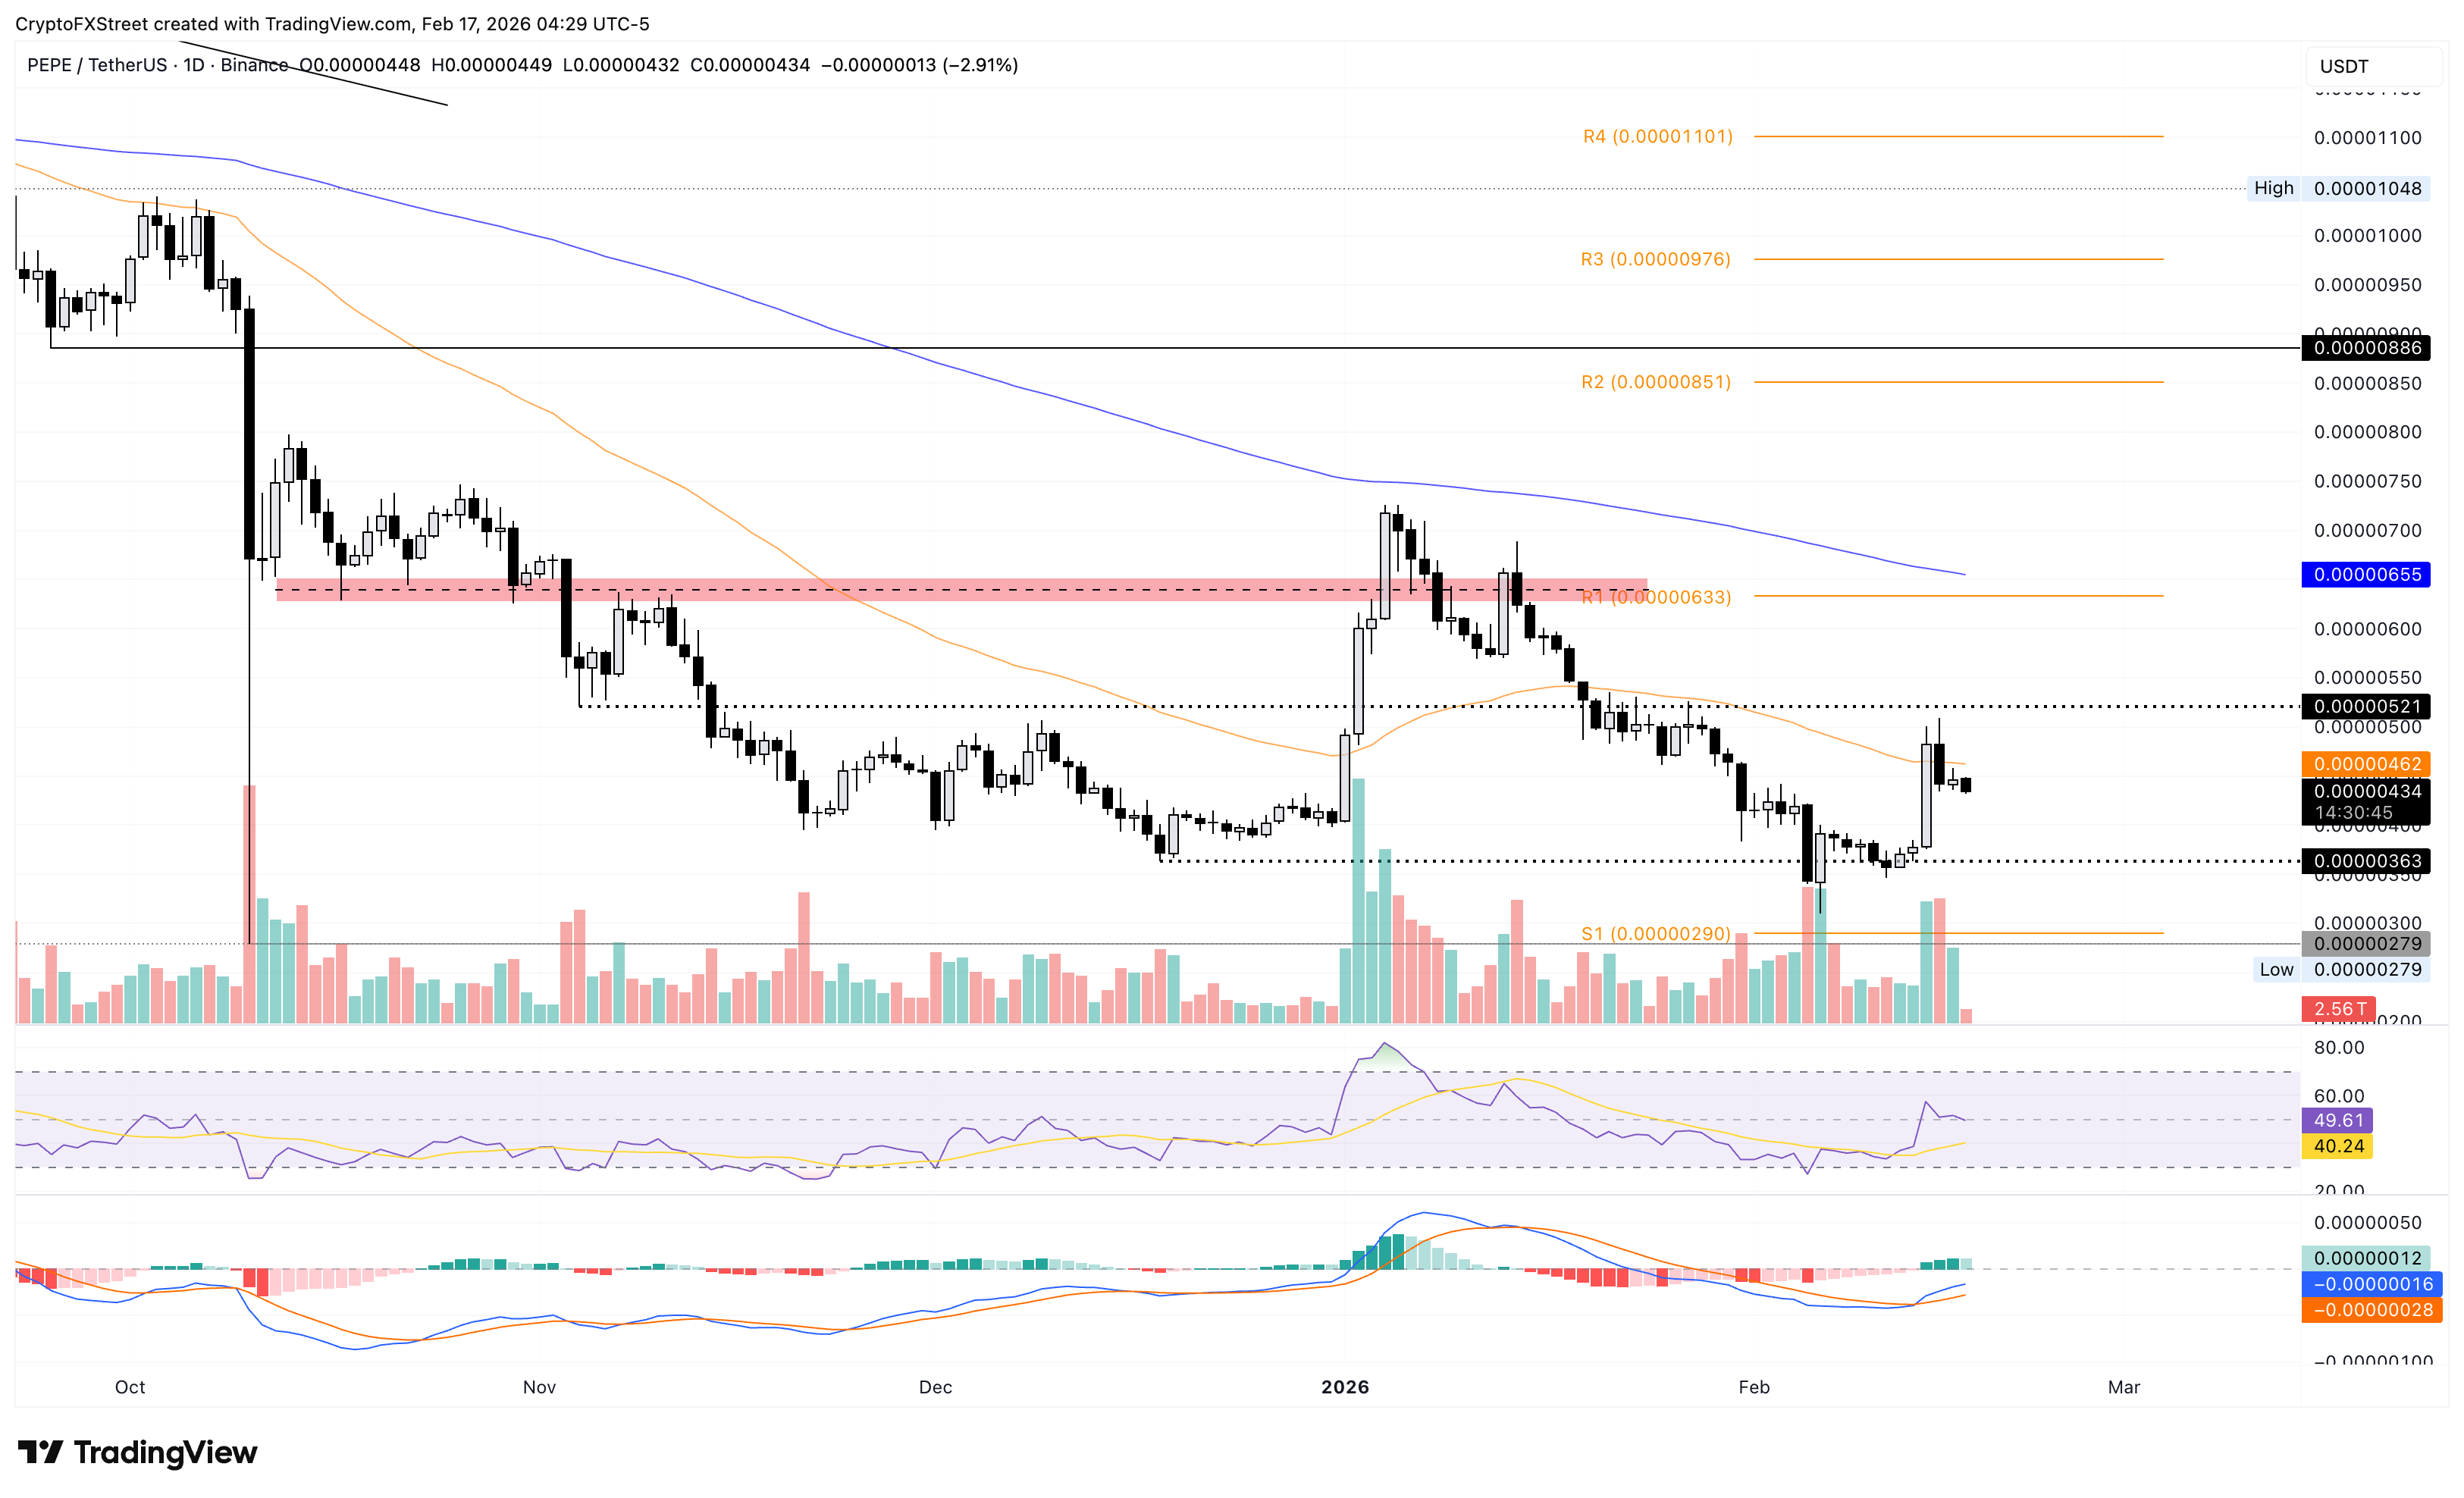
Pepe should surpass the $0.0000521 resistance level, which capped gains in late January, for a sustained recovery to the R1 pivot point at $0.0000633.

Oltre un milione di utenti si affida a FXStreet per dati di mercato in tempo reale, strumenti di charting, approfondimenti di esperti e notizie Forex. Il loro calendario economico completo e i webinar formativi aiutano i trader a rimanere informati e a prendere decisioni ponderate. FXStreet conta circa 60 professionisti tra la sede di Barcellona e diverse regioni globali.
Leggi di più


