
NZD/USD Price Forecast: Hold above 200-day SMA, Kiwi approaches 0.5900
Di Christian Borjon Valencia
Data di Pubblicazione: 7 Mar 2026 | Data di Modifica: 7 Mar 2026


ARTICOLI POPOLARI

The New Zealand Dollar erases some of its earlier losses, remains above the 200-day Simple Moving Average (SMA) of 0.5874, seems poised to finish Friday’s session virtually unchanged.
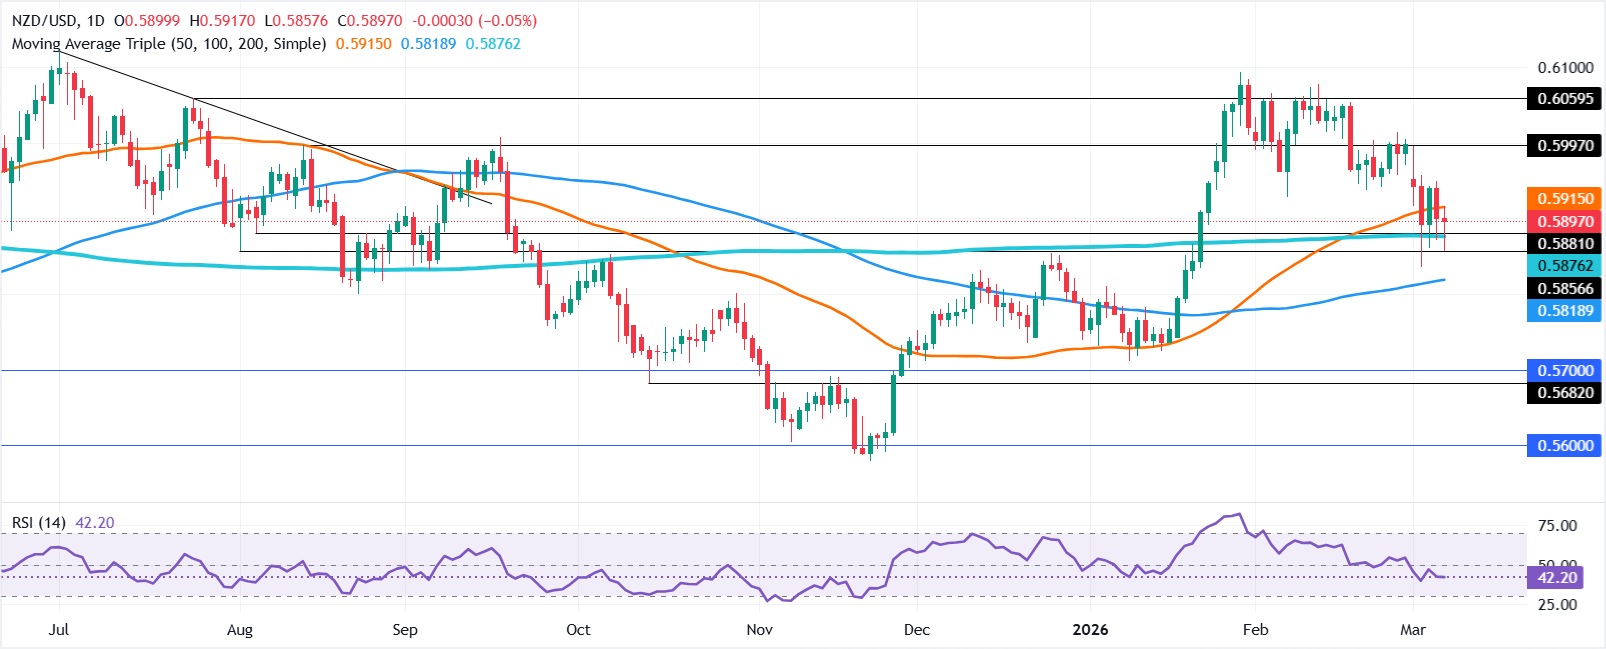
- NZD/USD steadies near 0.5900 as buyers defend the 200-day SMA at 0.5874.
- Break above 0.5900 would expose 0.5955 and the 20-day SMA at 0.5981.
- Drop below 200-day SMA risks slide toward 0.5817 and 0.5800 support.
The New Zealand Dollar erases some of its earlier losses, remains above the 200-day Simple Moving Average (SMA) of 0.5874, seems poised to finish Friday’s session virtually unchanged. At the time of writing, the NZD/USD hovers below the 0.5900 figure, which if broken, clears the path to retest weekly highs.
NZD/USD Price Forecast: Technical outlook
For the fourth straight day, the NZD/USD pierced the 200-day SMA, but buyers stepped in, driving the exchange rate within the 0.5880-0.5900 as they remain hopeful of pushing prices higher.
Nevertheless, momentum remains bearish as depicted by the Relative Strength Index (RSI), with the RSI’s slope aiming lower.
For a bullish continuation, buyers must push the exchange rate past 0.5900 followed by the March 3 high at 0.5955. On further strength the next area of interest would be the 20-day SMA at 0.5981 ahead of 0.6000.
On the flip side, and the most likely scenario the first support is the 200-day SMA. A break beneath the level will expose the 100-day SMA at 0.5817, before testing 0.5800.
NZD/USD Price Chart – Daily
New Zealand Dollar Price This week
The table below shows the percentage change of New Zealand Dollar (NZD) against listed major currencies this week. New Zealand Dollar was the strongest against the Euro.
| USD | EUR | GBP | JPY | CAD | AUD | NZD | CHF | |
|---|---|---|---|---|---|---|---|---|
| USD | 1.41% | 0.18% | 1.14% | -0.36% | 0.52% | 0.94% | 1.26% | |
| EUR | -1.41% | -1.23% | -0.31% | -1.76% | -0.88% | -0.47% | -0.16% | |
| GBP | -0.18% | 1.23% | 0.74% | -0.55% | 0.34% | 0.76% | 1.07% | |
| JPY | -1.14% | 0.31% | -0.74% | -1.43% | -0.56% | -0.08% | 0.16% | |
| CAD | 0.36% | 1.76% | 0.55% | 1.43% | 0.85% | 1.37% | 1.63% | |
| AUD | -0.52% | 0.88% | -0.34% | 0.56% | -0.85% | 0.41% | 0.71% | |
| NZD | -0.94% | 0.47% | -0.76% | 0.08% | -1.37% | -0.41% | 0.32% | |
| CHF | -1.26% | 0.16% | -1.07% | -0.16% | -1.63% | -0.71% | -0.32% |
The heat map shows percentage changes of major currencies against each other. The base currency is picked from the left column, while the quote currency is picked from the top row. For example, if you pick the New Zealand Dollar from the left column and move along the horizontal line to the US Dollar, the percentage change displayed in the box will represent NZD (base)/USD (quote).

Oltre un milione di utenti si affida a FXStreet per dati di mercato in tempo reale, strumenti di charting, approfondimenti di esperti e notizie Forex. Il loro calendario economico completo e i webinar formativi aiutano i trader a rimanere informati e a prendere decisioni ponderate. FXStreet conta circa 60 professionisti tra la sede di Barcellona e diverse regioni globali.
Leggi di più


