
Pi Network Price Forecast: PI rallies ahead of its first anniversary
Di Vishal Dixit
Data di Pubblicazione: 17 Feb 2026 | Data di Modifica: 17 Feb 2026


ARTICOLI POPOLARI

Pi Network (PI) trades above $0.1800 at the time of writing on Tuesday, recording nearly 5% gains so far. On-chain data indicate that large wallet investors, commonly known as whales, have accumulated approximately 4 million PI tokens over the last 24 hours.
- Pi Network is up roughly 5% on Tuesday, with bulls targeting a move above the 50-day EMA.
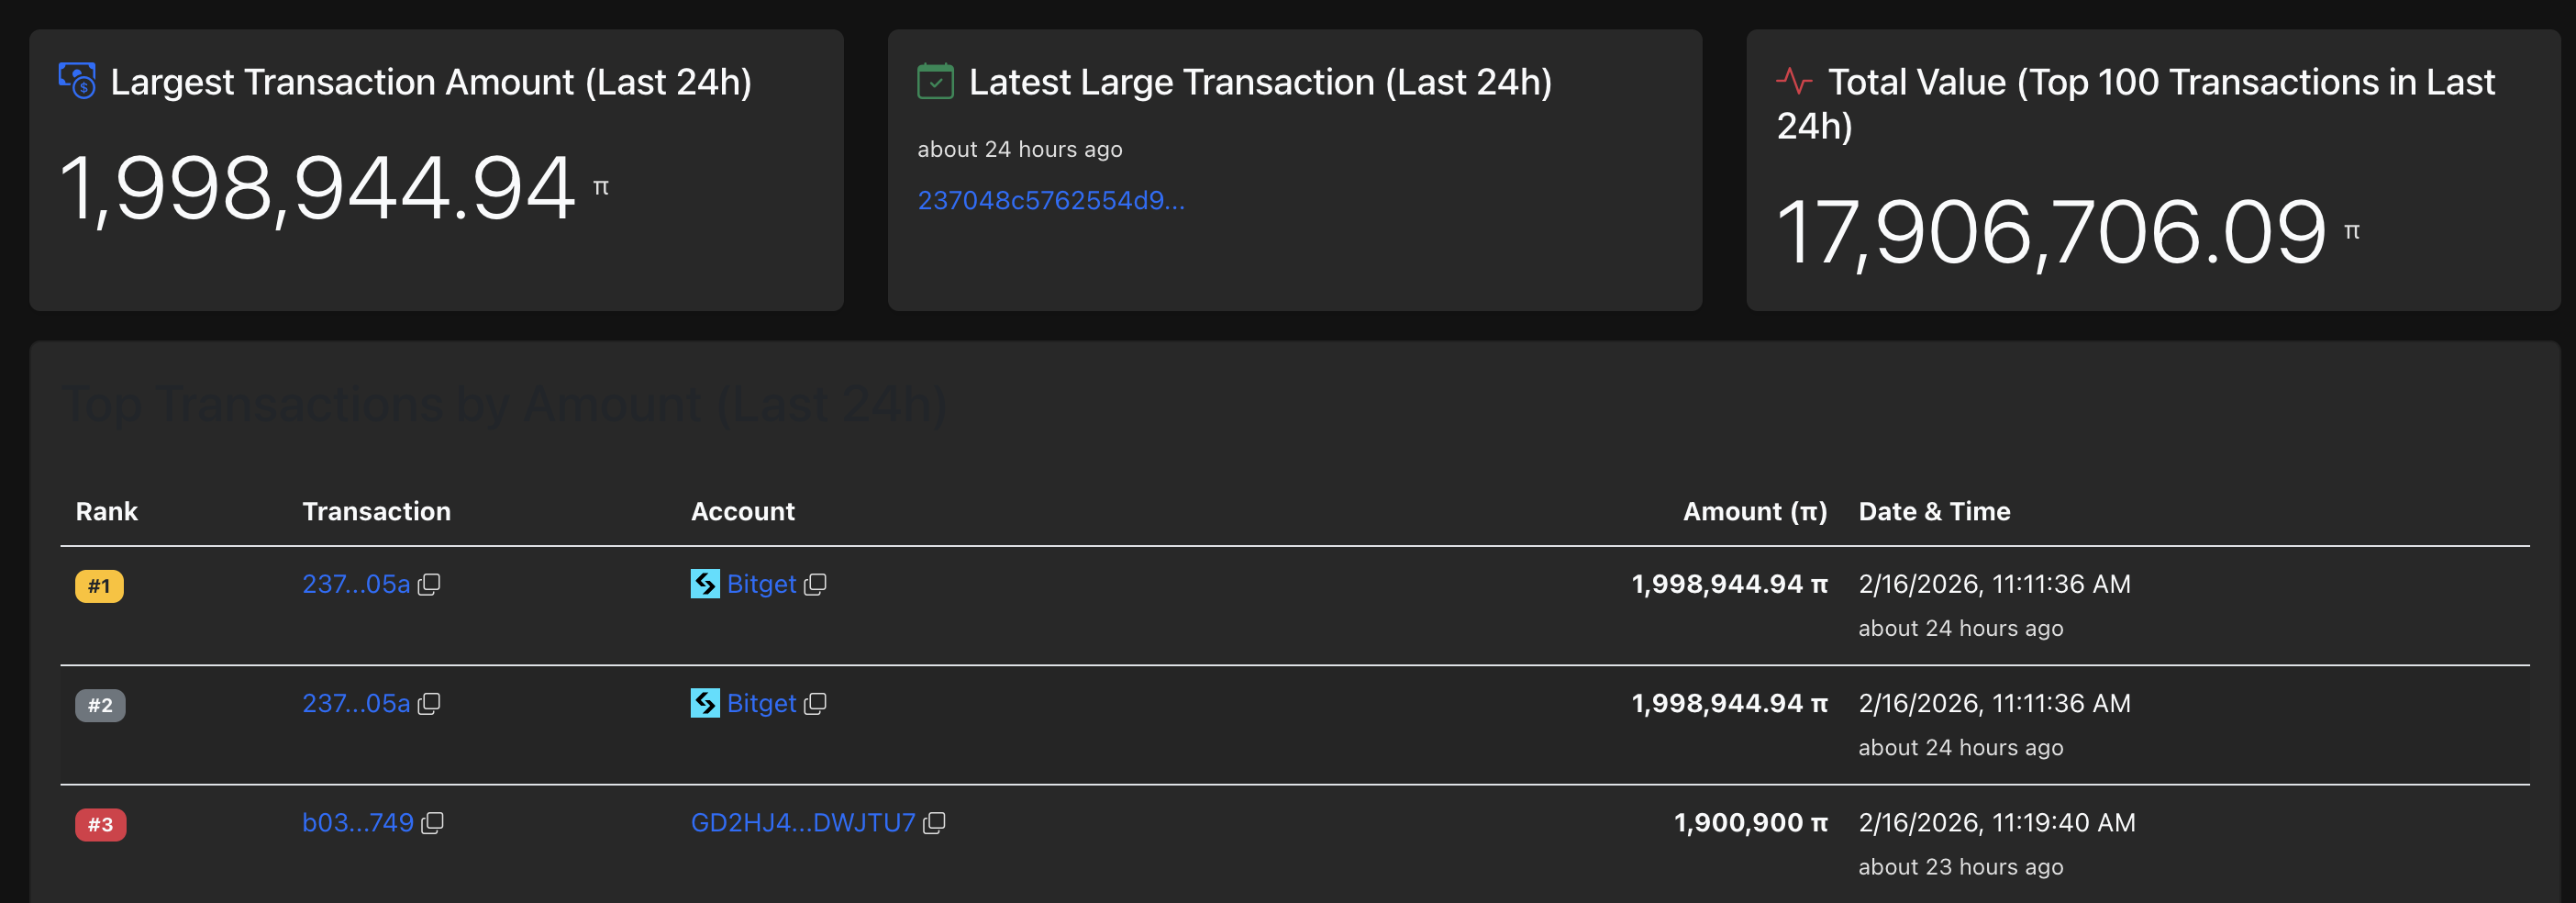
- PiScan data indicate that large wallet investors have acquired nearly 4 million PI tokens over the last 24 hours.
- The technical outlook for Pi Network centers on the 50-day EMA, which serves as the immediate resistance level.
Pi Network (PI) trades above $0.1800 at the time of writing on Tuesday, recording nearly 5% gains so far. On-chain data indicate that large wallet investors, commonly known as whales, have accumulated approximately 4 million PI tokens over the last 24 hours. Technically, Pi Network could extend its tally with a decisive breakout of the 50-day Exponential Moving Average (EMA).
Pi Network gains demand ahead of first release anniversary
Piscan data shows two large value withdrawals of 1.99 million PI tokens each over the last 24 hours, reflecting heightened demand from whales. The sudden increase in whale activity aligns with the upcoming first anniversary of the open-net release on Friday (February 20).
Pi Network eyes extend gains amid rising bullish momentum
Pi Network has shown a sharp 20% recovery since Thursday, bouncing off the S1 Pivot Point at $0.1327. The briskly V-shaped recovery tests the 50-day EMA at 0.1767 with bulls focusing on a potential breakout.
A decisive daily close above this level could confirm the bullish shift and extend the rally to the support-turned-resistance level, aligning with the October 11 low at $0.1919.
The technical indicators on the daily chart remain bullish. The Relative Strength Index (RSI) at 60 rises above the midline with more upside before reaching the overbought zone. At the same time, the Moving Average Convergence Divergence (MACD) shows a steady upward trend toward the zero line as positive histograms widen, suggesting increasing bullish momentum.
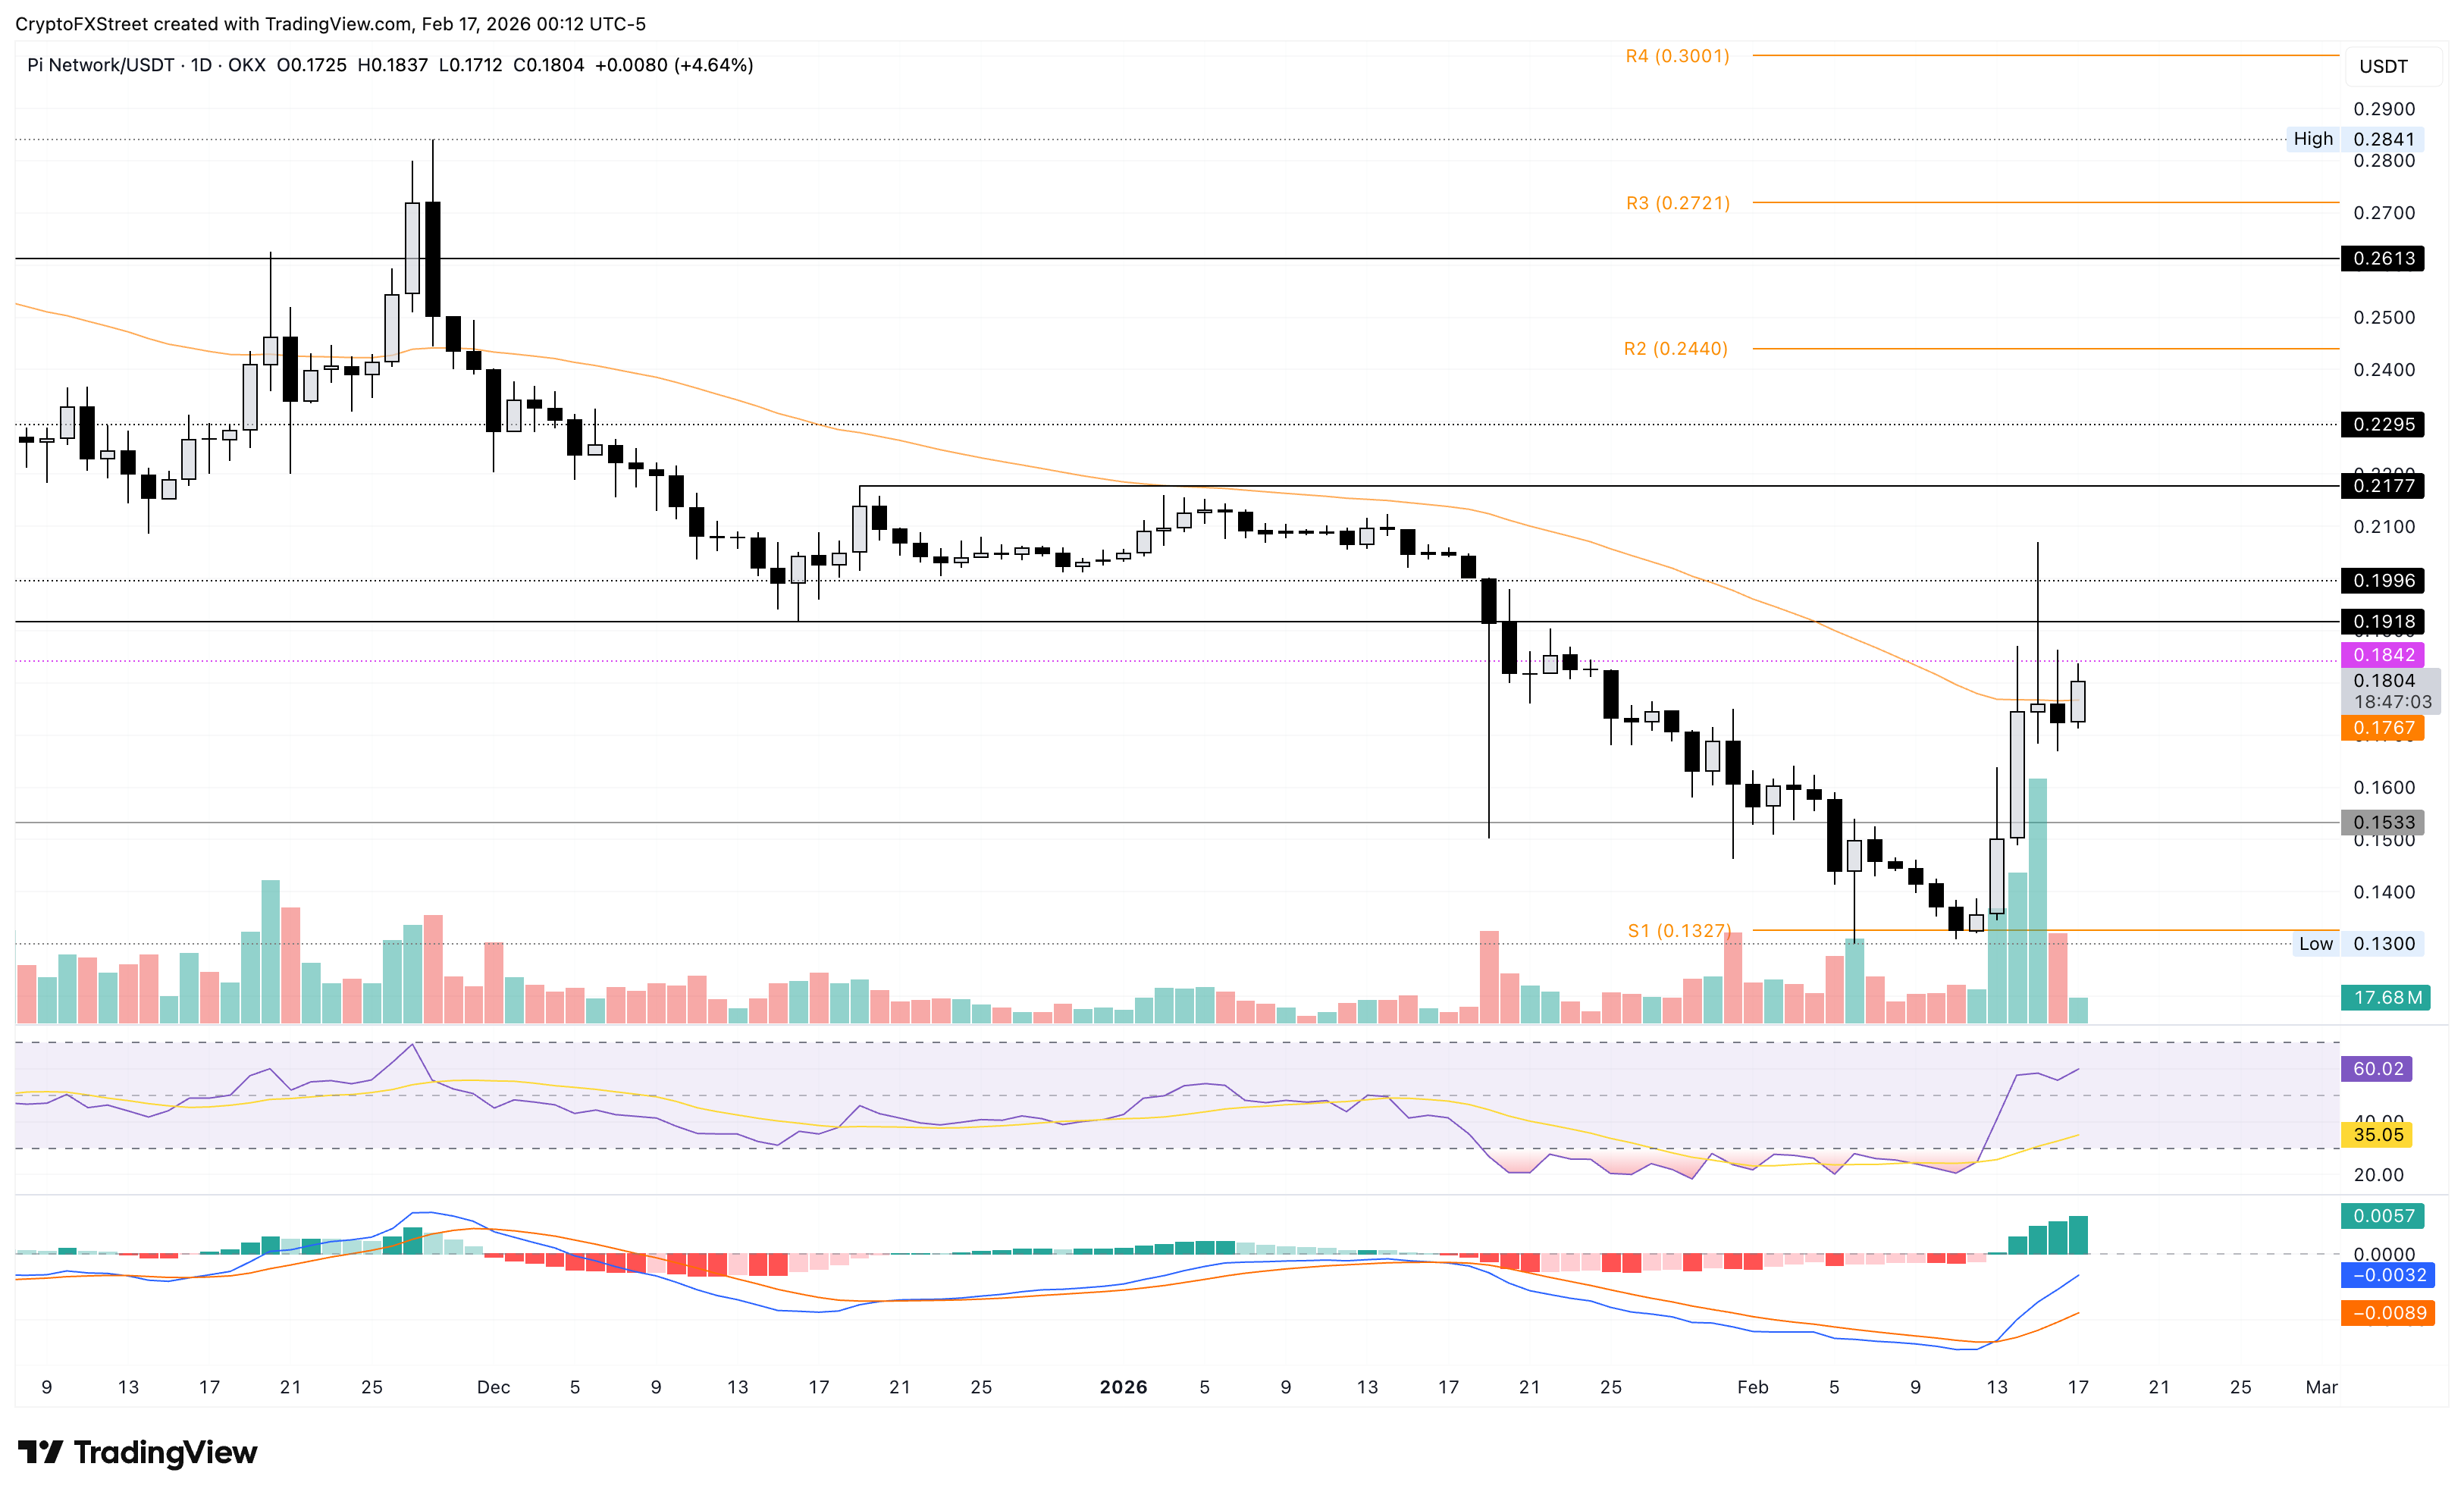
On the flip side, a close below $0.1767 could cap bullish momentum, likely leading to a retest of the October 10 low at $0.1533.

Oltre un milione di utenti si affida a FXStreet per dati di mercato in tempo reale, strumenti di charting, approfondimenti di esperti e notizie Forex. Il loro calendario economico completo e i webinar formativi aiutano i trader a rimanere informati e a prendere decisioni ponderate. FXStreet conta circa 60 professionisti tra la sede di Barcellona e diverse regioni globali.
Leggi di più


