
Ripple Price Forecast: XRP slides as low retail, institutional demand weigh
Di John Isige
Data di Pubblicazione: 3 Feb 2026 | Data di Modifica: 3 Feb 2026


ARTICOLI POPOLARI

Ripple (XRP) edges lower, trading marginally below $1.60 at the time of writing on Tuesday as bulls and bears battle for control. The cross-border remittance token rose to $1.66 on Monday, but profit-taking and risk-off sentiment in the broader crypto market led to the ongoing correction.
- XRP declines below $1.60 amid faltering sentiment across the crypto market.
- XRP ETFs see mild outflows on Monday amid low retail demand, with futures Open Interest at $2.93 billion.
- The MACD and RSI indicators align with short-term bearish momentum, increasing the odds of XRP retesting $1.50.
Ripple (XRP) edges lower, trading marginally below $1.60 at the time of writing on Tuesday as bulls and bears battle for control. The cross-border remittance token rose to $1.66 on Monday, but profit-taking and risk-off sentiment in the broader crypto market led to the ongoing correction.
XRP faces ETF pressure amid muted retail activity
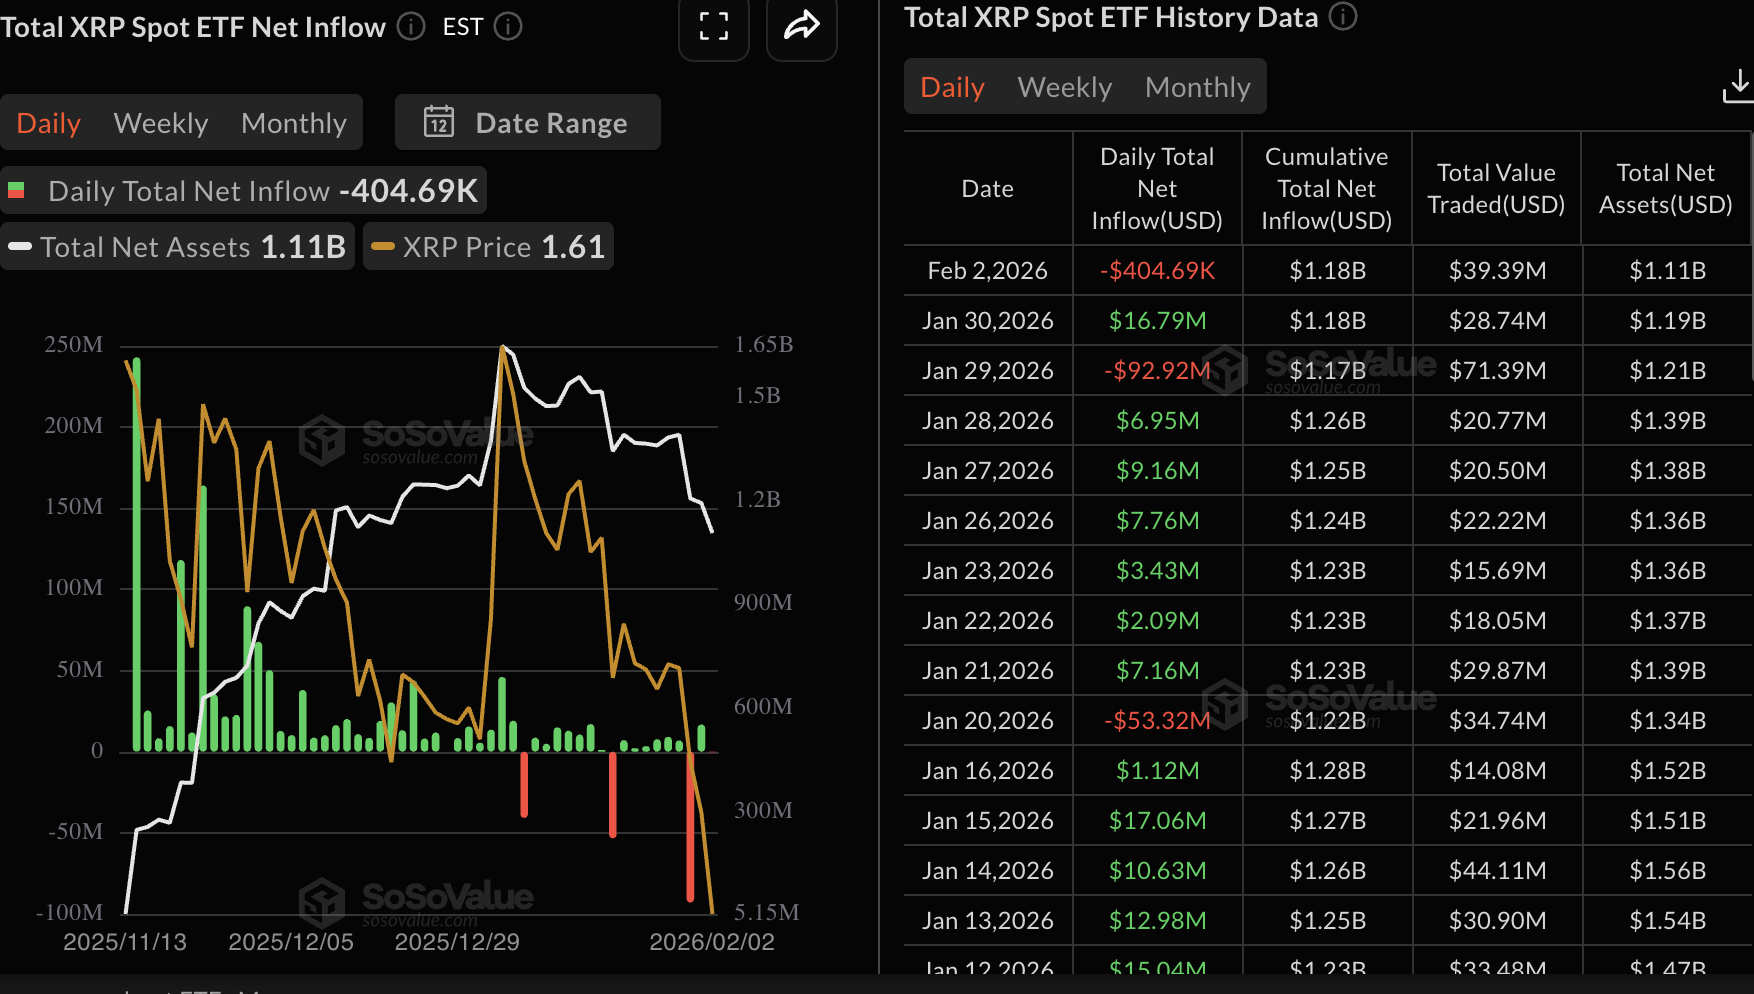
XRP spot Exchange-Traded Funds (ETFs) turned bearish on Monday, posting outflows of approximately $405,000. The outflow came after XRP ETFs posted nearly $17 million in inflows on Friday, underscoring the apparent risk-averse sentiment. The cumulative inflow currently stands at $1.18 billion, with total assets under management at $1.11 billion.
ETFs flows serve as a gauge of market sentiment, with large or steady inflows indicating that investors are confident XRP could sustain a short-term recovery. However, if outflows become dominant in the coming days, XRP could remain in bearish hands for longer, weighed down by weak sentiment.
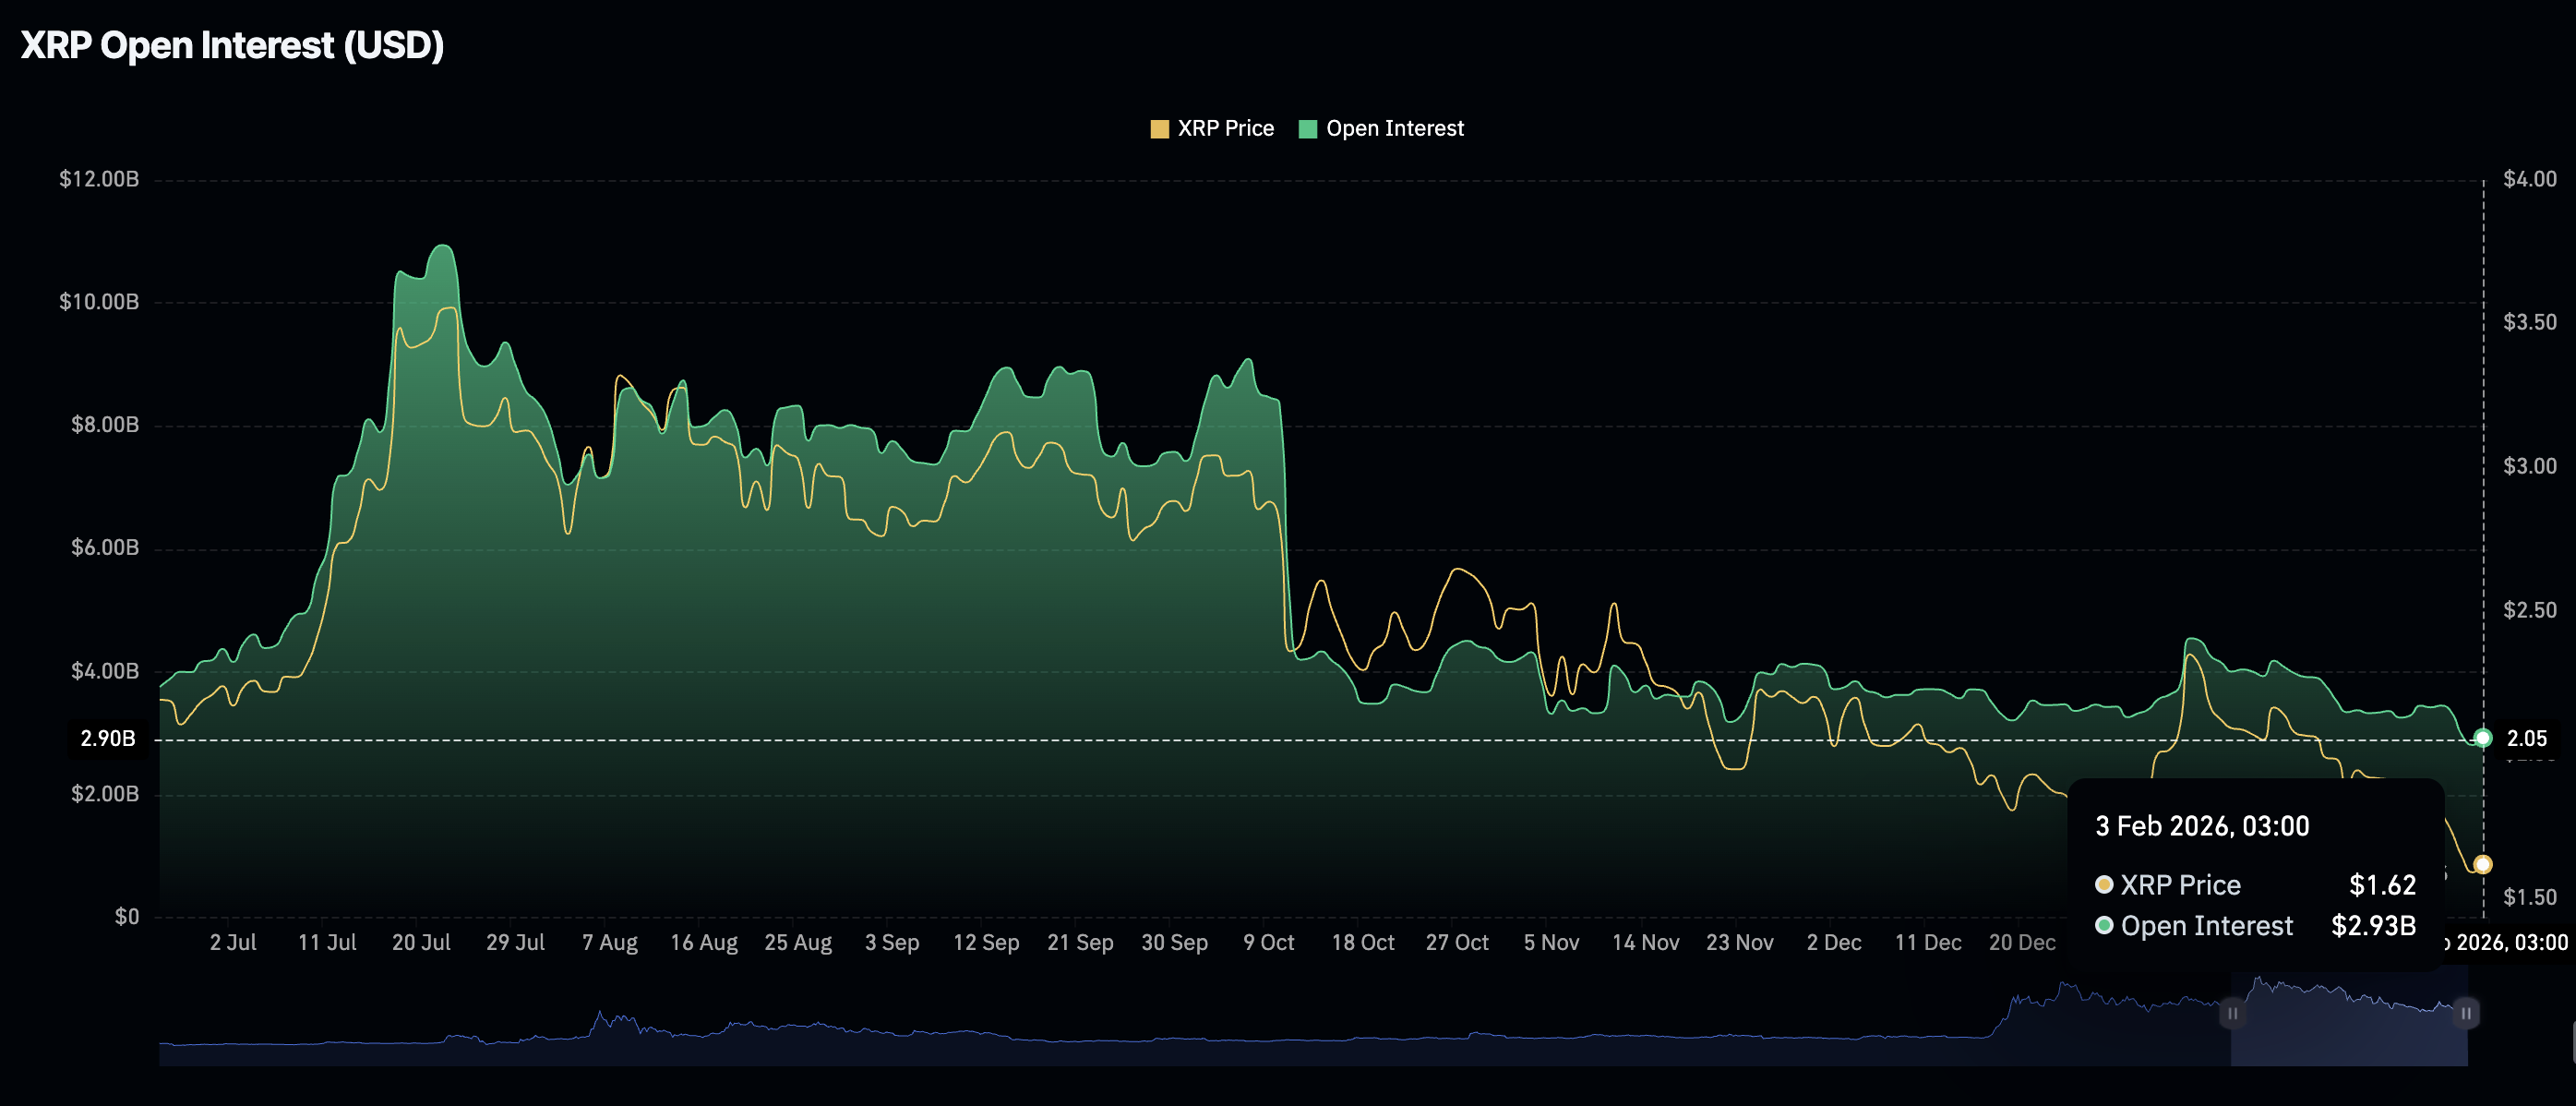
Meanwhile, the XRP derivatives market is also weak, as evidenced by futures Open Interest (OI) rising slightly to $2.93 billion on Tuesday, from $2.81 billion on Monday.
Despite the slight increase, OI, which tracks the notional value of outstanding futures contracts, averaged $4.55 billion on January 6 and $8.36 billion on October 10, before the crash that liquidated over $19 billion across crypto assets.
In context, the futures OI peaked at $10.94 billion on July 22 after XRP traded at $3.66, its historical high, on July 18. To sustain an extended recovery, OI should rise steadily, indicating that investors are confident in the token’s short to medium-term outlook.
Technical outlook: XRP wobbles amid headwinds
XRP exhibits a bearish bias, trading below $1.60, undermined by a weakening technical structure. The remittance token’s position below the 50-day Exponential Moving Average (EMA) at $1.94, the 100-day EMA at $2.09 and the 200-day EMA at $2.24, reinforces the bearish thesis.
Similarly, the Moving Average Convergence Divergence (MACD) indicator remains below its signal line on the daily chart, as sell-side pressure expands. The red histogram bars show signs of fading, but hold below the zero line, suggesting that bearish momentum may push prices lower.
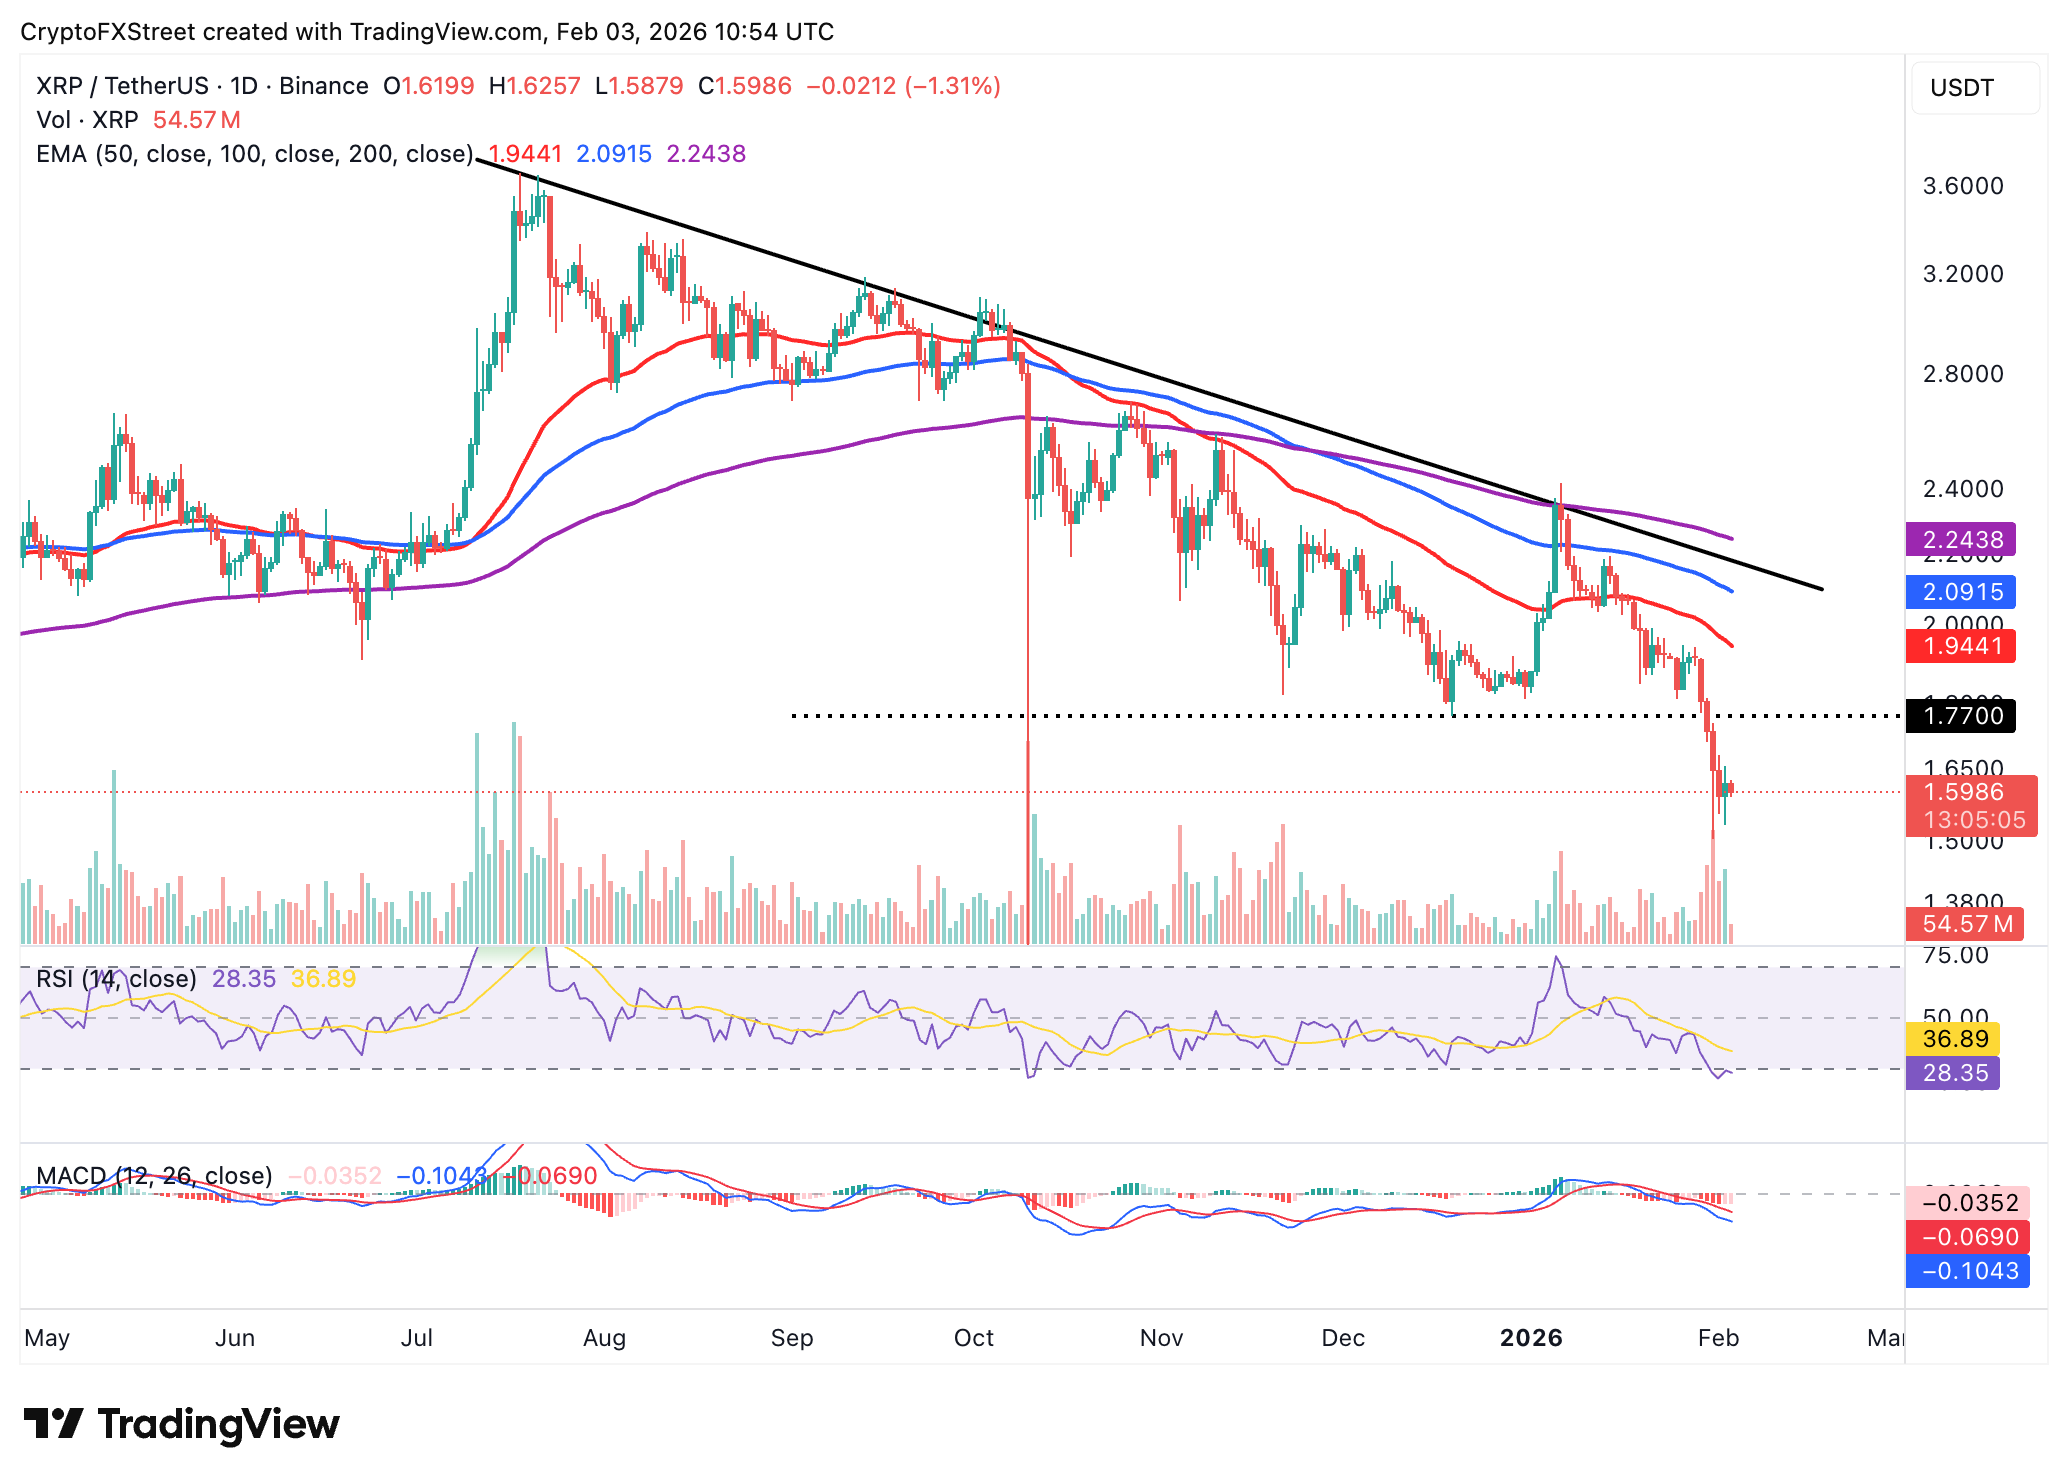
Traders should watch the Relative Strength Index (RSI), which is at 28 and poised to rise from oversold territory. A steady increase in the RSI toward the midline would confirm that the bearish momentum is easing.
A daily close below the $1.60 pivotal level could accelerate the losses to Saturday’s low at $1.50. Still, if bulls increase exposure, a reversal toward Monday’s high at $1.66 would help shape XRP’s upside outlook.
Open Interest, funding rate FAQs
Higher Open Interest is associated with higher liquidity and new capital inflow to the market. This is considered the equivalent of increase in efficiency and the ongoing trend continues. When Open Interest decreases, it is considered a sign of liquidation in the market, investors are leaving and the overall demand for an asset is on a decline, fueling a bearish sentiment among investors.
Funding fees bridge the difference between spot prices and prices of futures contracts of an asset by increasing liquidation risks faced by traders. A consistently high and positive funding rate implies there is a bullish sentiment among market participants and there is an expectation of a price hike. A consistently negative funding rate for an asset implies a bearish sentiment, indicating that traders expect the cryptocurrency’s price to fall and a bearish trend reversal is likely to occur.

Oltre un milione di utenti si affida a FXStreet per dati di mercato in tempo reale, strumenti di charting, approfondimenti di esperti e notizie Forex. Il loro calendario economico completo e i webinar formativi aiutano i trader a rimanere informati e a prendere decisioni ponderate. FXStreet conta circa 60 professionisti tra la sede di Barcellona e diverse regioni globali.
Leggi di più


