
Silver Price Forecast: XAG/USD eyes $83.00 near upper descending wedge boundary
Di Akhtar Faruqui
Data di Pubblicazione: 11 Feb 2026 | Data di Modifica: 11 Feb 2026


ARTICOLI POPOLARI

Silver price (XAG/USD) gains ground for the second consecutive day, trading around $82.60 per troy ounce during the early European hours on Monday.
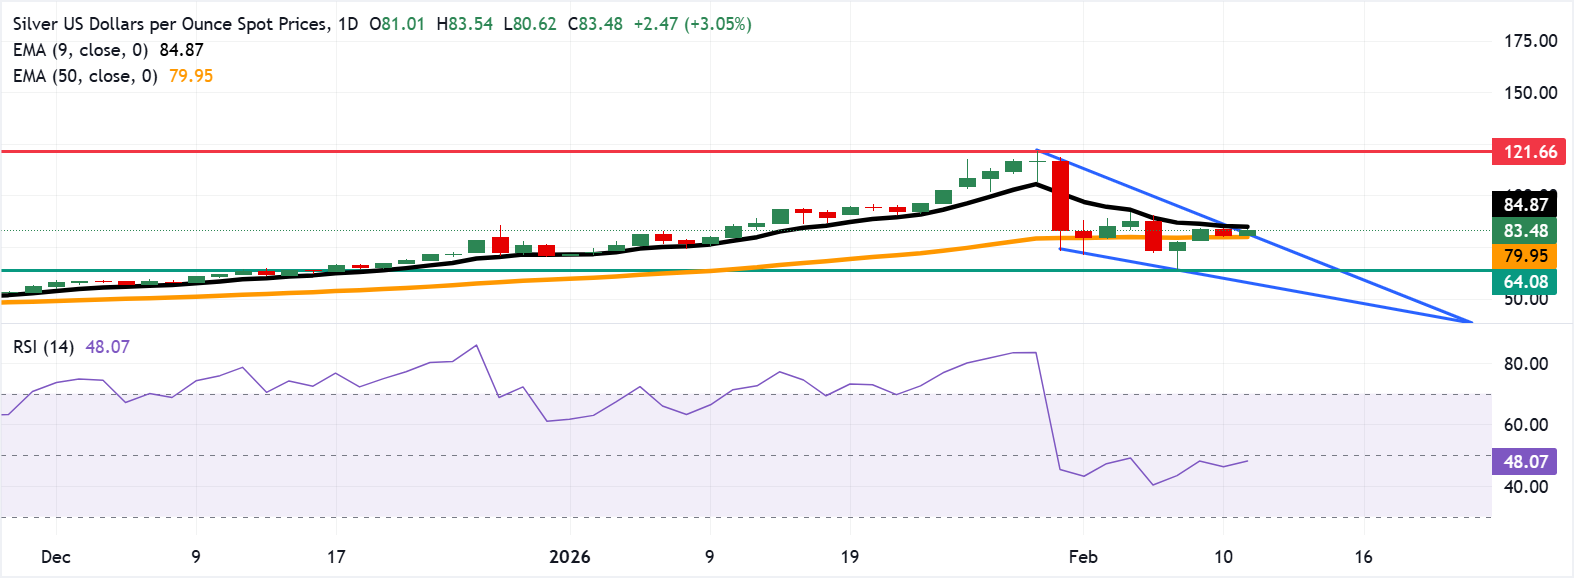
- Silver price rises toward the upper descending wedge boundary around $84.50.
- The 14-day RSI at 47 in neutral territory has edged higher, signaling stabilizing momentum.
- The primary support lies at the 50-day EMA at $79.91.
Silver price (XAG/USD) gains ground for the second consecutive day, trading around $82.60 per troy ounce during the early European hours on Monday. The technical analysis of the daily chart timeframe suggests a likely reversal to the upside as the precious metal tests the upper boundary of the descending wedge pattern. Additionally, the 14-day Relative Strength Index (RSI) at 47 (neutral) has ticked up, indicating stabilizing momentum.
Silver price holds above the rising 50-day Exponential Moving Average (EMA) but trades beneath the falling nine-day EMA, keeping the broader trend supported while capping immediate rebounds. The medium-term average continues to edge higher, signaling underlying demand. Reclaiming the nine-day EMA would improve upside traction toward resistance at $121.66.
On the upside, the immediate resistance lies at the upper boundary of the descending wedge around $84.50, followed by the nine-day at $84.66. A close back above the short-term average would ease near-term pressure and support the Silver price to explore the region around the all-time high of $121.66, reached on January 29.
Failure to overcome the short-term cap would keep the recovery fragile and leave risks skewed toward a retest of the 50-day EMA at $79.91, while a close below that baseline would shift the bias lower toward the eight-week low of $64.08, recorded on February 6, followed by the lower descending wedge boundary around $59.10.
(The technical analysis of this story was written with the help of an AI tool.)
Silver FAQs
Silver is a precious metal highly traded among investors. It has been historically used as a store of value and a medium of exchange. Although less popular than Gold, traders may turn to Silver to diversify their investment portfolio, for its intrinsic value or as a potential hedge during high-inflation periods. Investors can buy physical Silver, in coins or in bars, or trade it through vehicles such as Exchange Traded Funds, which track its price on international markets.
Silver prices can move due to a wide range of factors. Geopolitical instability or fears of a deep recession can make Silver price escalate due to its safe-haven status, although to a lesser extent than Gold's. As a yieldless asset, Silver tends to rise with lower interest rates. Its moves also depend on how the US Dollar (USD) behaves as the asset is priced in dollars (XAG/USD). A strong Dollar tends to keep the price of Silver at bay, whereas a weaker Dollar is likely to propel prices up. Other factors such as investment demand, mining supply – Silver is much more abundant than Gold – and recycling rates can also affect prices.
Silver is widely used in industry, particularly in sectors such as electronics or solar energy, as it has one of the highest electric conductivity of all metals – more than Copper and Gold. A surge in demand can increase prices, while a decline tends to lower them. Dynamics in the US, Chinese and Indian economies can also contribute to price swings: for the US and particularly China, their big industrial sectors use Silver in various processes; in India, consumers’ demand for the precious metal for jewellery also plays a key role in setting prices.
Silver prices tend to follow Gold's moves. When Gold prices rise, Silver typically follows suit, as their status as safe-haven assets is similar. The Gold/Silver ratio, which shows the number of ounces of Silver needed to equal the value of one ounce of Gold, may help to determine the relative valuation between both metals. Some investors may consider a high ratio as an indicator that Silver is undervalued, or Gold is overvalued. On the contrary, a low ratio might suggest that Gold is undervalued relative to Silver.

Oltre un milione di utenti si affida a FXStreet per dati di mercato in tempo reale, strumenti di charting, approfondimenti di esperti e notizie Forex. Il loro calendario economico completo e i webinar formativi aiutano i trader a rimanere informati e a prendere decisioni ponderate. FXStreet conta circa 60 professionisti tra la sede di Barcellona e diverse regioni globali.
Leggi di più


