
Solana Price Forecast: SOL consolidates amid rising Middle East tensions
Di Vishal Dixit
Data di Pubblicazione: 2 Mar 2026 | Data di Modifica: 2 Mar 2026


ARTICOLI POPOLARI

Solana (SOL) trades around $84 at press time on Monday, coiling further within a consolidation range that keeps the momentum trapped. Institutional interest in Solana resurfaced last week, with inflows of over $44 million capping downside pressure.
- Solana trades below $85, extending its consolidation range for over three weeks.
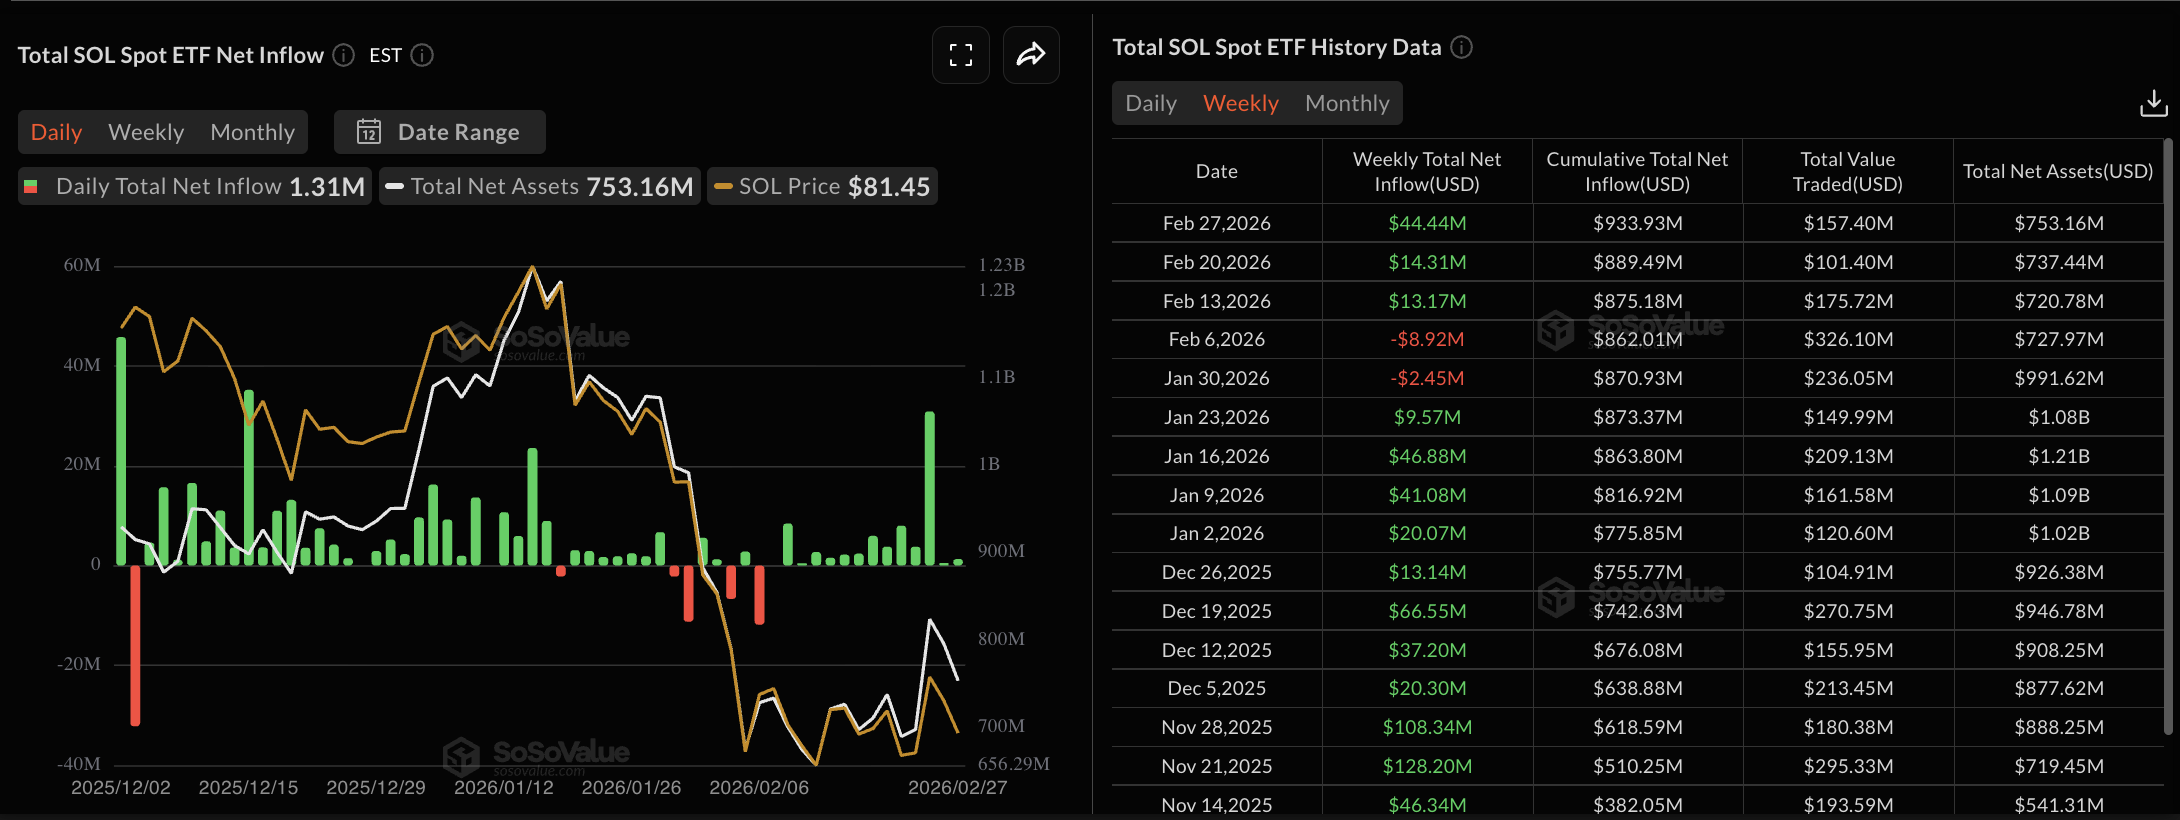
- US spot Solana ETFs record an inflow of over $44 million, reflecting renewed institutional demand.
- A sudden drop in SOL futures Open Interest while funding rate remains positive suggests mixed retail sentiment amid US-Israel strike on Iran.
Solana (SOL) trades around $84 at press time on Monday, coiling further within a consolidation range that keeps the momentum trapped. Institutional interest in Solana resurfaced last week, with inflows of over $44 million capping downside pressure. However, retail strength remains low as SOL futures Open Interest declines, while funding rates remain positive, reflecting bullish anticipation among traders.
Middle East tensions weigh on the institutional demand for Solana
Solana regained institutional support last week, as evidenced by the US spot SOL Exchange Traded Funds (ETFs) recorded $44.44 million in weekly inflows, driven by $30.86 million in daily inflows on Wednesday.
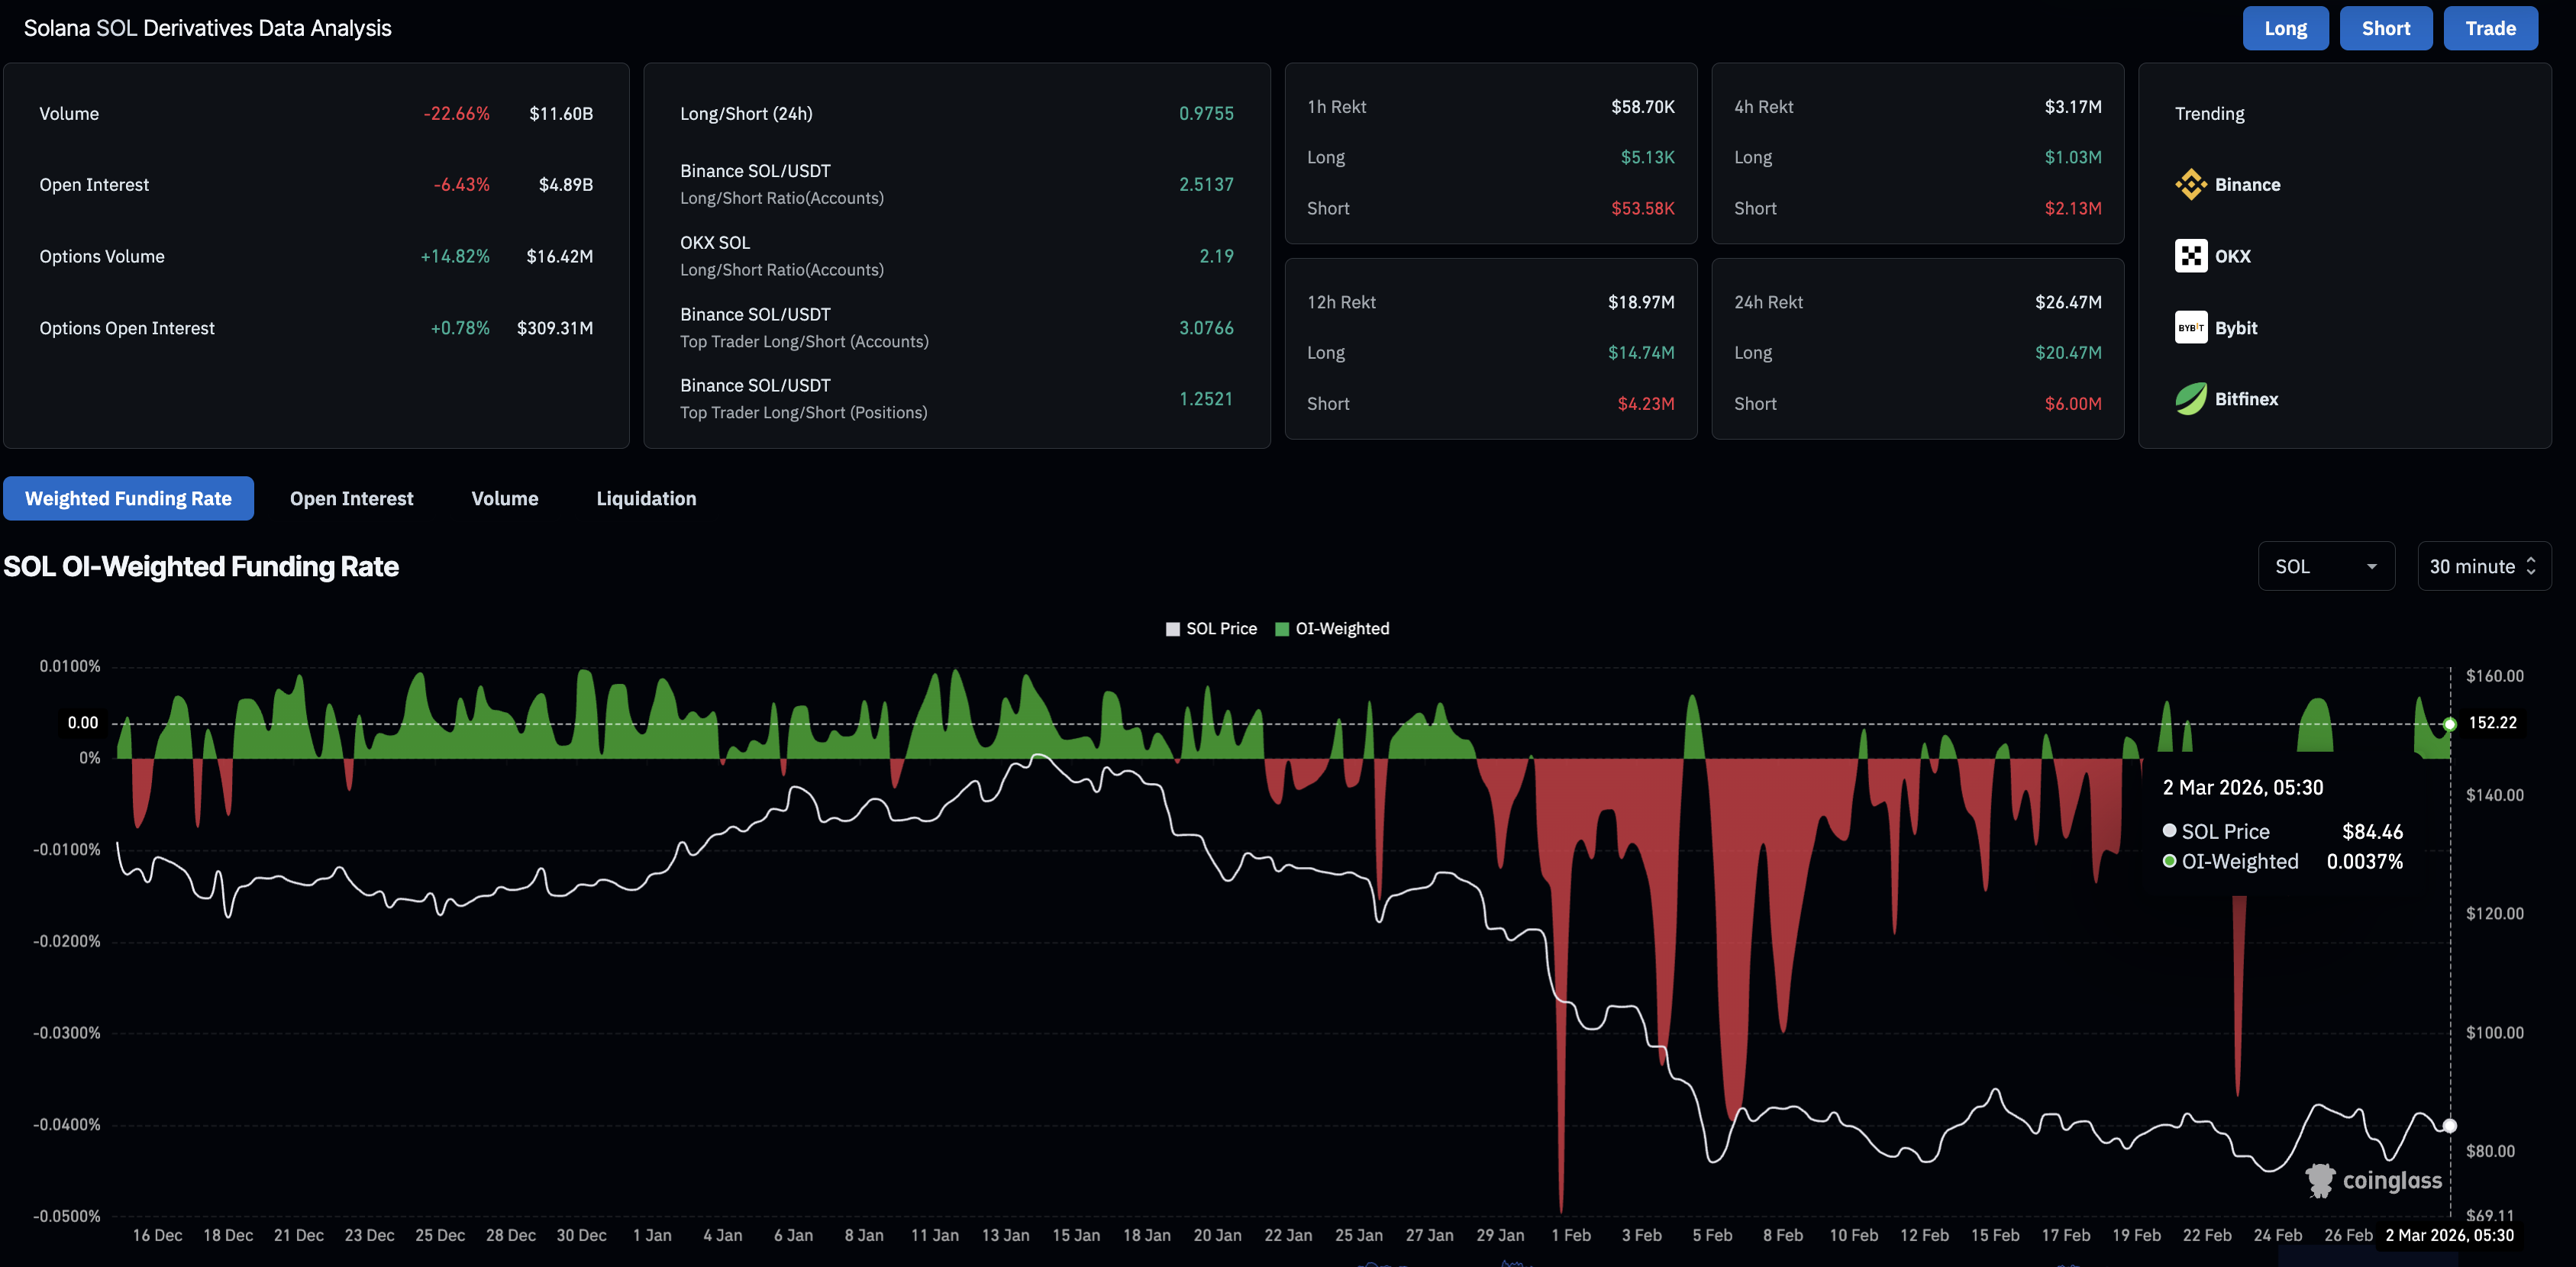
However, the retail sentiment in the broader cryptocurrency market shifts to risk-averse amid the ongoing conflict in the Middle East. CoinGlass data shows the SOL futures Open Interest (OI) is at $4.89 billion on Monday, down over 6% in the last 24 hours, suggesting a significant loss of notional value of outstanding contracts due to positional unwinding. Corroborating this positional wipeout, total liquidations of $26.47 million in the same time period were led by $20.47 million in long liquidations, suggesting a broader wipeout of bullish positions.
Still, the funding rate remains at 0.0037% as of Monday, suggesting that traders are willing to build and hold long positions at a premium.
Technical outlook: Will Solana hold its consolidation?
Solana hovers near $85.00 at press time on Monday, extending the consolidation range from the $77.60 low to the $93.43 high of February 5. The near-term bias is neutral with a bearish tilt, as SOL remains below the 50-day and 200-day Exponential Moving Averages (EMAs) at $99.06 and $137.23, which could cap a recovery attempt.
The Moving Average Convergence Divergence (MACD) has extended higher above its signal line, rising from negative territory, while the histogram flattens, suggesting fading upside momentum. The Relative Strength Index (RSI) at 44 remains below the midline, reflecting weak demand and aligning with the broader market risk-off sentiment.
The path of least resistance targets $77.60 as the immediate support level, which provided multiple bounce-backs in February. If SOL clears below this level, it could test the February 6 low at $67.50.
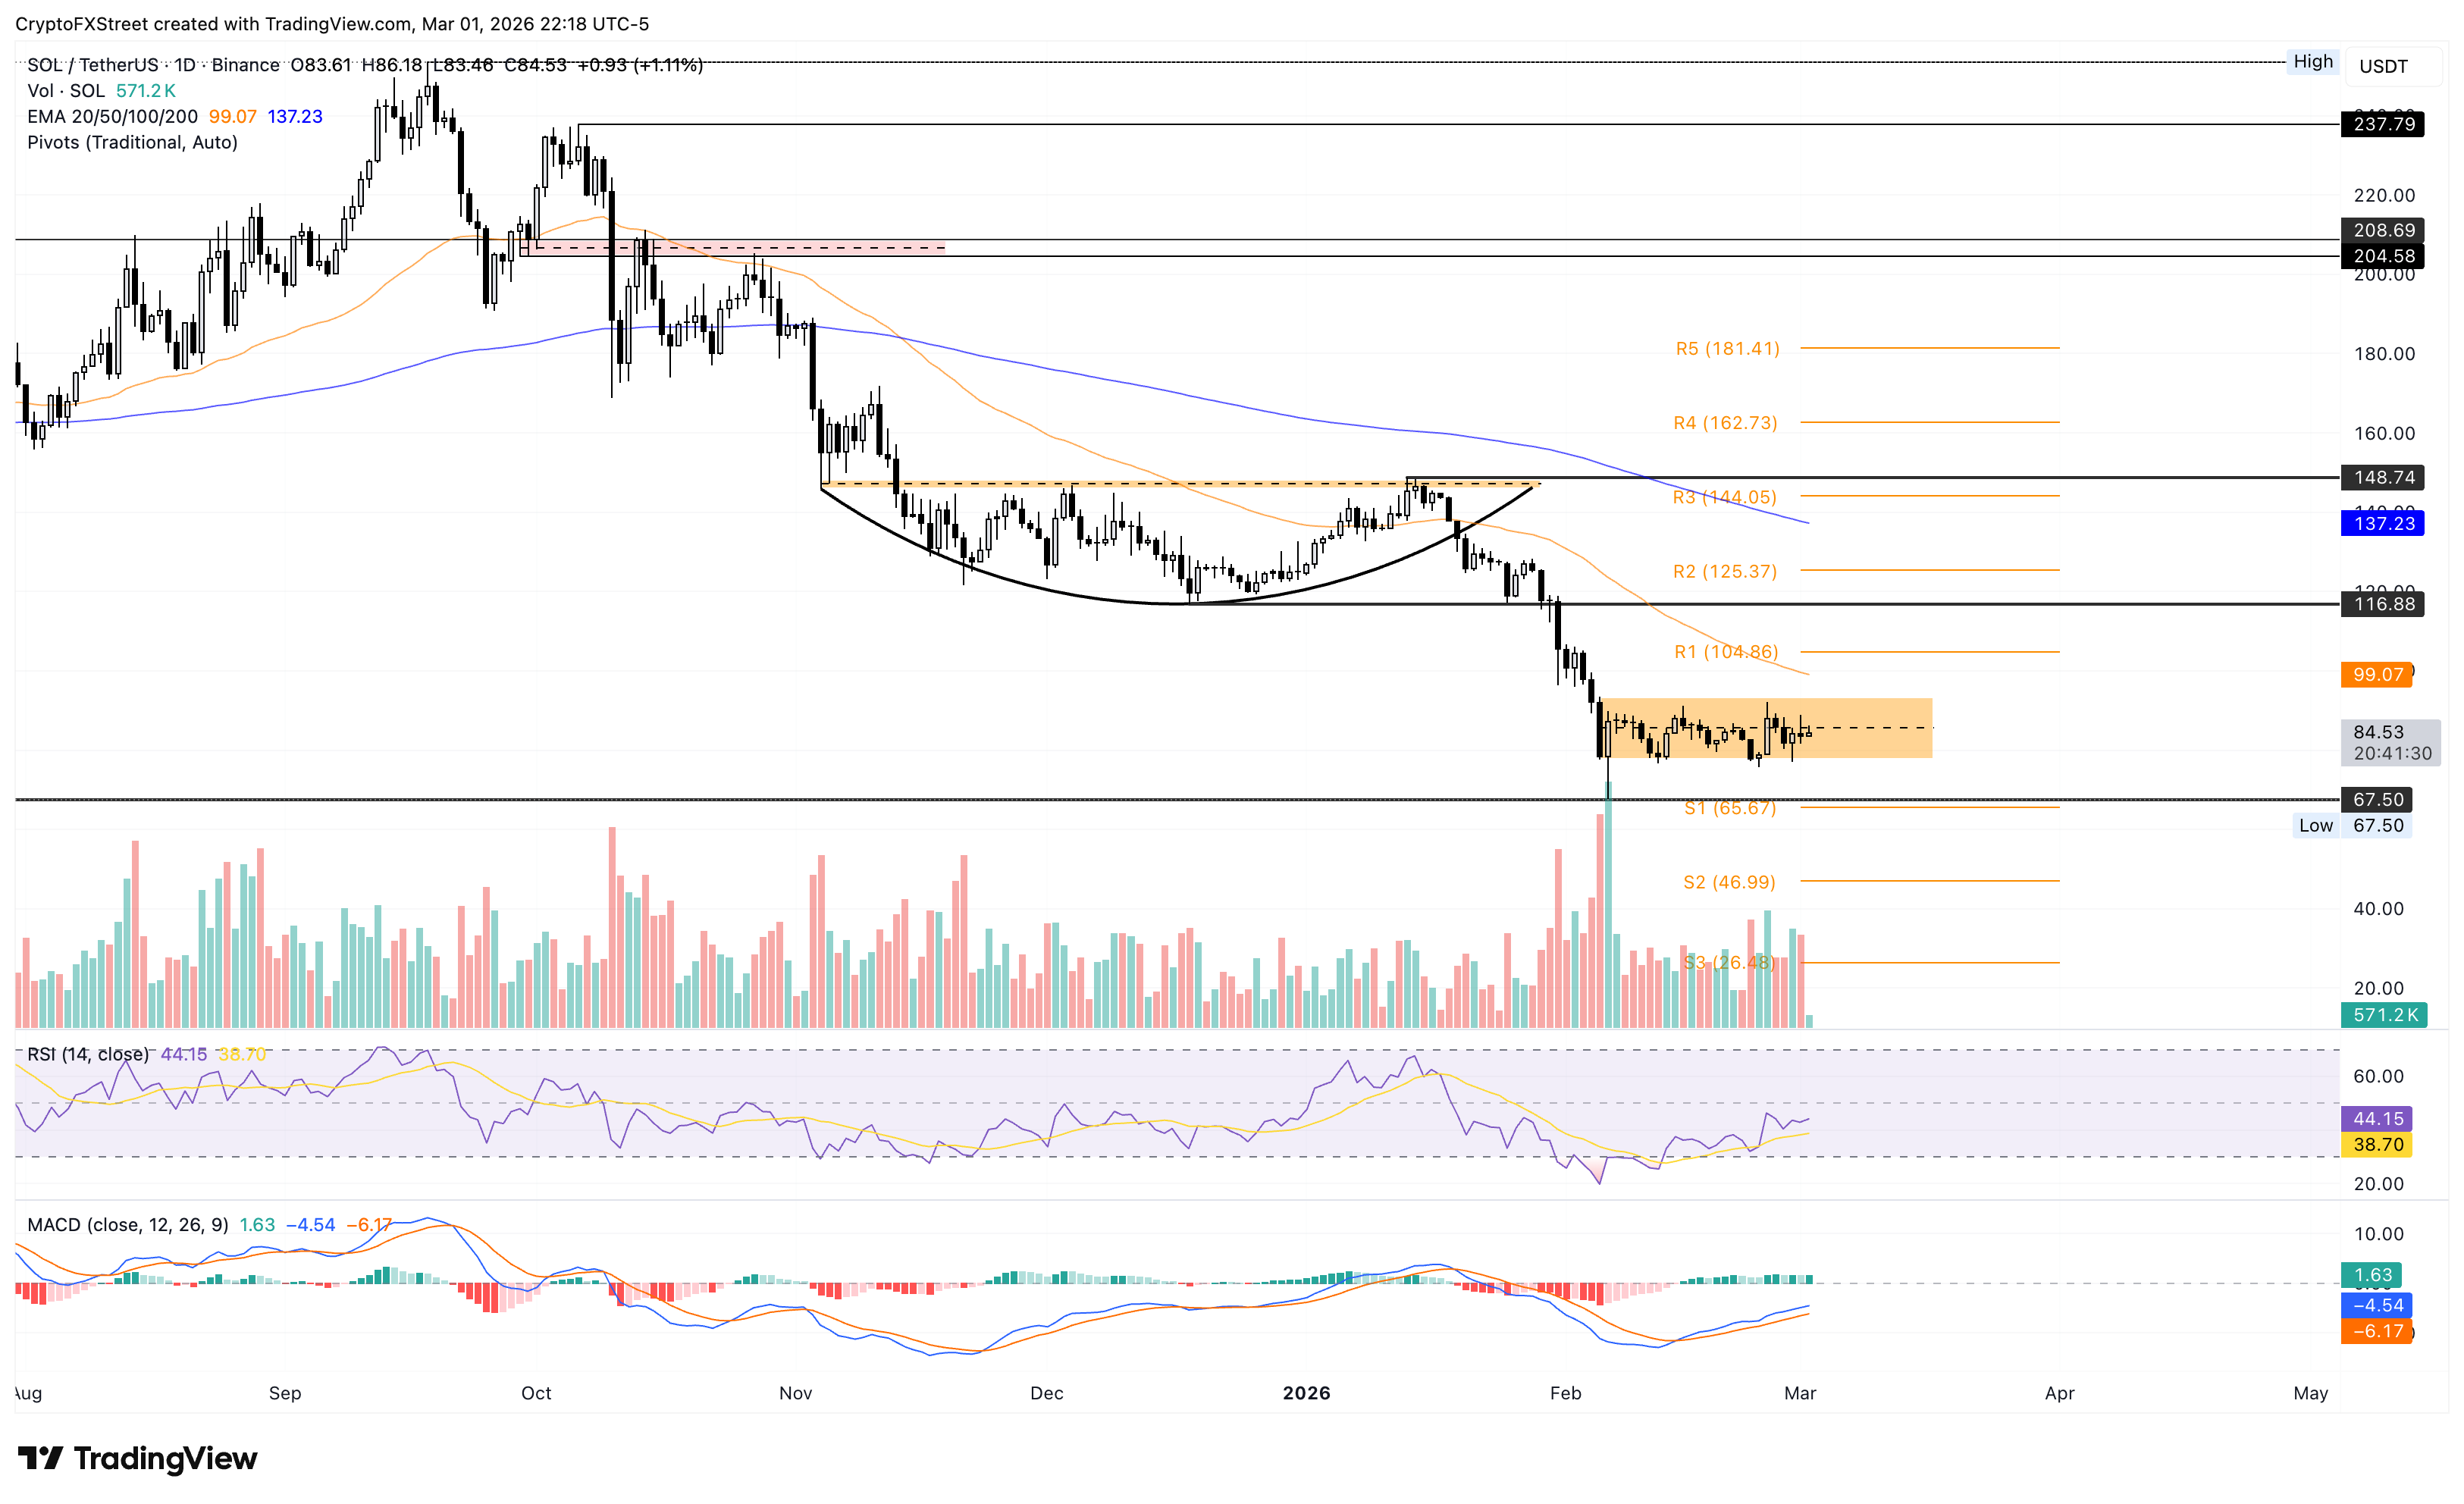
On the upside, SOL should clear $93.43 to test the 50-day EMA near $99.06, where a daily close above it would open the way toward the 200-day EMA around $137 as the next upside barrier.
(The technical analysis of this story was written with the help of an AI tool.)

Oltre un milione di utenti si affida a FXStreet per dati di mercato in tempo reale, strumenti di charting, approfondimenti di esperti e notizie Forex. Il loro calendario economico completo e i webinar formativi aiutano i trader a rimanere informati e a prendere decisioni ponderate. FXStreet conta circa 60 professionisti tra la sede di Barcellona e diverse regioni globali.
Leggi di più


