
Stellar Price Forecast: Correction deepens with bearish signals prevailing
Di Manish Chhetri
Data di Pubblicazione: 5 Feb 2026 | Data di Modifica: 5 Feb 2026


ARTICOLI POPOLARI

Stellar (XLM) price is extending its correction, trading below $0.167 at the time of writing on Thursday after being rejected at a key level. The derivatives data shows signs of weakness, with XLM’s short bets rising amid falling Open Interest (OI).
- Stellar price extends the correction on Thursday after a rejection at the previously broken trendline.
- Derivatives data indicates weakness, as short bets are rising alongside falling open interest.
- The technical outlook suggests bears are still in control, aiming for a deeper correction.
Stellar (XLM) price is extending its correction, trading below $0.167 at the time of writing on Thursday after being rejected at a key level. The derivatives data shows signs of weakness, with XLM’s short bets rising amid falling Open Interest (OI). On the technical side, bears remain in control, aiming for lower lows in XLM.
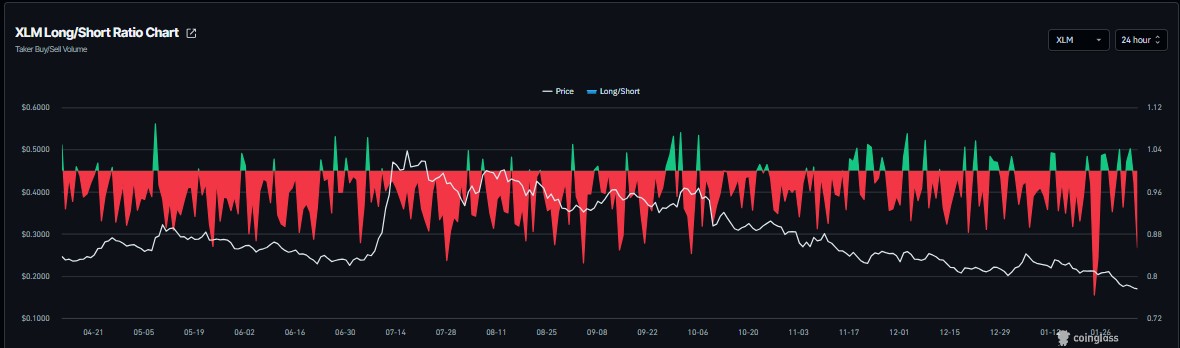
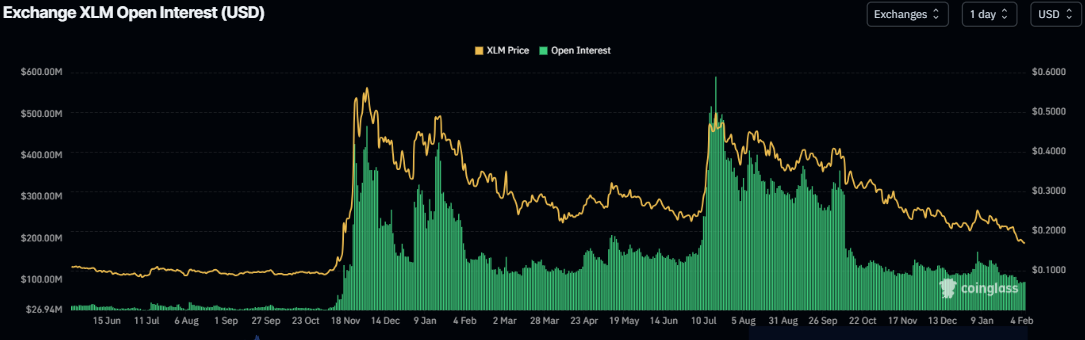
XLM’s derivatives data shows bearish bias
CoinGlass’s XLM long-to-short ratio stands at 0.85 on Thursday, nearing the lowest value in a month. This ratio, below one, reflects bearish sentiment in the markets, as more traders are betting on the asset price to fall.
In addition, Stellar’s futures OI dropped to $95 million on Thursday, the lowest level since November 2024, and has been steadily falling since the start of this year. This drop in OI reflects waning investor participation and projects a bearish outlook.
Stellar Price Forecast: XLM extends correction after closing below key support
Stellar price declined more than 13% last week, closing below the lower trendline of the falling wedge pattern on Saturday. XLM has been rejected around this broken trendline through Wednesday, extending losses to over 5%. As of Thursday, XLM is trading at $0.169.
If XLM continues its correction, it could extend the drop toward the 2025 yearly low of $0.160, set on October 10.
The Relative Strength Index (RSI) reads 26 on the daily chart, an oversold condition, indicating strong bearish momentum. The Moving Average Convergence Divergence (MACD) also showed a bearish crossover in mid-January, which remains intact with rising red histogram bars below the neutral level, further supporting the negative outlook.
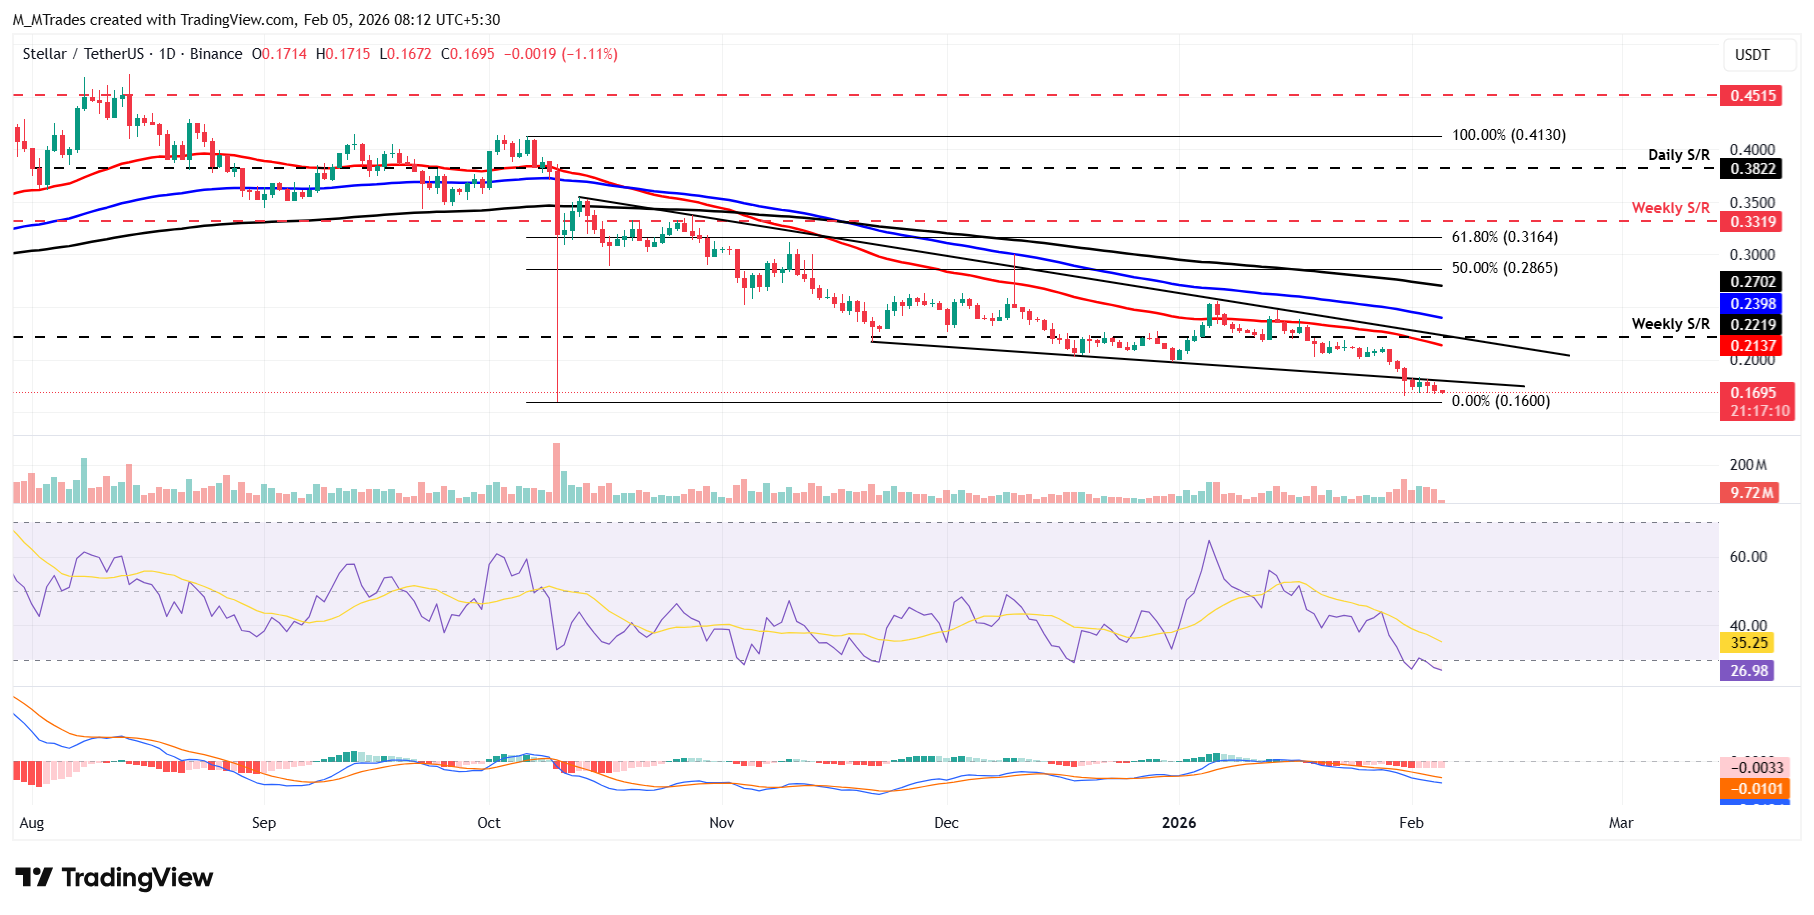
On the other hand, if XLM recovers, it could extend the advance toward the lower trendline boundary at around $0.180.

Oltre un milione di utenti si affida a FXStreet per dati di mercato in tempo reale, strumenti di charting, approfondimenti di esperti e notizie Forex. Il loro calendario economico completo e i webinar formativi aiutano i trader a rimanere informati e a prendere decisioni ponderate. FXStreet conta circa 60 professionisti tra la sede di Barcellona e diverse regioni globali.
Leggi di più


