
Stellar Price Forecast: XLM deepens correction, slipping to 3-month low as risk-off mood persists
Di Manish Chhetri
Data di Pubblicazione: 30 Jan 2026 | Data di Modifica: 30 Jan 2026


ARTICOLI POPOLARI

Stellar (XLM) continues to trade in the red, slipping below $0.20 on Friday, a level not seen since mid-October. Bearish sentiment intensifies amid falling Open Interest (OI) and negative funding rates in the derivatives market.
- Stellar price slips below $0.20 on Friday, reaching the lowest level since October 11.
- The derivatives market supports bearish sentiment, with falling open interest and negative funding rates.
- The technical outlook suggests further correction as momentum continues to weaken.
Stellar (XLM) continues to trade in the red, slipping below $0.20 on Friday, a level not seen since mid-October. Bearish sentiment intensifies amid falling Open Interest (OI) and negative funding rates in the derivatives market. On the technical side, weakening momentum indicators support further correction in XLM.
XLM’s derivatives data shows bearish bias
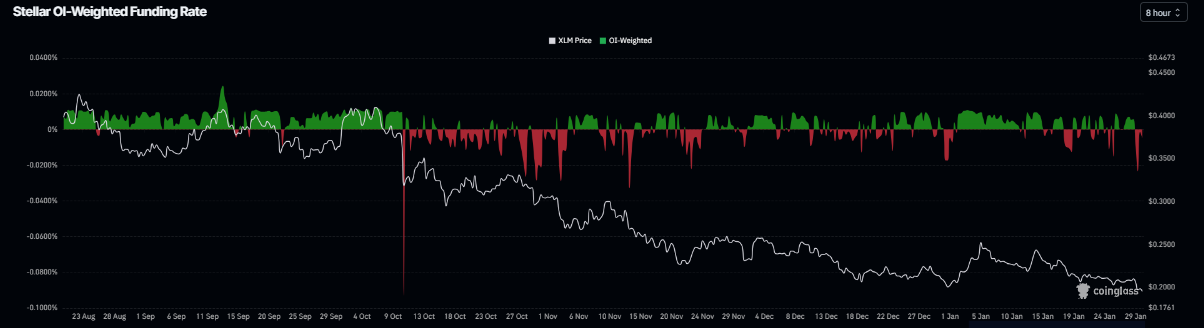
Derivatives data for Stellar support a bearish outlook. CoinGlass’s OI-Weighted Funding Rate data shows that the number of traders betting that the price of XLM will slide further is higher than those anticipating a price increase. The metric turned negative on Thursday and stands at -0.0049% on Friday, indicating that shorts are paying longs and suggesting bearish sentiment toward XLM.
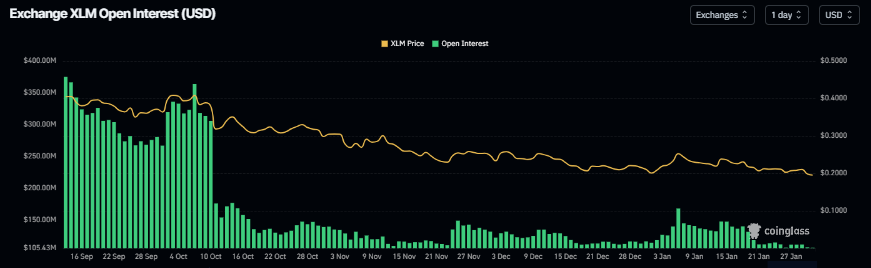
XLM’s futures Open Interest (OI) dropped to $106.50 million on Friday and has been steadily falling since the January 6 high of $166.99 million. This drop in OI reflects waning investor participation and projects a bearish outlook.
Stellar Price Forecast: XLM bears in control
Stellar price closed below the weekly resistance level of $0.22 on January 18 and declined by nearly 9% over the following two weeks. At the time of writing on Friday, XLM is trading at $0.19, reaching a level not seen since October 11.
If XLM continues its correction, it could extend the drop toward the yearly low of $0.16, set on October 10.
The Relative Strength Index (RSI) on the daily chart is at 35, below the neutral 50 level, indicating bearish momentum is gaining traction. Moreover, the Moving Average Convergence Divergence (MACD) indicator showed a bearish crossover on January 18, which remains intact with rising red histogram bars below the neutral level, further supporting the negative outlook.
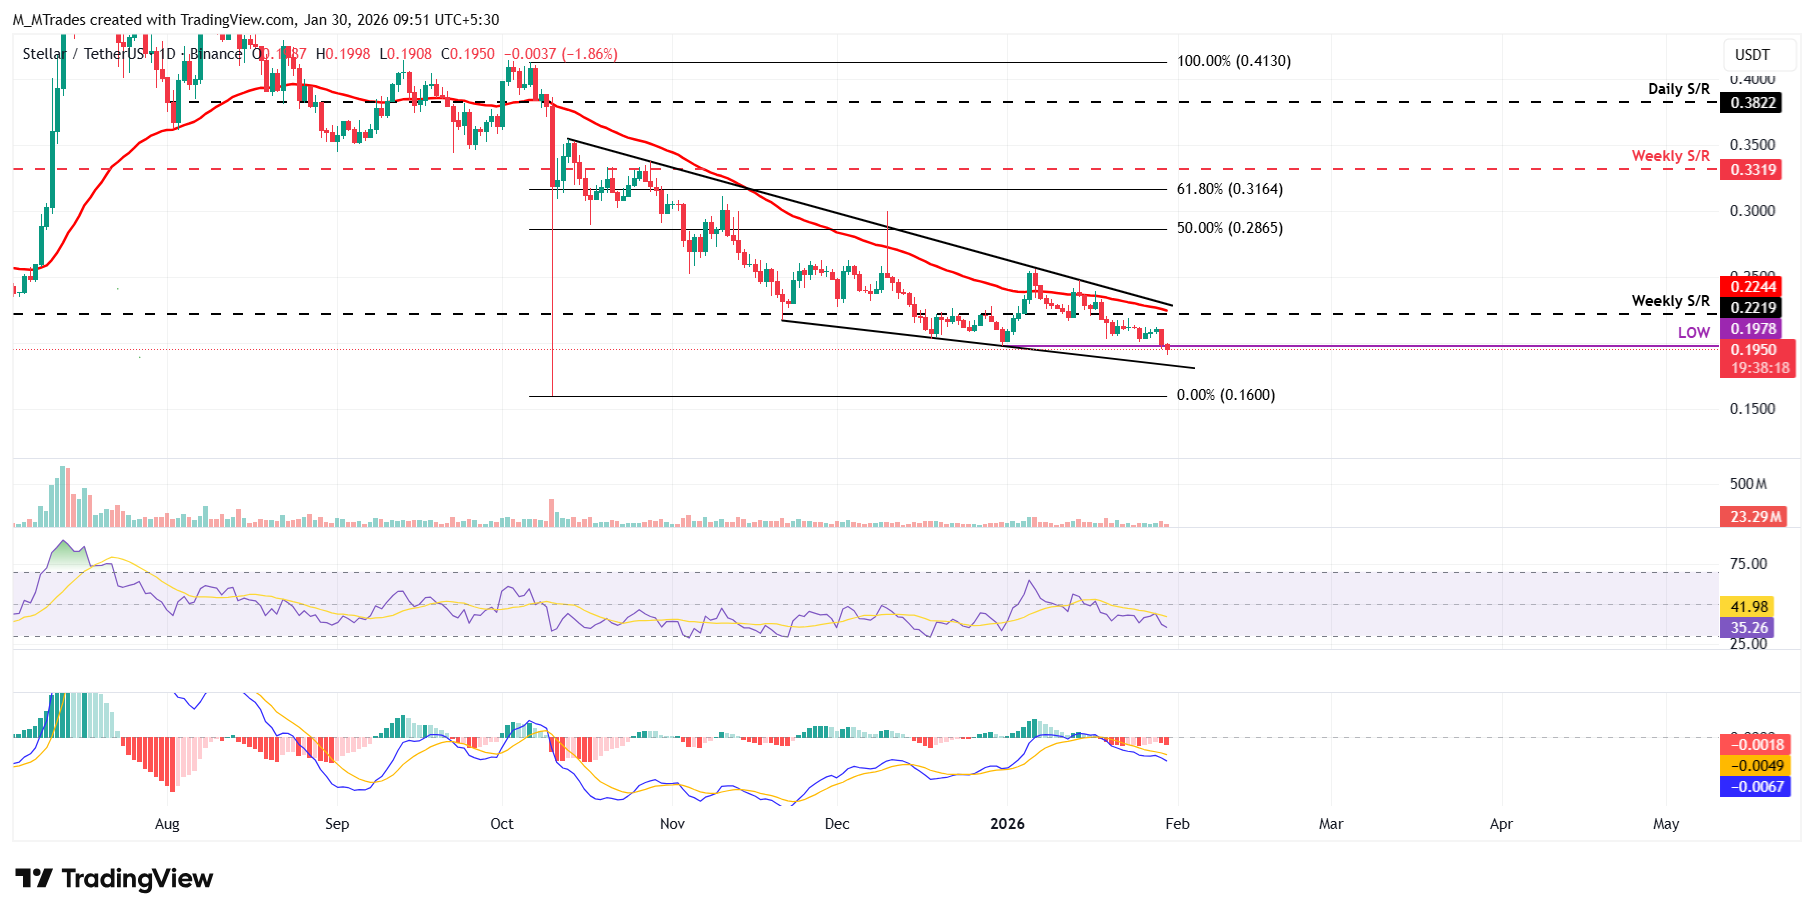
On the other hand, if XLM recovers, it could extend the advance toward the weekly resistance at $0.22.

Oltre un milione di utenti si affida a FXStreet per dati di mercato in tempo reale, strumenti di charting, approfondimenti di esperti e notizie Forex. Il loro calendario economico completo e i webinar formativi aiutano i trader a rimanere informati e a prendere decisioni ponderate. FXStreet conta circa 60 professionisti tra la sede di Barcellona e diverse regioni globali.
Leggi di più


