
Top 3 Price Prediction: Bitcoin, Ethereum, Ripple – BTC breakdown hints at deeper correction as ETH and XRP extend losses
Di Manish Chhetri
Data di Pubblicazione: 23 Feb 2026 | Data di Modifica: 23 Feb 2026


ARTICOLI POPOLARI

Bitcoin (BTC), Ethereum (ETH) and Ripple (XRP) prices are extending losses on Monday after falling slightly the previous week. BTC is slipping below the lower consolidation range at $65,000, and ETH is falling below $1,900, both extending their six-week losing streaks.
- Bitcoin price is breaking below the lower consolidation range on Monday, a firm close suggests a deeper correction.
- Ethereum slips below $1,900, extending its six-week losing streak.
- XRP slides below $1.40, failing to find support at the lower trendline boundary.
Bitcoin (BTC), Ethereum (ETH) and Ripple (XRP) prices are extending losses on Monday after falling slightly the previous week. BTC is slipping below the lower consolidation range at $65,000, and ETH is falling below $1,900, both extending their six-week losing streaks. Meanwhile, XRP slides below $1.40 and unable to find support at the lower trendline; all top three cryptocurrencies are hinting at a deeper correction.
Bitcoin is breaking below the lower consolidation boundary
Bitcoin price has been consolidating within a range between $65,729 and $71,746 since February 7. As of Monday, BTC is slipping below the lower consolidation range and trading at $64,700.
If BTC closes below the lower consolidation level at $65,729 on a daily basis, it could extend the decline toward the key support level at $60,000.
The Relative Strength Index (RSI) on the daily chart reads 31, nearing the oversold conditions, indicating strong bearish momentum. The Moving Average Convergence Divergence (MACD) lines are converging, indicating indecisiveness among traders.
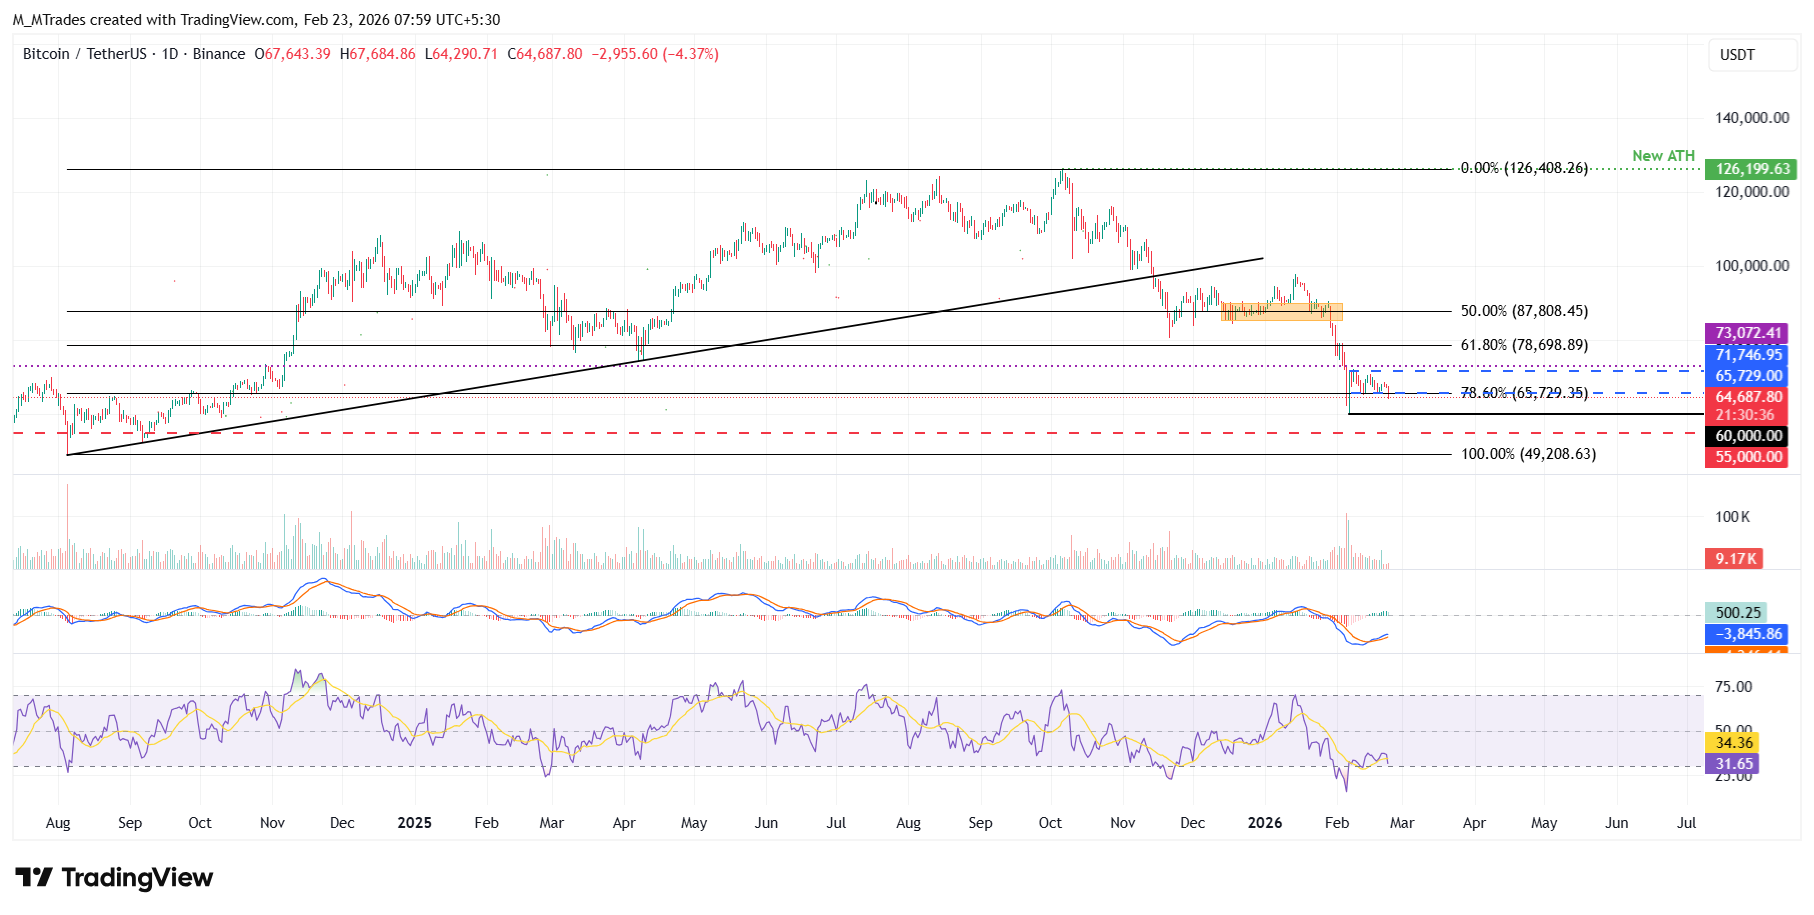
On the other hand, if BTC continues to find support around the lower consolidation range at $65,729, it could extend the advance toward the upper consolidation range at $71,746.
Ethereum extends correction
Ethereum price corrected slightly during the previous week, extending the loss since mid-January. As of Monday, ETH is trading down by 4.77% at $1,864.
If ETH closes below the lower consolidation range at $1,747 on a daily basis, it could extend the decline toward the daily support at $1,669.
Like Bitcoin, Ethereum’s RSI shows bearish momentum gaining traction, while the MACD lines are converging, indicating indecision among traders.
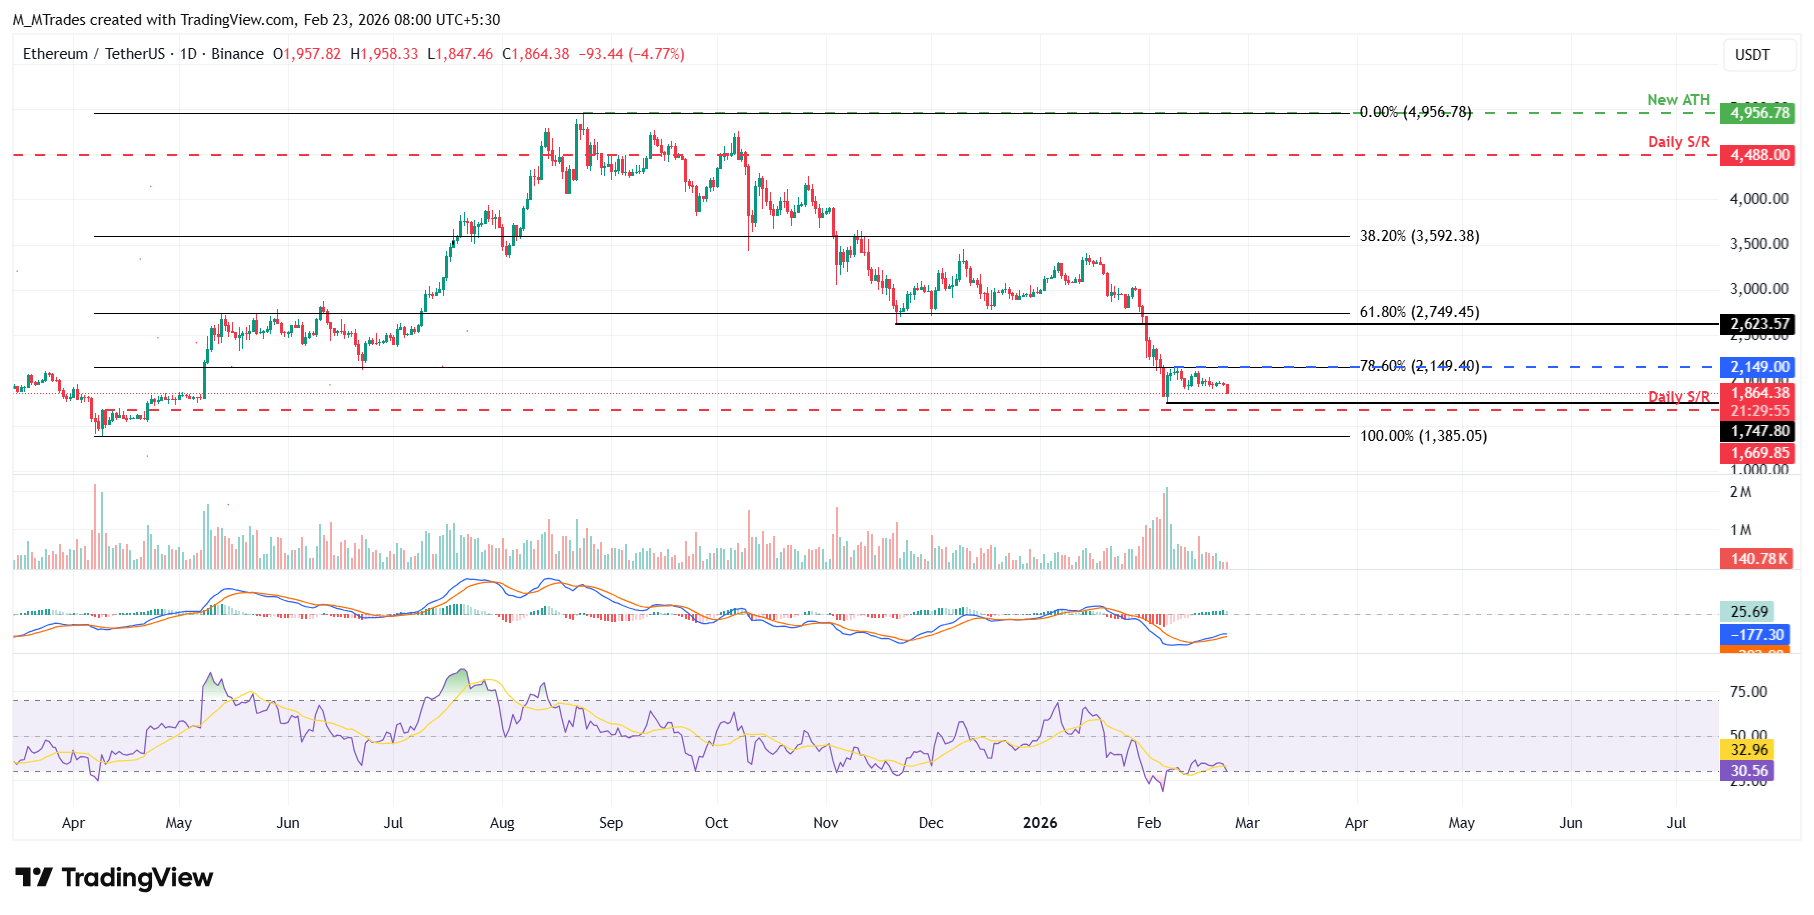
However, if ETH recovers, it could extend the advance toward the upper consolidation range at $2,149.
XRP extends correction as the lower trendline boundary fails to hold
XRP price is trading below $1.40 on Monday, failing to find support at the lower trendline boundary of a falling wedge.
If XRP continues its correction, it could extend the decline toward the weekly support at $1.30.
Like Bitcoin and Ethereum, XRP’s RSI shows bearish momentum gaining traction, while the MACD lines are converging, indicating indecision among traders.
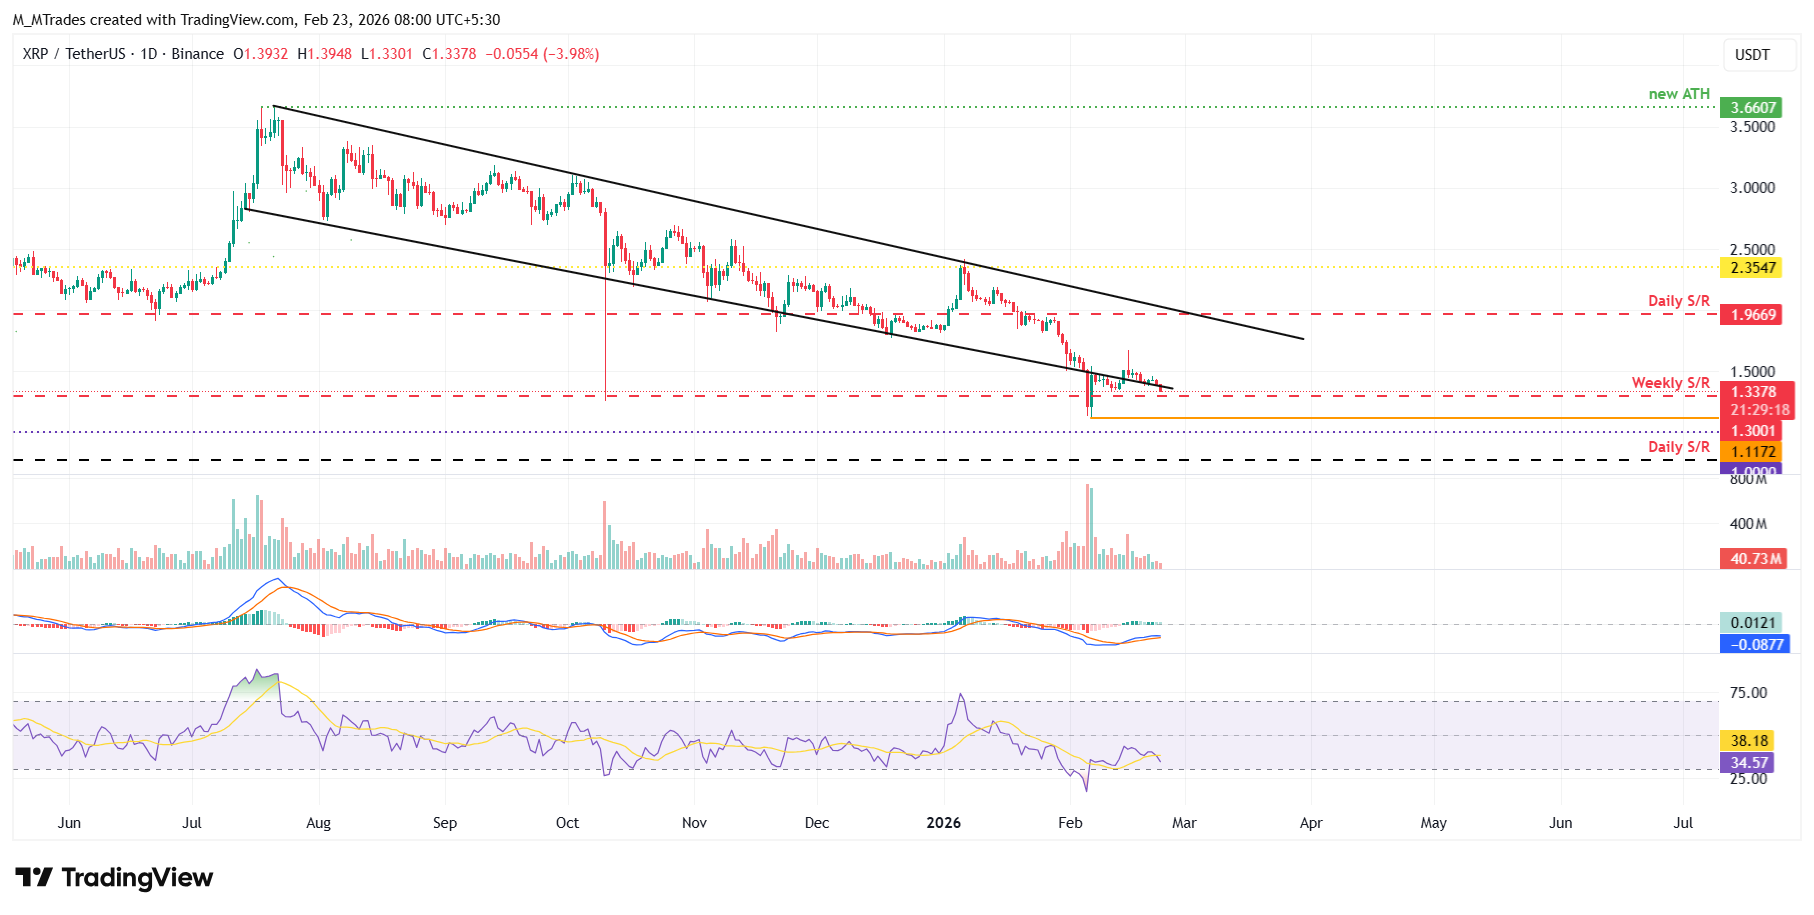
Conversely, if the lower trendline boundary holds as support, it could extend the recovery toward the key psychological level at $1.50.
Cryptocurrency metrics FAQs
The developer or creator of each cryptocurrency decides on the total number of tokens that can be minted or issued. Only a certain number of these assets can be minted by mining, staking or other mechanisms. This is defined by the algorithm of the underlying blockchain technology. On the other hand, circulating supply can also be decreased via actions such as burning tokens, or mistakenly sending assets to addresses of other incompatible blockchains.
Market capitalization is the result of multiplying the circulating supply of a certain asset by the asset’s current market value.
Trading volume refers to the total number of tokens for a specific asset that has been transacted or exchanged between buyers and sellers within set trading hours, for example, 24 hours. It is used to gauge market sentiment, this metric combines all volumes on centralized exchanges and decentralized exchanges. Increasing trading volume often denotes the demand for a certain asset as more people are buying and selling the cryptocurrency.
Funding rates are a concept designed to encourage traders to take positions and ensure perpetual contract prices match spot markets. It defines a mechanism by exchanges to ensure that future prices and index prices periodic payments regularly converge. When the funding rate is positive, the price of the perpetual contract is higher than the mark price. This means traders who are bullish and have opened long positions pay traders who are in short positions. On the other hand, a negative funding rate means perpetual prices are below the mark price, and hence traders with short positions pay traders who have opened long positions.

Oltre un milione di utenti si affida a FXStreet per dati di mercato in tempo reale, strumenti di charting, approfondimenti di esperti e notizie Forex. Il loro calendario economico completo e i webinar formativi aiutano i trader a rimanere informati e a prendere decisioni ponderate. FXStreet conta circa 60 professionisti tra la sede di Barcellona e diverse regioni globali.
Leggi di più


