
Top 3 Price Prediction: Bitcoin, Ethereum, Ripple – BTC, ETH and XRP sink to multi-month lows
Di Manish Chhetri
Data di Pubblicazione: 6 Feb 2026 | Data di Modifica: 6 Feb 2026


ARTICOLI POPOLARI

Bitcoin (BTC), Ethereum (ETH) and Ripple (XRP) slip to multi-month lows, erasing all gains since crypto-friendly candidate Donald Trump won the US presidential election in November 2024. BTC hits a low of $60,000 on Friday, while ETH nosedives to $1,750 and XRP to $1.11.
- Bitcoin price rebounds slightly after retesting the $60,000 mark on Friday, following a 15% correction so far this week.
- Ethereum slips below $1,750 on Friday, trading at levels not seen since May 6, 2025.
- XRP drops to around $1.11, its lowest level since November 2024.
Bitcoin (BTC), Ethereum (ETH) and Ripple (XRP) slip to multi-month lows, erasing all gains since crypto-friendly candidate Donald Trump won the US presidential election in November 2024. BTC hits a low of $60,000 on Friday, while ETH nosedives to $1,750 and XRP to $1.11. The top three cryptocurrencies have undergone double-digit corrections, with no signs of a near-term rebound.
Bitcoin corrects to $60,000
Bitcoin's price has crashed by more than 15% so far this week, after correcting by 11% the previous week. As of writing on Friday, BTC has reached a low of $60,000, a level last seen in mid-October 2024.
If BTC continues its correction, it could extend the decline toward the weekly support at $54,800.
The Relative Strength Index (RSI) reads 20 on the daily chart, an oversold condition, indicating strong bearish momentum. Additionally, the Moving Average Convergence Divergence (MACD) indicator showed a bearish crossover on January 20, which remains intact with rising red histogram bars below the neutral level, further supporting the negative outlook.
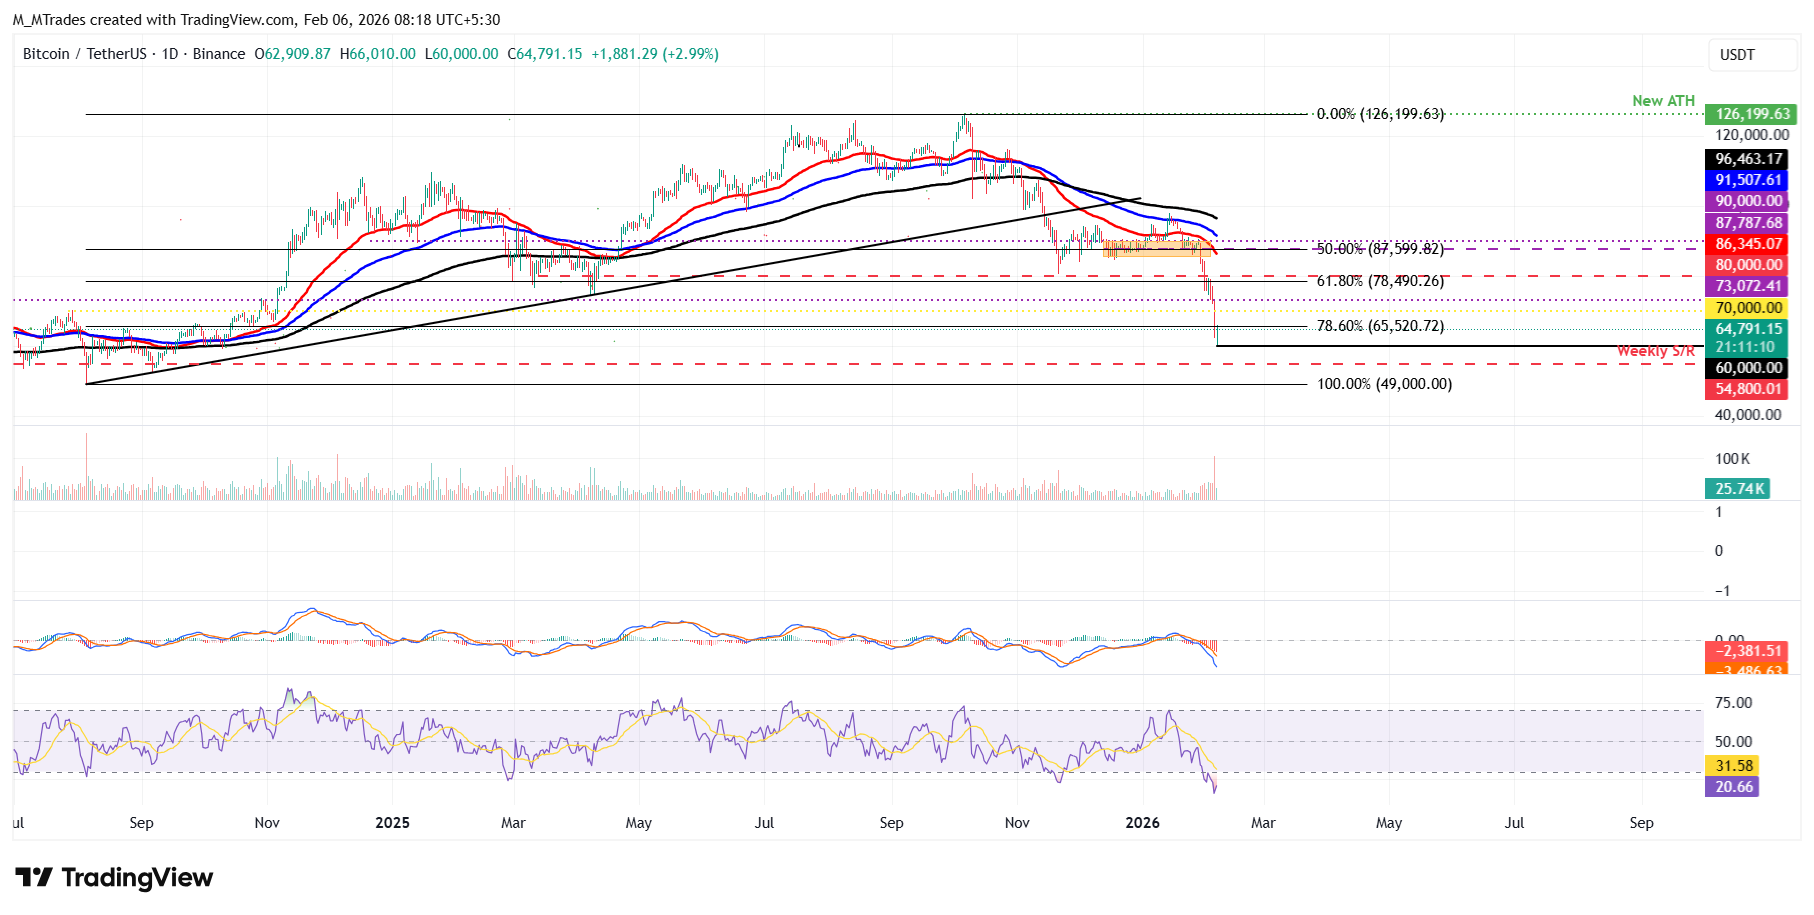
However, after such a massive correction, the chances of price consolidation remain high rather than a sharp recovery. If BTC consolidates, it could do so between $60,000 and $70,000.
Ethereum is trading at levels not seen since May 6, 2025
Ethereum price has corrected by over 15% so far this week, reaching a low of $1,747 on Friday, levels not seen since May 6, 2025.
If ETH continues its free fall, it could extend the decline to the immediate daily support at $1,669.
Like Bitcoin, Ethereum RSI and MACD indicators on the daily chart are showing strong bearish strength.
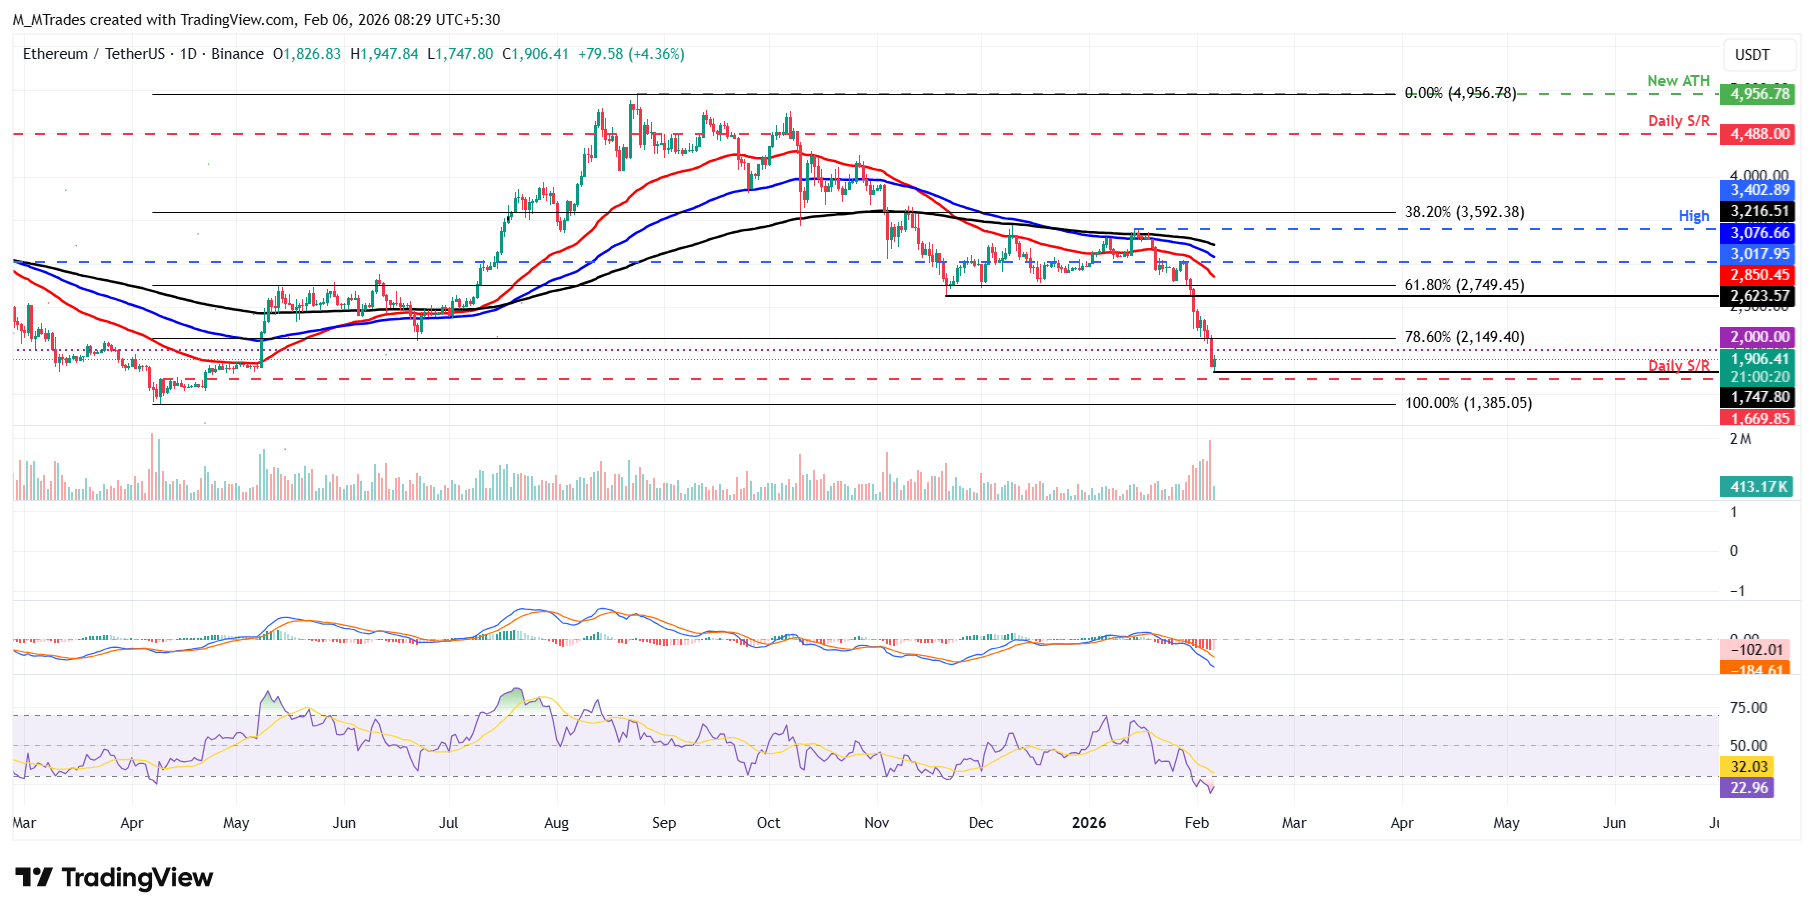
On the other hand, after such a massive correction, the chances of price consolidation remain high rather than a sharp recovery. If ETH consolidates, it could do so between $1,700 and $2,100.
XRP corrects over 20% as sell-off intensifies
XRP price corrected over 20% so far this week, reaching a low of $1.11 on Friday, a level not seen since early November 2024.
If XRP continues its downward trend, it could extend the fall toward the key psychological level of $1.
Like Bitcoin and Ethereum, XRP’s momentum indicators (RSI and MACD) are also projecting a bearish outlook.
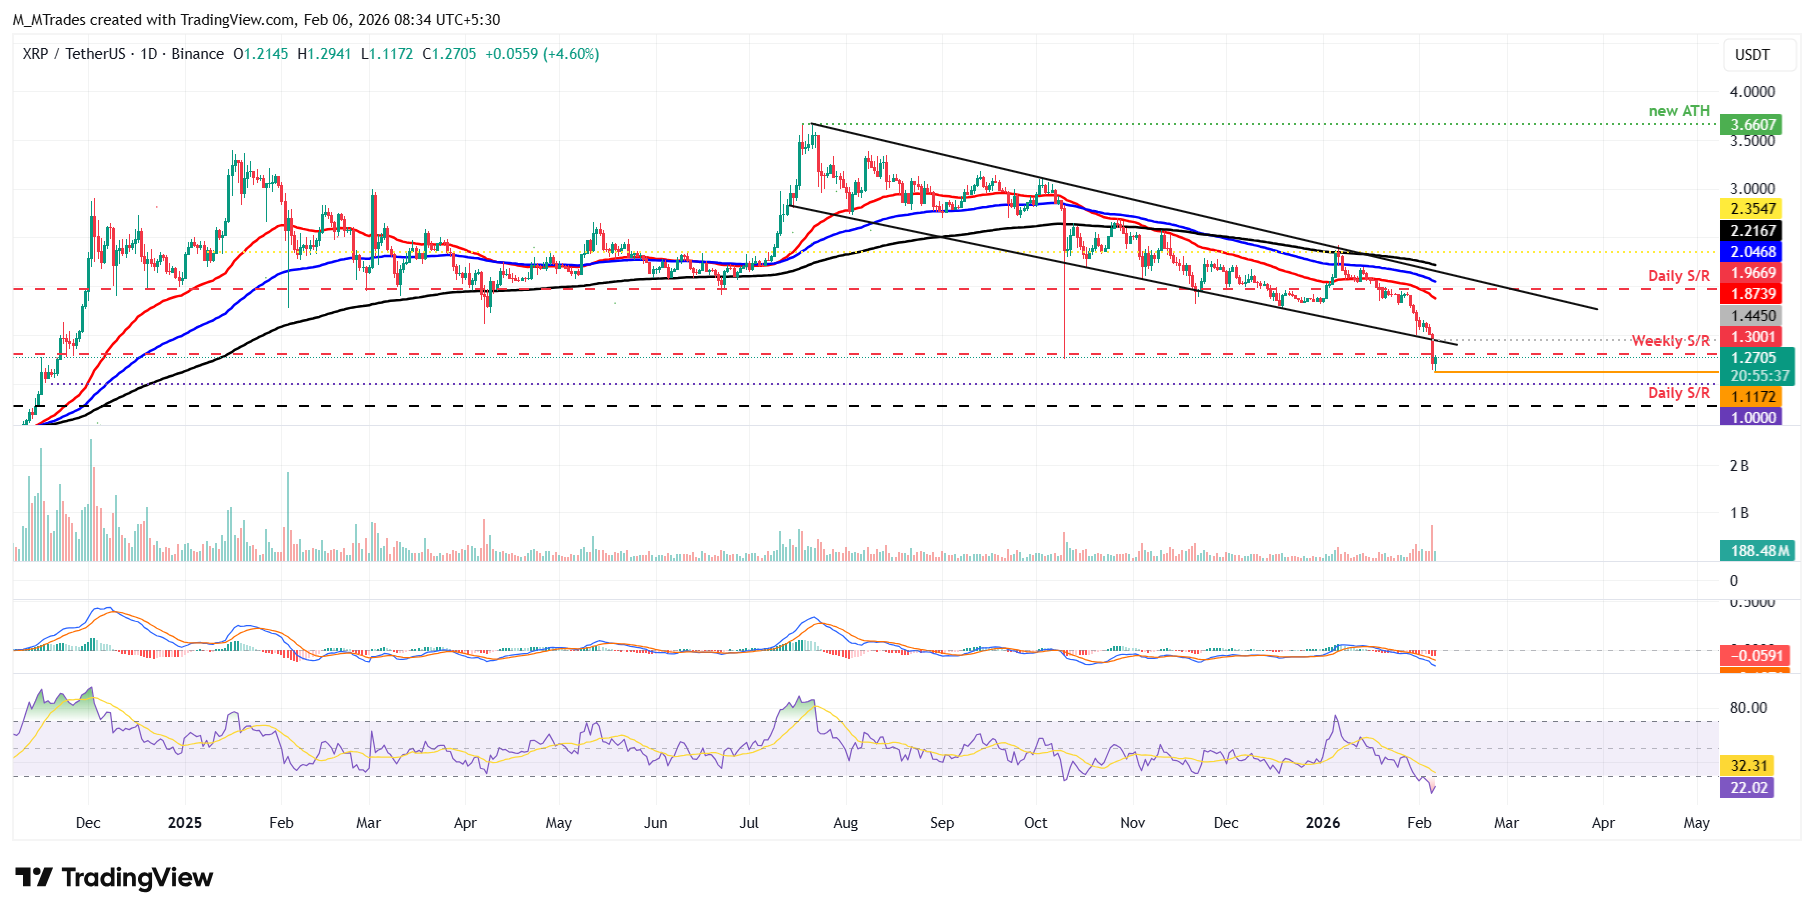
Following the sharp correction, the probability of price consolidation appears higher than that of a strong rebound. If XRP enters a consolidation phase, it is likely to trade between $1.11 and $1.45 in the near term.
Cryptocurrency metrics FAQs
The developer or creator of each cryptocurrency decides on the total number of tokens that can be minted or issued. Only a certain number of these assets can be minted by mining, staking or other mechanisms. This is defined by the algorithm of the underlying blockchain technology. On the other hand, circulating supply can also be decreased via actions such as burning tokens, or mistakenly sending assets to addresses of other incompatible blockchains.
Market capitalization is the result of multiplying the circulating supply of a certain asset by the asset’s current market value.
Trading volume refers to the total number of tokens for a specific asset that has been transacted or exchanged between buyers and sellers within set trading hours, for example, 24 hours. It is used to gauge market sentiment, this metric combines all volumes on centralized exchanges and decentralized exchanges. Increasing trading volume often denotes the demand for a certain asset as more people are buying and selling the cryptocurrency.
Funding rates are a concept designed to encourage traders to take positions and ensure perpetual contract prices match spot markets. It defines a mechanism by exchanges to ensure that future prices and index prices periodic payments regularly converge. When the funding rate is positive, the price of the perpetual contract is higher than the mark price. This means traders who are bullish and have opened long positions pay traders who are in short positions. On the other hand, a negative funding rate means perpetual prices are below the mark price, and hence traders with short positions pay traders who have opened long positions.

Oltre un milione di utenti si affida a FXStreet per dati di mercato in tempo reale, strumenti di charting, approfondimenti di esperti e notizie Forex. Il loro calendario economico completo e i webinar formativi aiutano i trader a rimanere informati e a prendere decisioni ponderate. FXStreet conta circa 60 professionisti tra la sede di Barcellona e diverse regioni globali.
Leggi di più


