
Top 3 Price Prediction: Bitcoin, Ethereum, Ripple – BTC, ETH hesitate at resistance, while XRP takes the lead
Di Manish Chhetri
Aggiornato: 17 Apr 2026


ARTICOLI POPOLARI

Bitcoin (BTC), Ethereum (ETH) and Ripple (XRP) rose by over 5%, 6% and 7%, respectively, so far this week as risk sentiment improved amid hopes of a US-Iran extension of the 2-week truce and a ceasefire between Israel and Lebanon.
- Bitcoin faces resistance at the 100-day EMA around $75,260 after gaining over 5% so far this week.
- Ethereum approaches key resistance near $2,355, breakout or breakdown dictates the next move.
- XRP closes above the 50-day EMA at $1.40, if it holds, could suggest further gains.
Bitcoin (BTC), Ethereum (ETH) and Ripple (XRP) rose by over 5%, 6% and 7%, respectively, so far this week as risk sentiment improved amid hopes of a US-Iran extension of the 2-week truce and a ceasefire between Israel and Lebanon. BTC and ETH are near their key resistance levels, around $75,260 and $2,355, on Friday, while XRP has already broken above its critical resistance. The next move will likely hinge on whether BTC and ETH confirm a breakout, with XRP poised to extend gains if its momentum holds.
Bitcoin stalls key resistance at $75,257
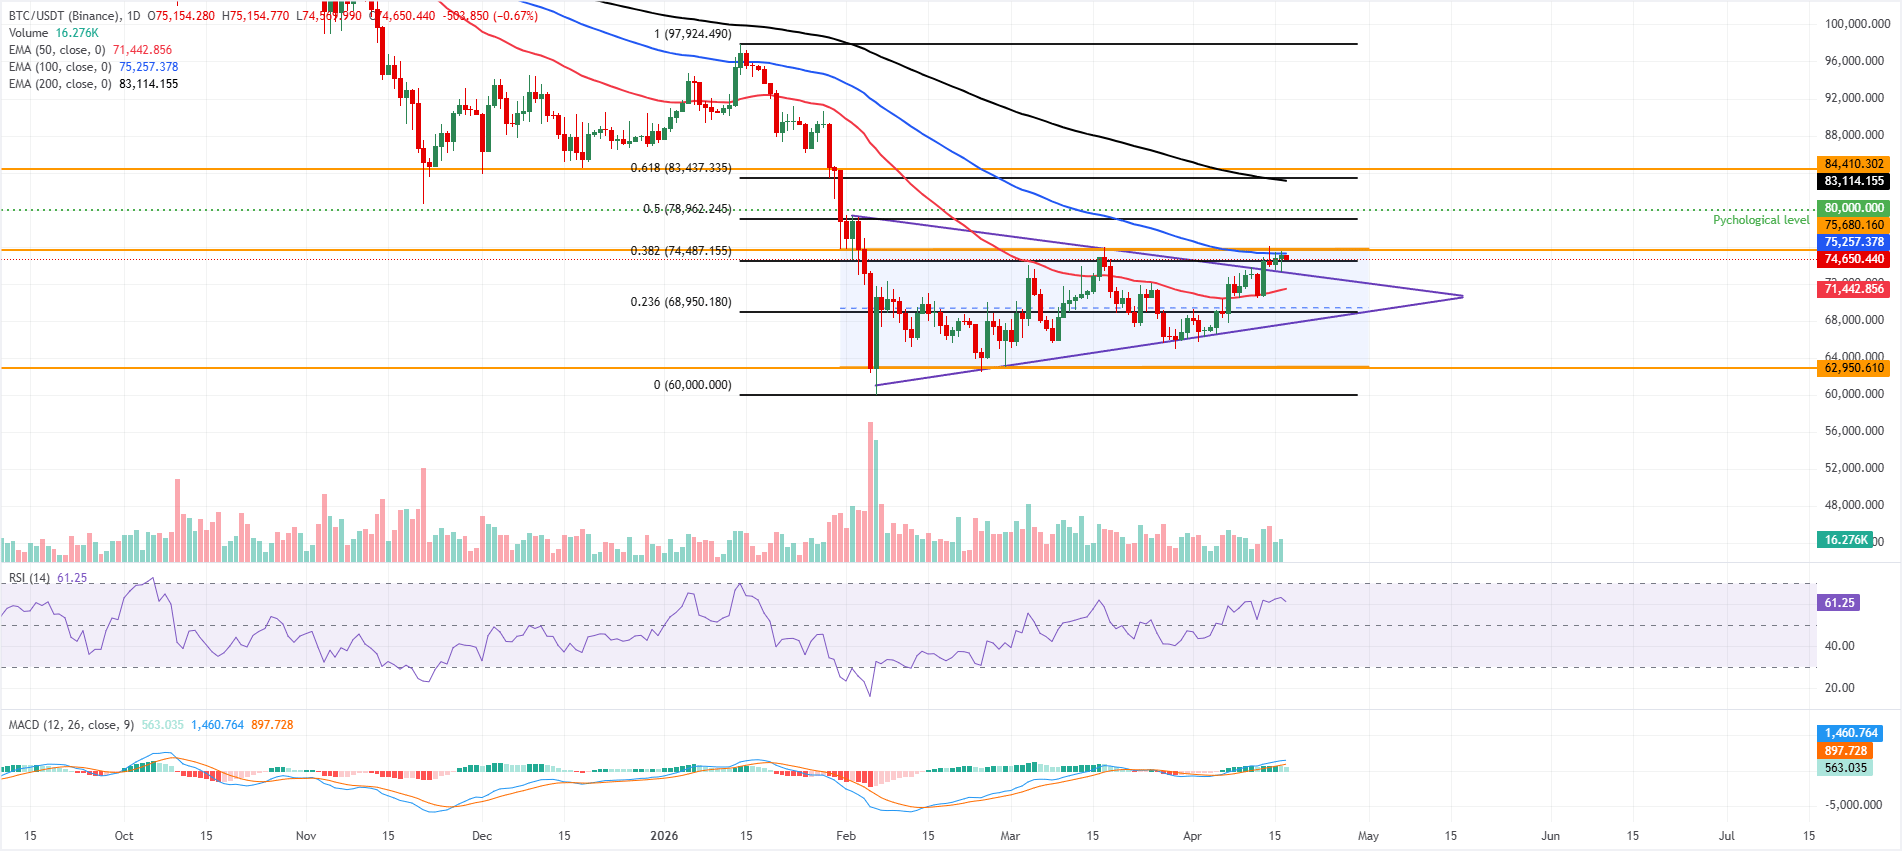
Bitcoin is trading slightly down around $74,650 on Friday, facing rejection around the 100-day Exponential Moving Average (EMA) at $75,257. Earlier this week, BTC retested and found support around the previously broken upper boundary of an ascending triangle pattern (drawn by connecting highs and lows with two trendlines since early February) near $73,400, hinting at a textbook breakout and retest scenario.
The Relative Strength Index (RSI) on the daily chart hovers near 61, and the Moving Average Convergence Divergence (MACD) histogram remains positive, which together suggest firm bullish momentum as long as BTC holds above the breakout point near $73,400.
On the downside, initial support is seen at the 50-day EMA at $71,412. A deeper pullback would expose the 23.6% Fibonacci retracement at $68,950 (drawn from the January 14 high to the February 6 low), the rising trendline support (triangle pattern) near $67,412, and ultimately the more distant horizontal floor around $62,950.
On the topside, a sustained close above the 100-day EMA around $75,257 and the nearby $75,680 horizontal resistance would open the door toward the 50% retracement at $78,962 and the psychological $80,000 mark.
Ethereum near key resistance zone
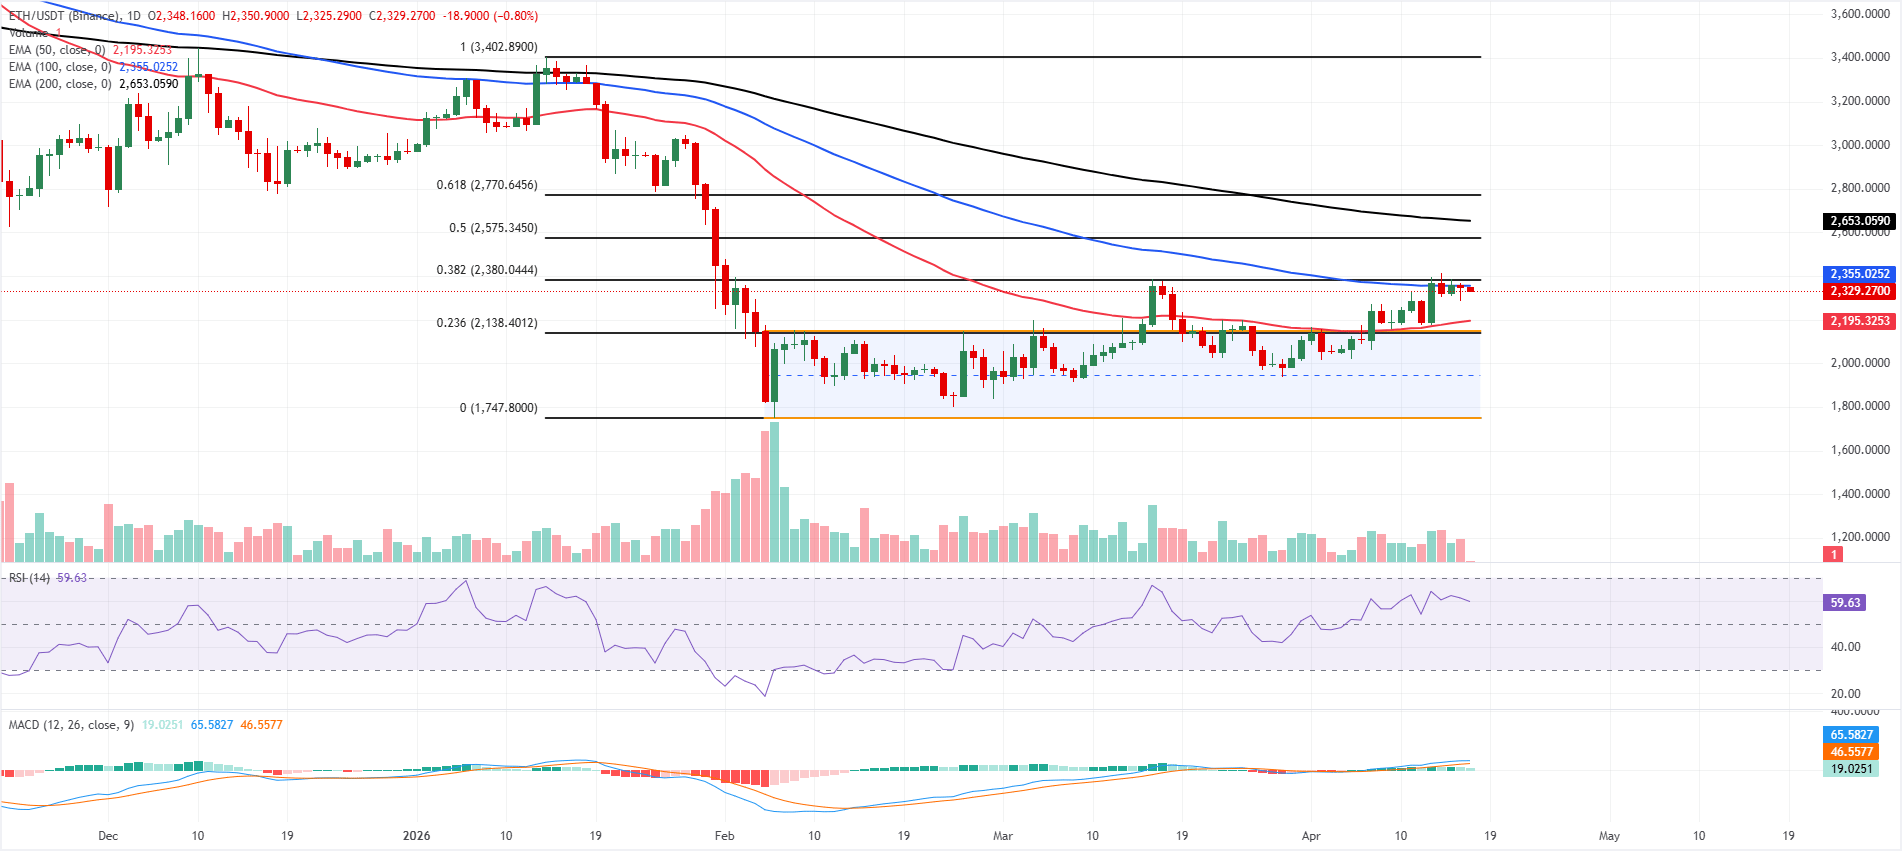
Ethereum price steadies near the 100-day EMA at $2,355, which closely aligns with the 38.2% Fibonacci retracment level at $2,380 on Friday, after gaining over 6% so far this week. ETH holds above the 50-day EMA at $2,195, hinting at a tentative positive bias, but remains capped beneath the 100-day and 200-day EMAs, which keep the broader trend under pressure.
The RSI on the daily chart has eased to about 59, showing fading upside momentum after recent gains, while the MACD has turned lower but stays in positive territory, suggesting that bullish pressure is waning rather than reversing outright.
On the topside, immediate resistance is seen at the 38.2% Fibonacci retracement of the broader downswing around $2,380, followed by the 100-day EMA at $2,355; a sustained break above these levels would open the door toward the 200-day EMA near $2,653.
On the downside, initial support lies at the former channel ceiling around $2,148, reinforced by the 23.6% Fibonacci retracement at $2,138 and the 50-day EMA at $2,195, with the channel floor near $1,747 providing a major structural base if selling accelerates.
XRP closes above 50-day EMA
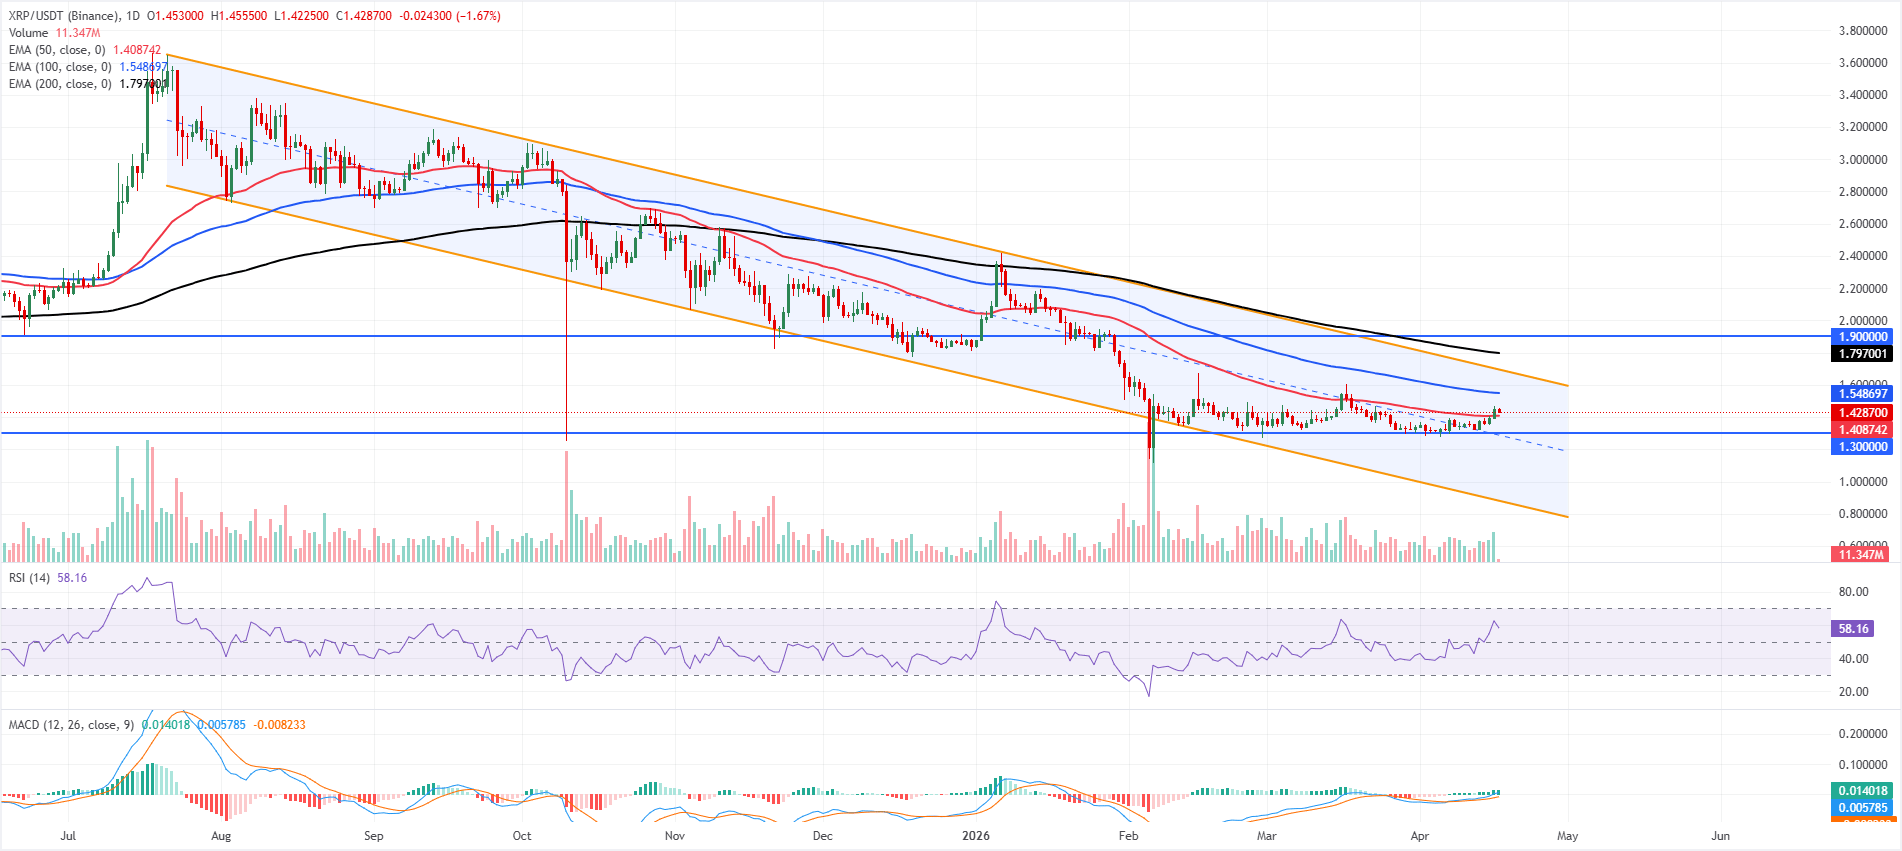
XRP price is trading slightly down at around $1.42 on Friday, after surging over 7%. XRP holds above the 50-day EMA at $1.40, hinting at a mildly constructive near-term tone, but remains well capped beneath the 100-day EMA at $1.54 and the broader downward parallel channel ceiling near $1.69, which preserves the medium-term bearish structure.
XRP’s momentum is supportive rather than aggressive, with the RSI on the daily chart hovering around 58 and the MACD line in positive territory, suggesting buyers retain an advantage while still operating inside a larger corrective channel.
On the downside, initial support is seen at the 50-day EMA around $1.40, ahead of the horizontal floor at $1.30; a deeper slide toward the channel bottom near $0.88 would only be expected if these levels give way.
On the topside, a sustained break above the 100-day EMA at $1.54 would be needed to expose the upper boundary of the descending channel at $1.69, with the 200-day EMA around $1.79 and the horizontal resistance at $1.90 acting as subsequent caps within the prevailing broader downtrend.
(The technical analysis of this story was written with the help of an AI tool.)
Cryptocurrency prices FAQs
Token launches influence demand and adoption among market participants. Listings on crypto exchanges deepen the liquidity for an asset and add new participants to an asset’s network. This is typically bullish for a digital asset.
A hack is an event in which an attacker captures a large volume of the asset from a DeFi bridge or hot wallet of an exchange or any other crypto platform via exploits, bugs or other methods. The exploiter then transfers these tokens out of the exchange platforms to ultimately sell or swap the assets for other cryptocurrencies or stablecoins. Such events often involve an en masse panic triggering a sell-off in the affected assets.
Macroeconomic events like the US Federal Reserve’s decision on interest rates influence crypto assets mainly through the direct impact they have on the US Dollar. An increase in interest rate typically negatively influences Bitcoin and altcoin prices, and vice versa. If the US Dollar index declines, risk assets and associated leverage for trading gets cheaper, in turn driving crypto prices higher.
Halvings are typically considered bullish events as they slash the block reward in half for miners, constricting the supply of the asset. At consistent demand if the supply reduces, the asset’s price climbs.

Oltre un milione di utenti si affida a FXStreet per dati di mercato in tempo reale, strumenti di charting, approfondimenti di esperti e notizie Forex. Il loro calendario economico completo e i webinar formativi aiutano i trader a rimanere informati e a prendere decisioni ponderate. FXStreet conta circa 60 professionisti tra la sede di Barcellona e diverse regioni globali.
Leggi di più


