
Top Crypto Gainers: River faces resistance, Humanity Protocol steadies, Polygon rebounds
Di Vishal Dixit
Data di Pubblicazione: 13 Feb 2026 | Data di Modifica: 13 Feb 2026


ARTICOLI POPOLARI

Altcoins, including River (RIVER), Humanity Protocol (H) and Polygon (POL), rank as top-performing cryptocurrencies in the last 24 hours, defying the broader market pullback as Bitcoin (BTC) dropped below $67,000.
- River approaches a key resistance level on Friday, after a 40% rally the previous day.
- Humanity Protocol hovers above $0.1680 on Friday after rising roughly 55% in the last seven days.
- Polygon approaches $0.10 after an 8% jump on Thursday, ending the four-day decline.
Altcoins, including River (RIVER), Humanity Protocol (H) and Polygon (POL), rank as top-performing cryptocurrencies in the last 24 hours, defying the broader market pullback as Bitcoin (BTC) dropped below $67,000. The technical outlook indicates that the recovery in River faces resistance, whereas Humanity Protocol and Polygon have held steady on Friday following a rebound.
River extends rebound above $20
River is trading near $21.50 at press time on Friday, with resistance at the 50-day Exponential Moving Average (EMA) at $22.59 following Thursday's 40% rally. The U-shaped recovery in RIVER records more than 70% gains so far this week.
If the altcoin clears above $22.59, it could test the 50% retracement level at $30.08, measured from the January 26 high of $88.72 to the February 1 low of $10.19.
Technical indicators on the daily chart indicate a bullish shift in trend momentum. The Moving Average Convergence Divergence (MACD) rises toward the signal line, potentially indicating a bullish crossover as negative histograms contract, indicating a decline in selling pressure. At the same time, the Relative Strength Index (RSI) is at 48, hovering near the midline and indicating a neutral stance.
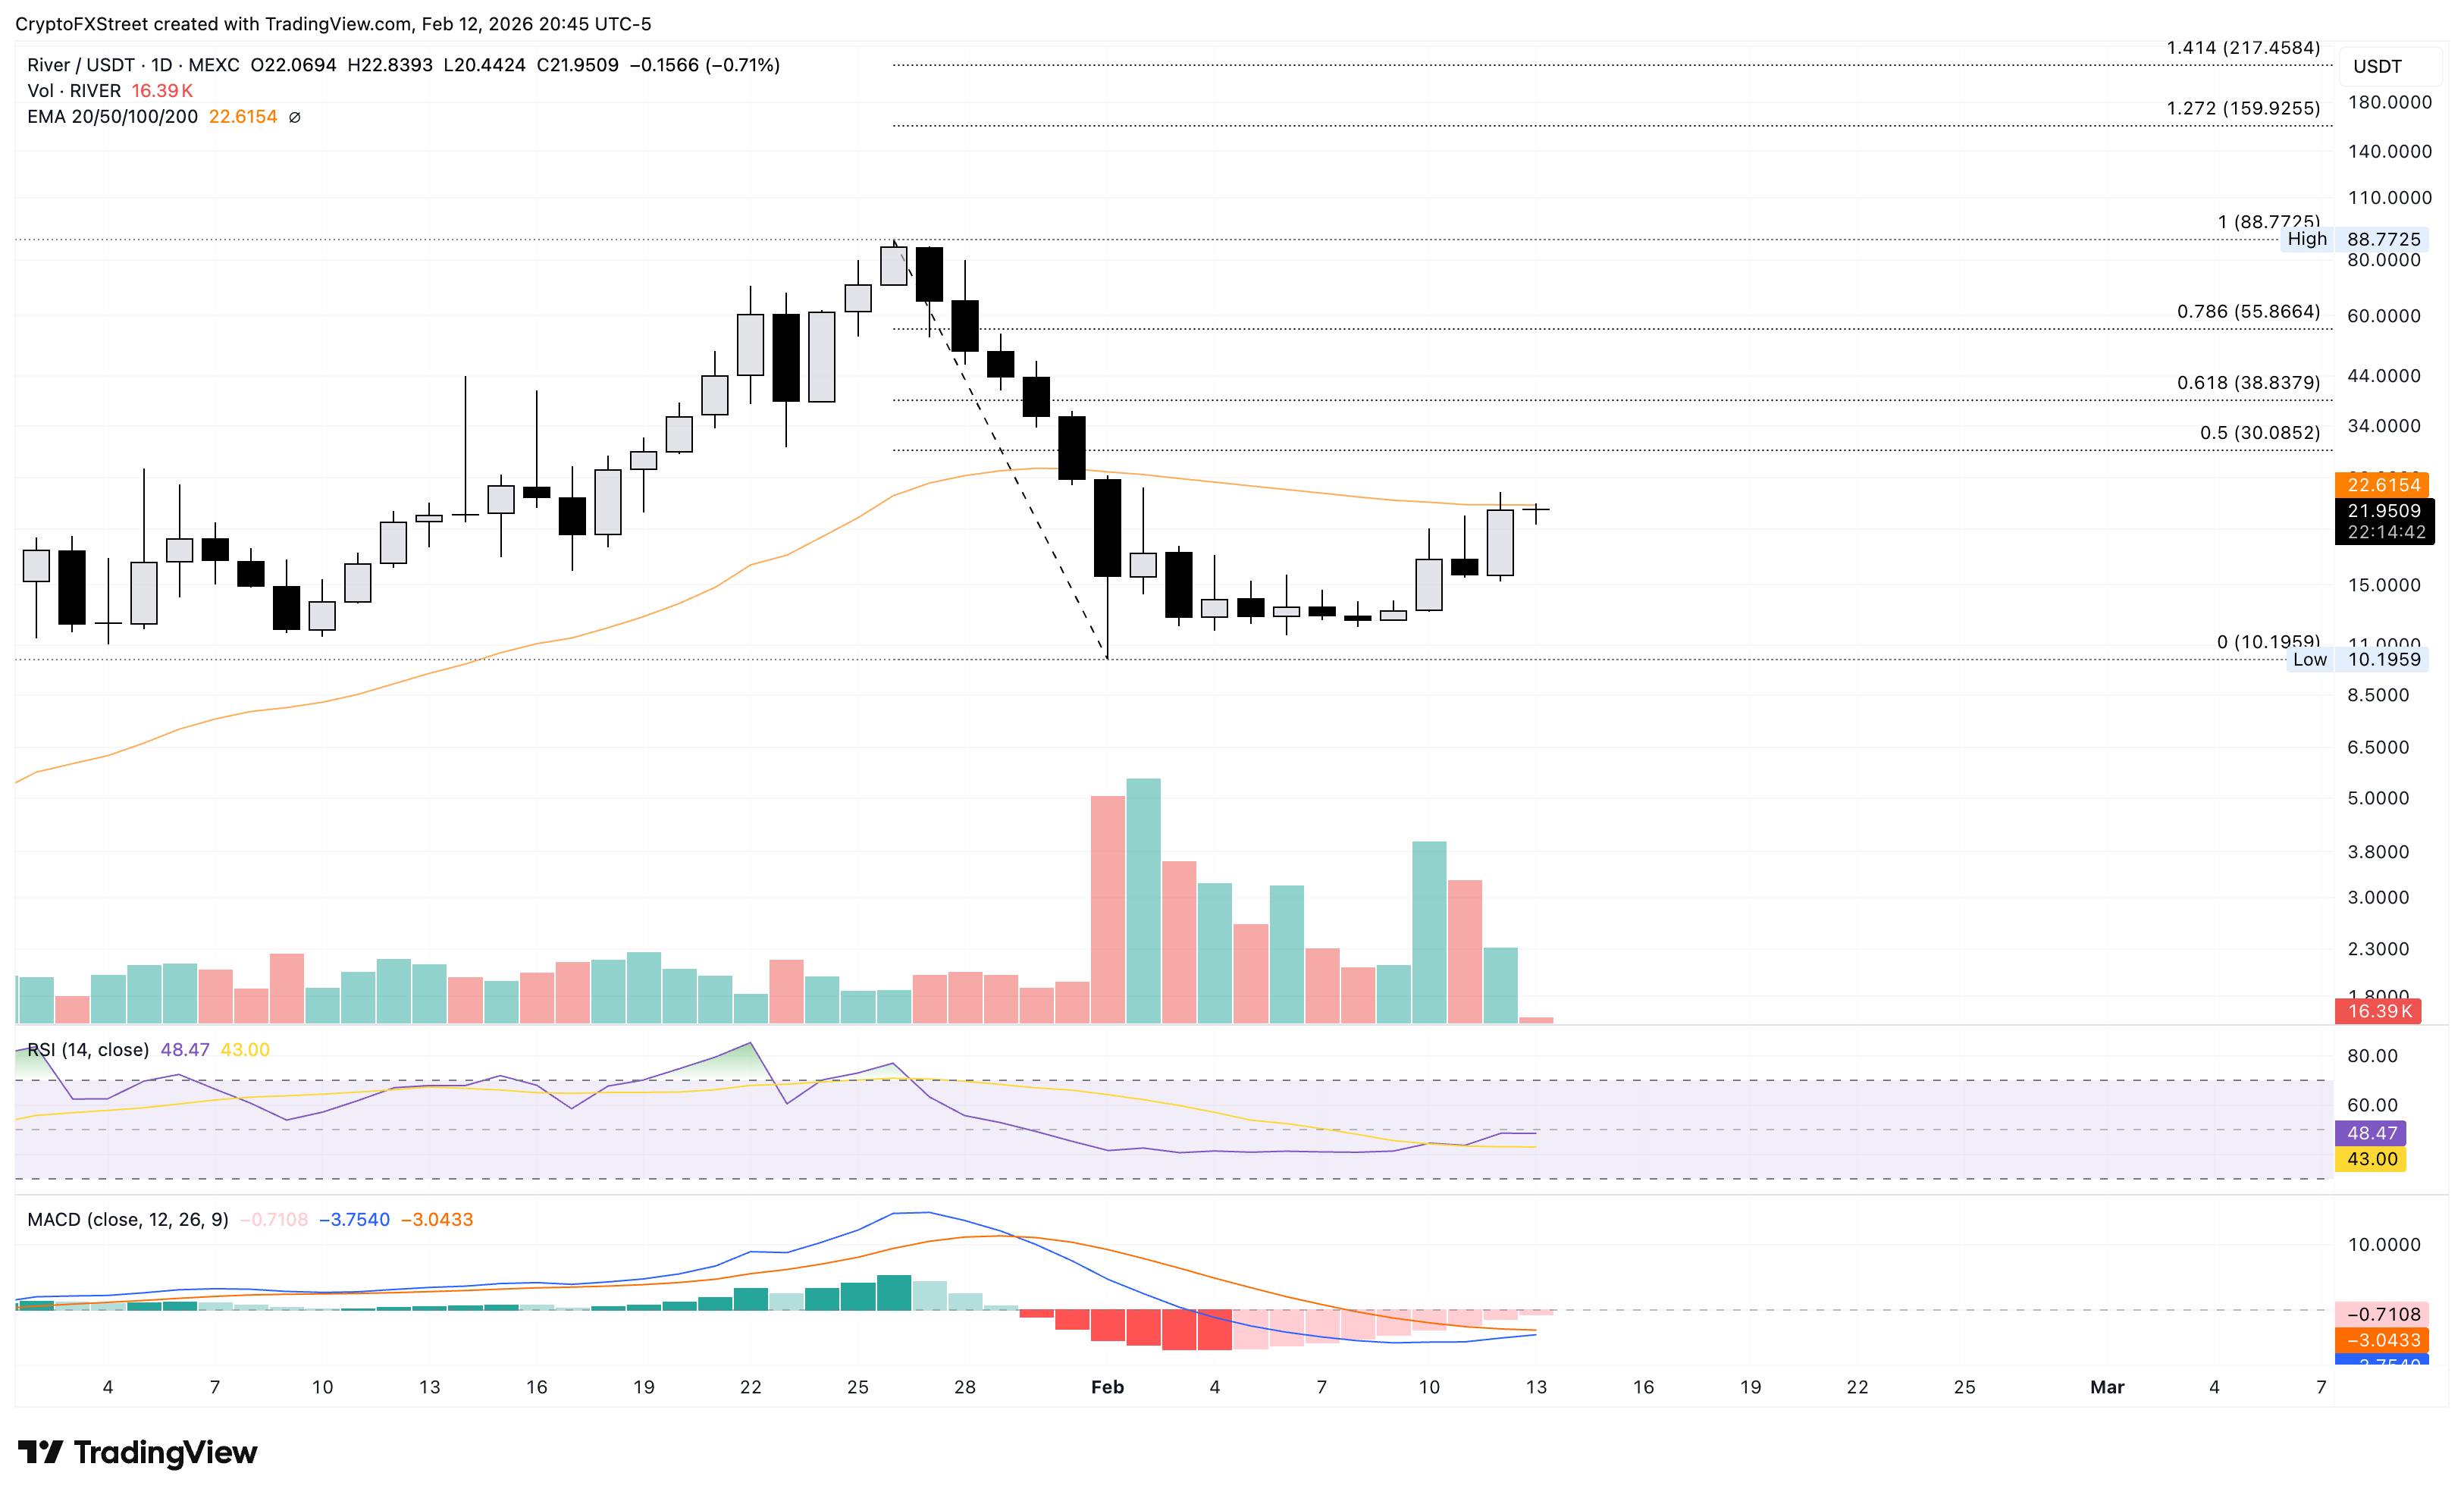
On the downside, a reversal from the 50-day EMA at $22.59 could retest the $10.19 support level.
Humanity Protocol rally targets $0.20 resistance
Humanity Protocol extended its rebound from the 200-day EMA at $0.1125 for the seventh consecutive day, accounting for over 75% gains. At the time of writing, H is trading above $0.175, crossing the 50-day EMA at $0.1464.
The altcoin is approaching the 61.8% Fibonacci retracement level at $0.1764, measured from the October 24 high at $0.4010 to the December 7 low at $0.0467. A decisive close above this level could challenge the $0.2077 resistance, which has previously capped gains twice since late December.
Beyond this, the 78.6% Fibonacci retracement level at $0.2532 could serve as the upper resistance level.
The RSI on the daily chart is at 61, indicating a steady recovery above the midline, with further upside before reaching overbought levels, confirming a bullish bias. The MACD line on the same chart crosses above the zero line as positive histograms expand, indicating rising bullish momentum.
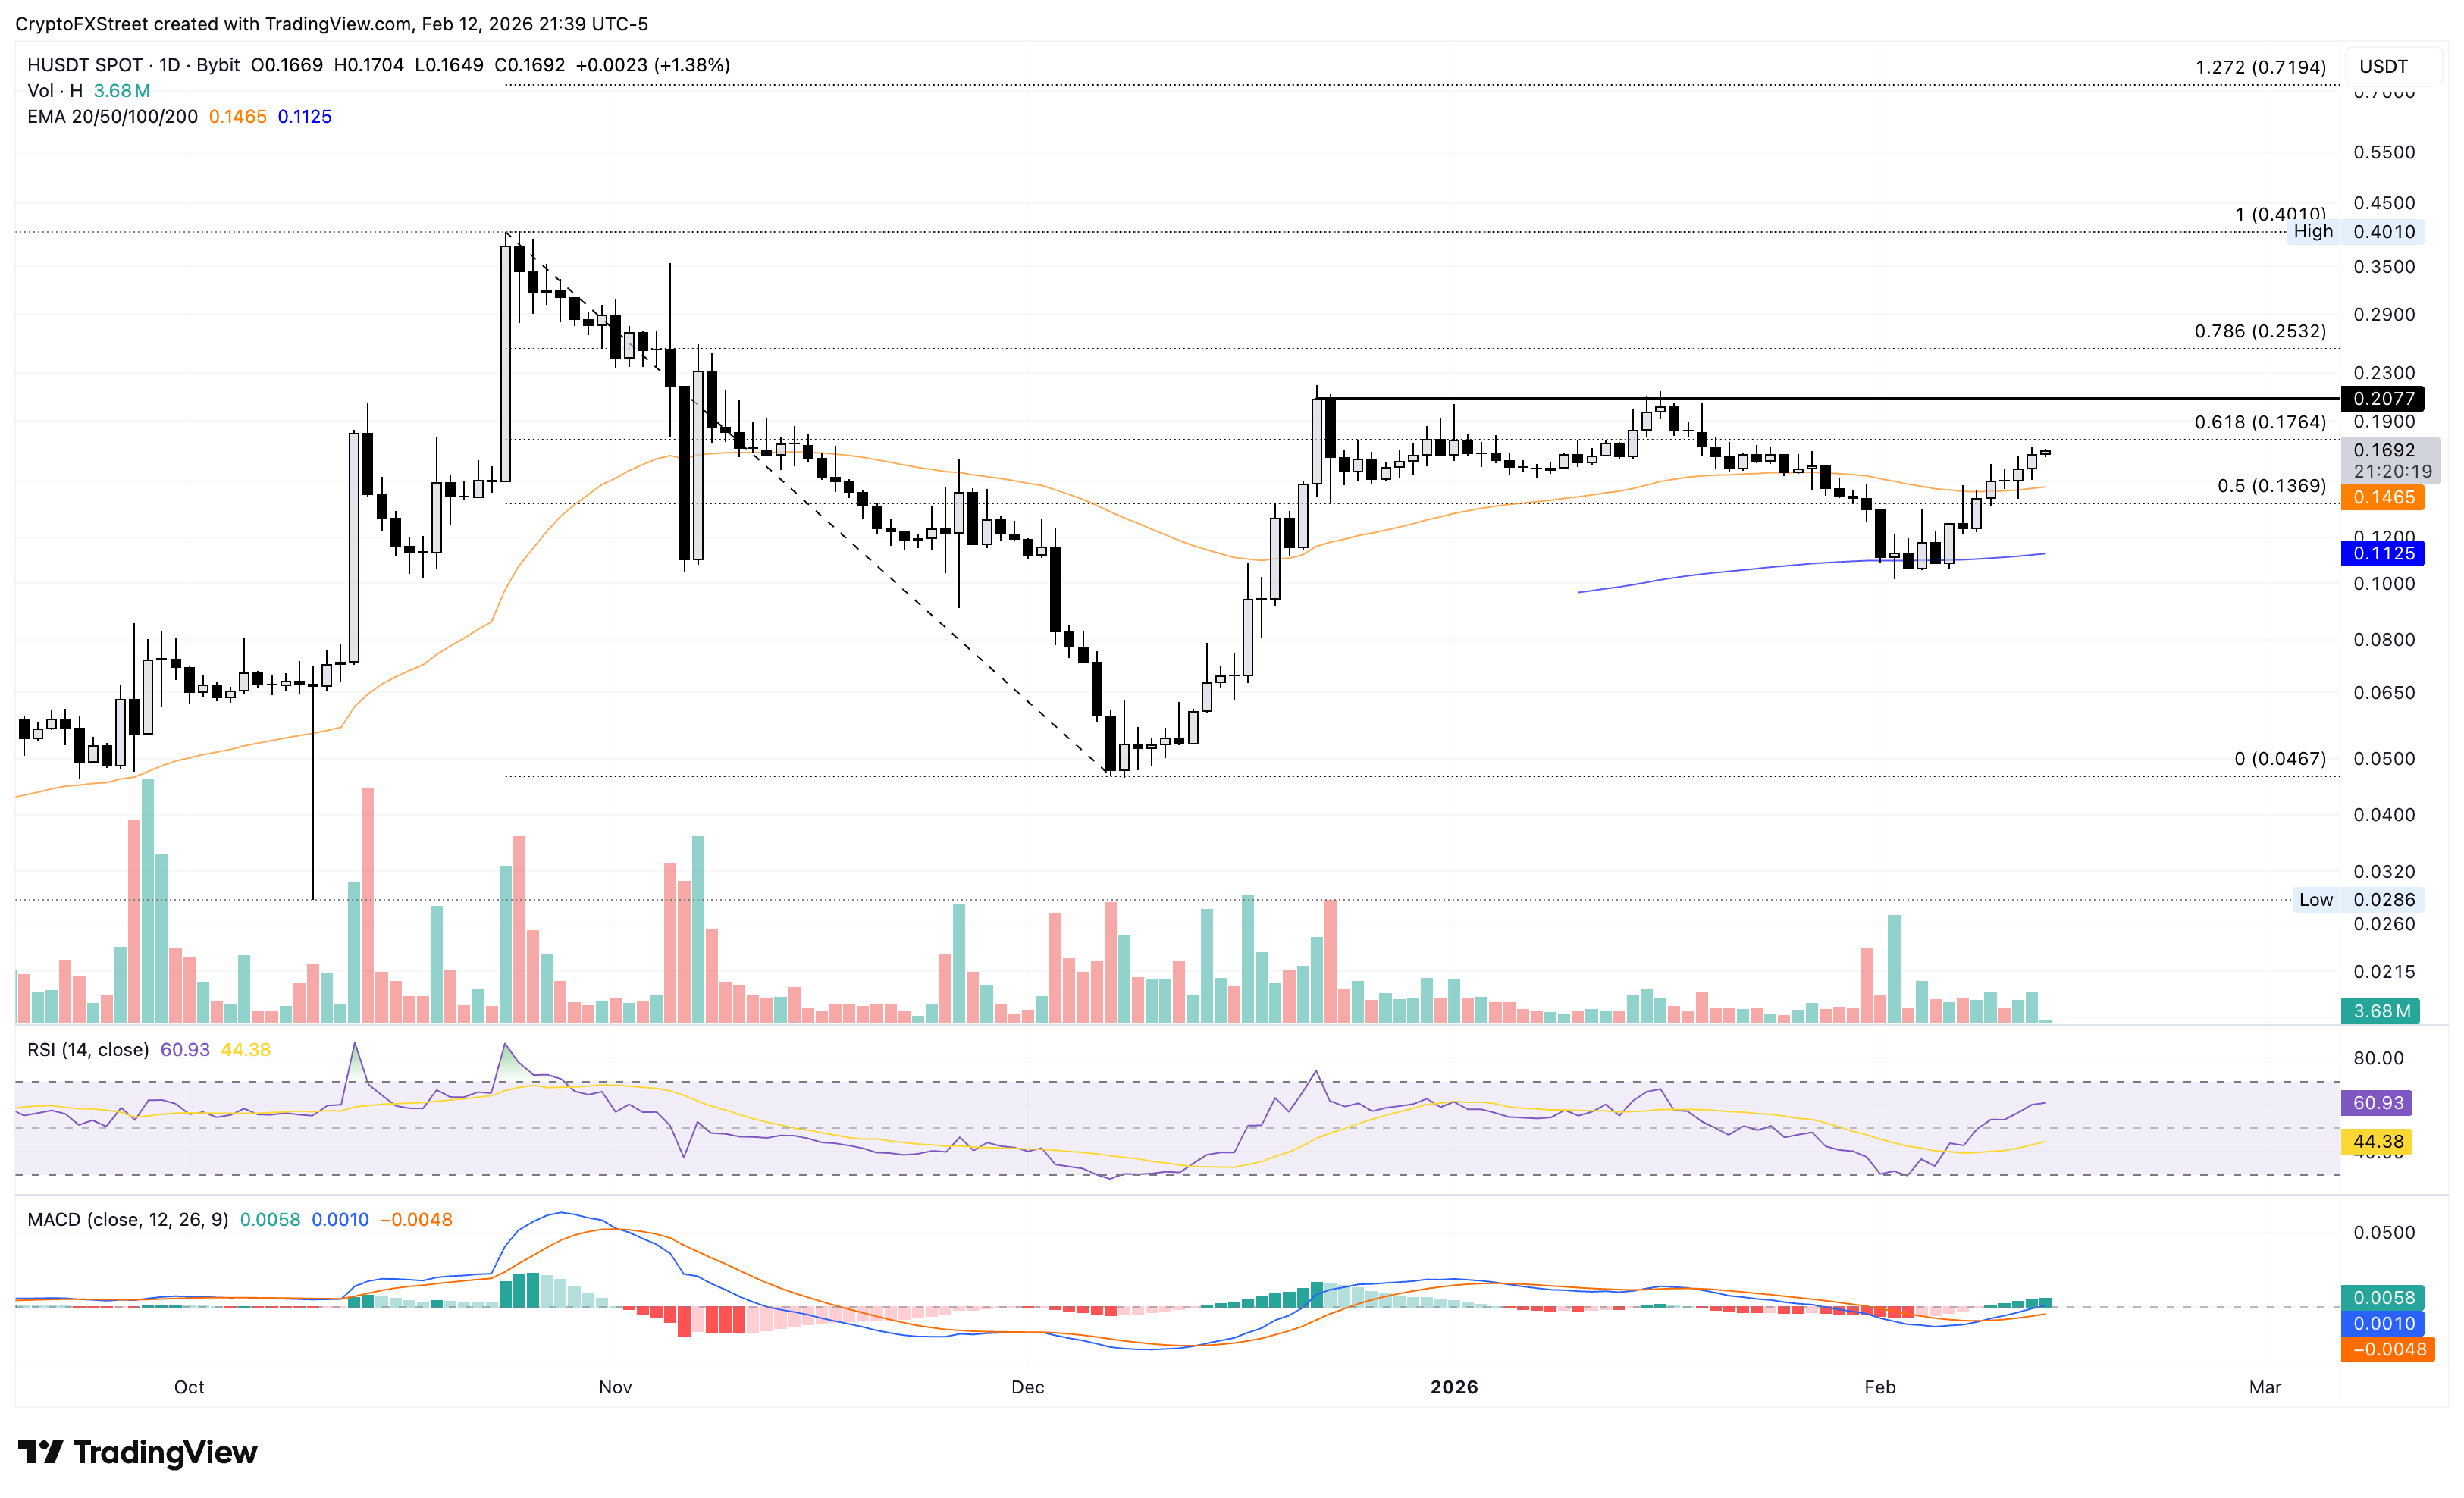
On the flip side, the 50-day EMA at $0.1465 and the 50% retracement level at $0.1369 could serve as crucial support levels.
Polygon recovery suggests a double-bottom reversal
Polygon is up over 1% at press time on Friday, extending its 8% recovery from the previous day. The altcoin is approaching the $0.10 psychological level, extending its rebound after a four-day decline. However, the declining trend in the 50- and 200-day EMAs confirms the prevailing bearish bias.
The renewed recovery in POL suggests a potential double-bottom reversal, with the psychological level serving as the neckline. A decisive close above $0.10 could extend the recovery to the 50-day EMA at $0.1167.
The technical indicators on the daily chart confirm the short-term recovery in bullish momentum. The RSI at 40 bounces off the oversold boundary, indicating reduced selling pressure. Meanwhile, the MACD line converges with the signal line, suggesting a bullish crossover as negative histograms decline, thereby reaffirming the decline in bearish momentum.
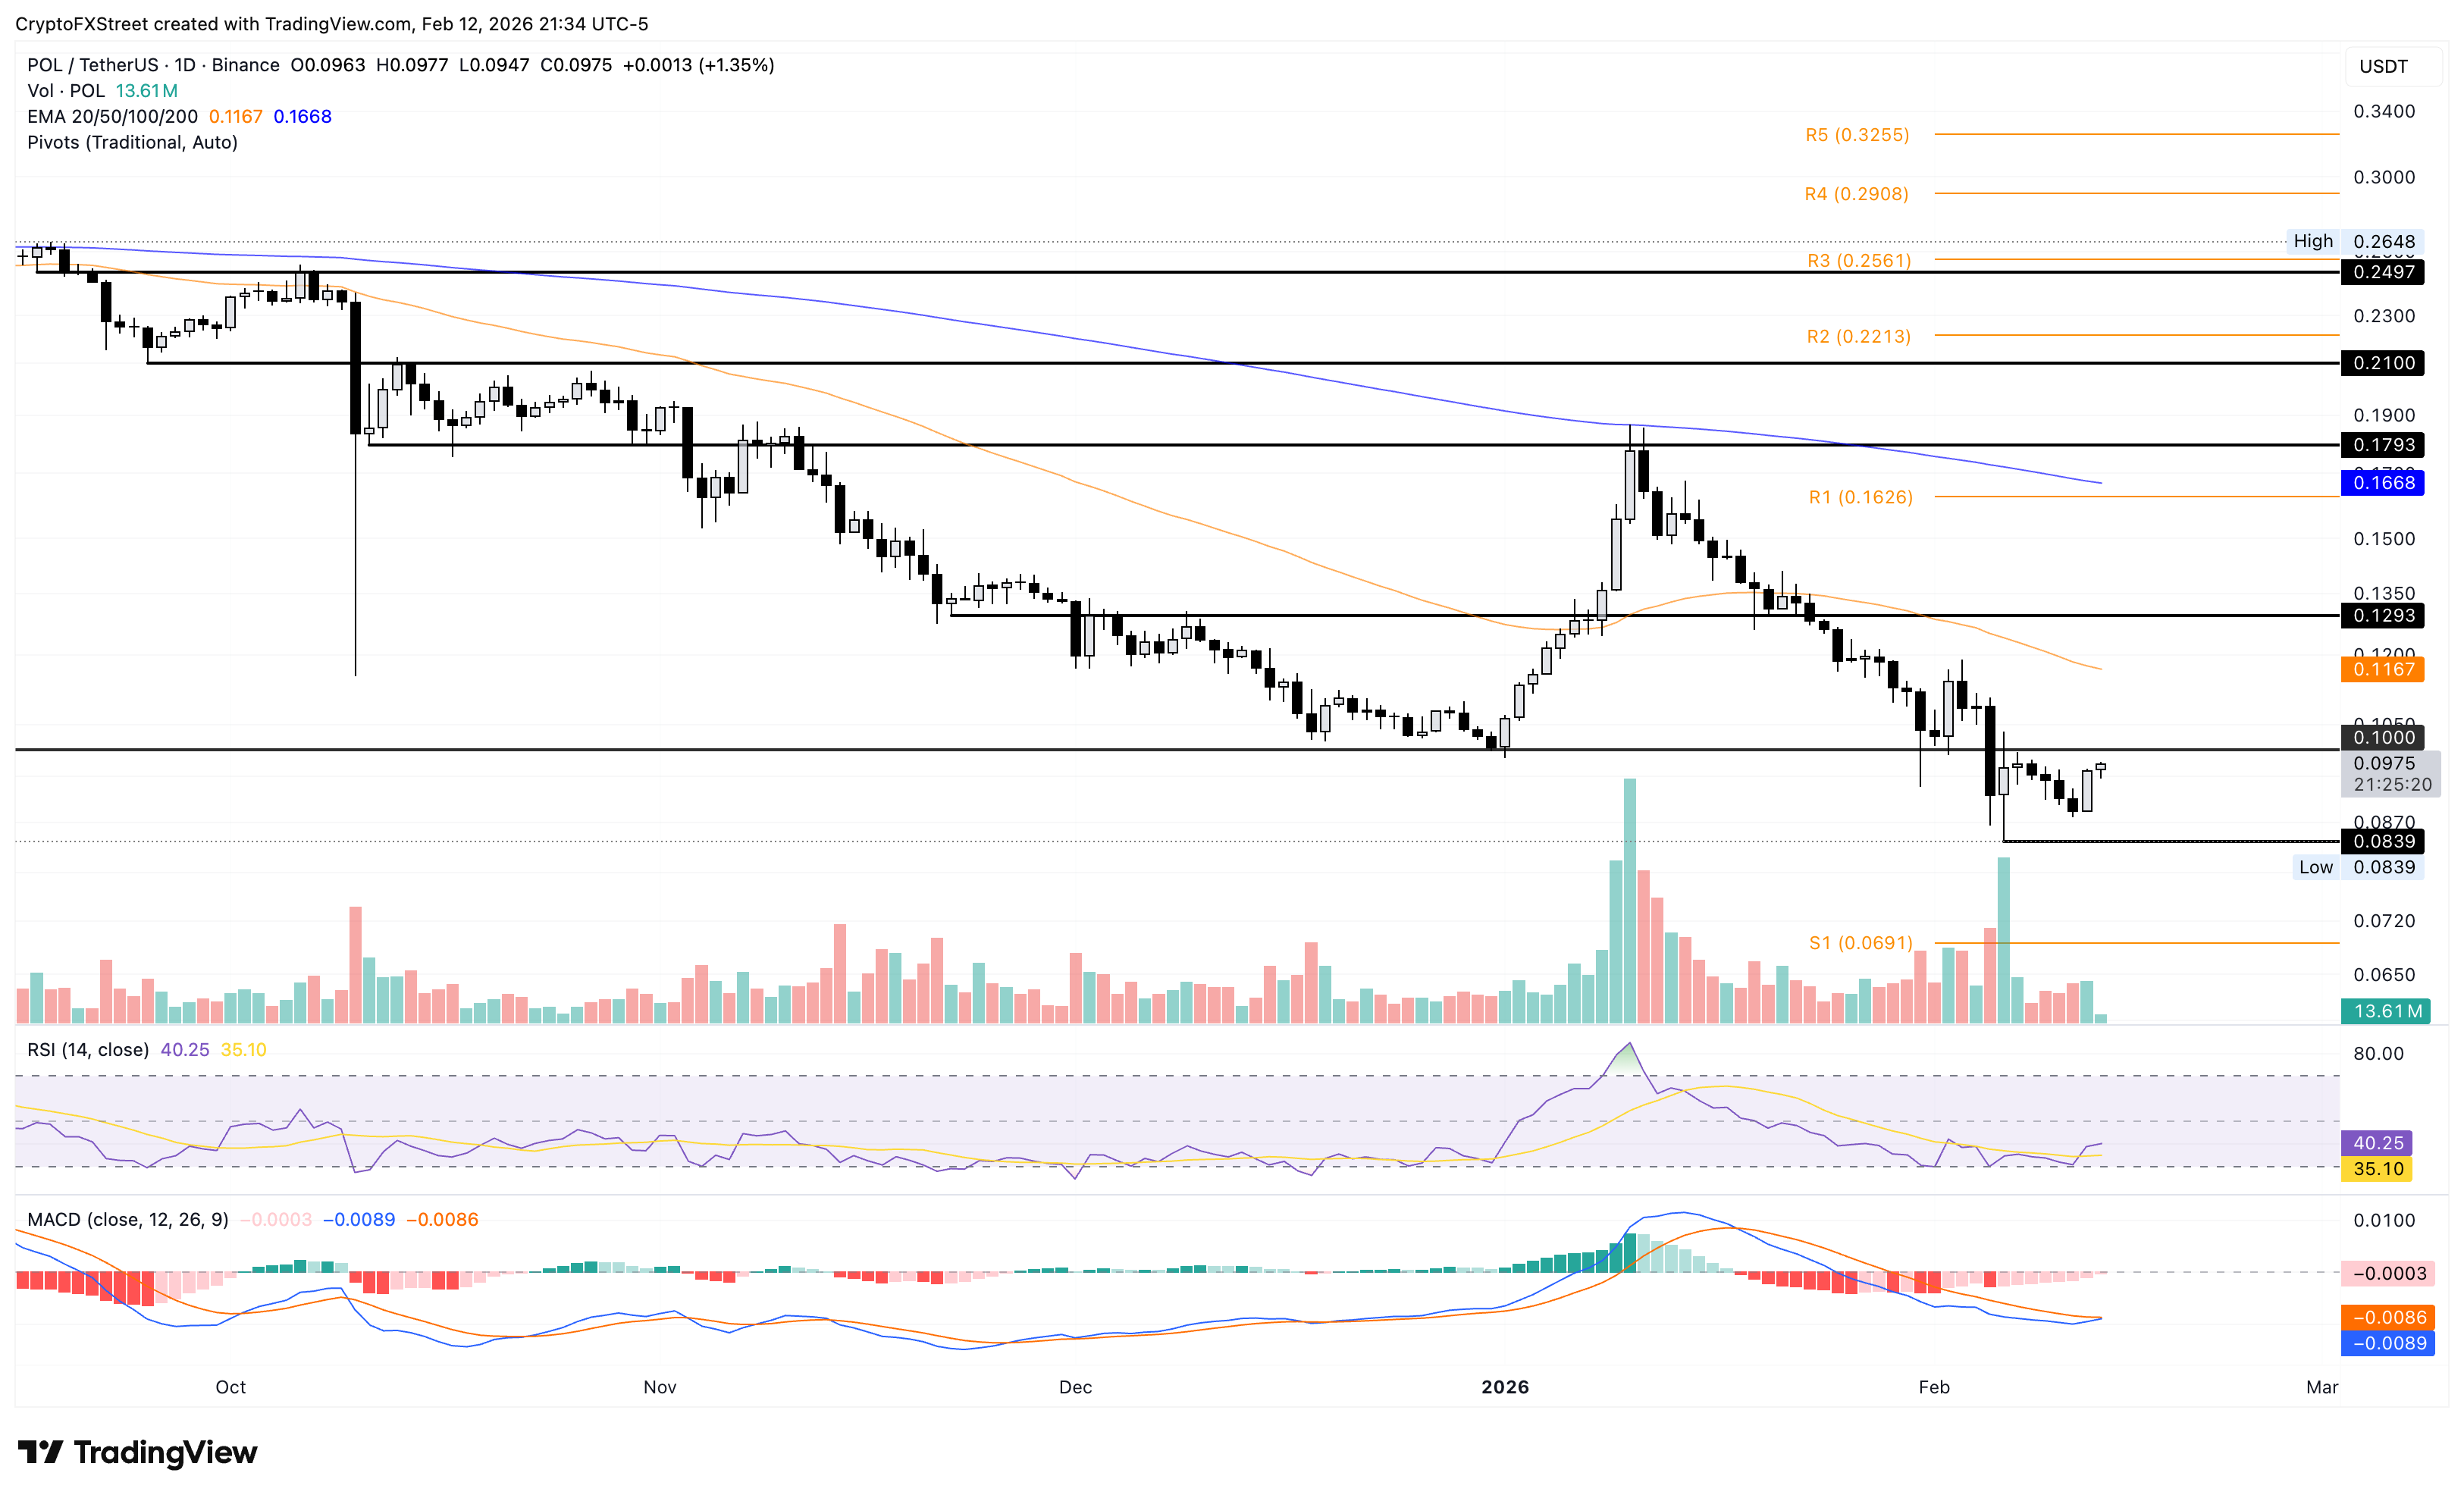
On the flip side, the crucial support for Polygon remains the February 6 low at $0.0839 and a deeper zone at the S1 pivot point at $0.0691.

Oltre un milione di utenti si affida a FXStreet per dati di mercato in tempo reale, strumenti di charting, approfondimenti di esperti e notizie Forex. Il loro calendario economico completo e i webinar formativi aiutano i trader a rimanere informati e a prendere decisioni ponderate. FXStreet conta circa 60 professionisti tra la sede di Barcellona e diverse regioni globali.
Leggi di più


