
Top Crypto Losers: Monero, Zcash, and Jupiter lead losses as Bitcoin floors $60,000
Di Vishal Dixit
Data di Pubblicazione: 6 Feb 2026 | Data di Modifica: 6 Feb 2026


ARTICOLI POPOLARI

Monero (XMR), Zcash (ZEC), and Jupiter (JUP) are leading the cryptocurrency bear market over the last 24 hours as Bitcoin (BTC) dropped 14% on Thursday.
- Monero drops below $300 on Friday after a 23% decline the previous day amid a broader market correction.
- Zcash resurfaces above $200 on Friday, holding its ground after a 49% downtrend over the last eight days.
- Jupiter hovers above $0.1500 on Friday following a 16% drop on Thursday, breaking out of a consolidation range.
Monero (XMR), Zcash (ZEC), and Jupiter (JUP) are leading the cryptocurrency bear market over the last 24 hours as Bitcoin (BTC) dropped 14% on Thursday. At the time of writing, Bitcoin climbed to $65,000 on Friday in the early Asian trading session from a $60,000 low earlier on the day, reflecting a minor recovery and potential short-term floor formation. The technical outlook for altcoins is skewed to the downside if the major crypto continues to lose its floor.
Bitcoin rebounds from $60,000
Bitcoin is down roughly 50% from its all-time high of $126,199 on October 6, putting the broader market under pressure. On the daily chart, Bitcoin holds above the 78.6% trend-based Fibonacci retracement level at $62,083, which is measured within a bearish flag pattern, as previously reported by FXStreet.
A decisive close below this level could push BTC toward the 100% Fibonacci retracement level at $52,324.
Technically, the momentum indicators on the daily chart are skewed to the downside, suggesting intense bearish pressure. The Moving Average Convergence Divergence (MACD) sinks deeper into the negative region as the histogram below the zero line widens. Additionally, the Relative Strength Index (RSI) is at 21, flashing an intense oversold condition which suggests potential rebounds to challenge overhead supply pressure.
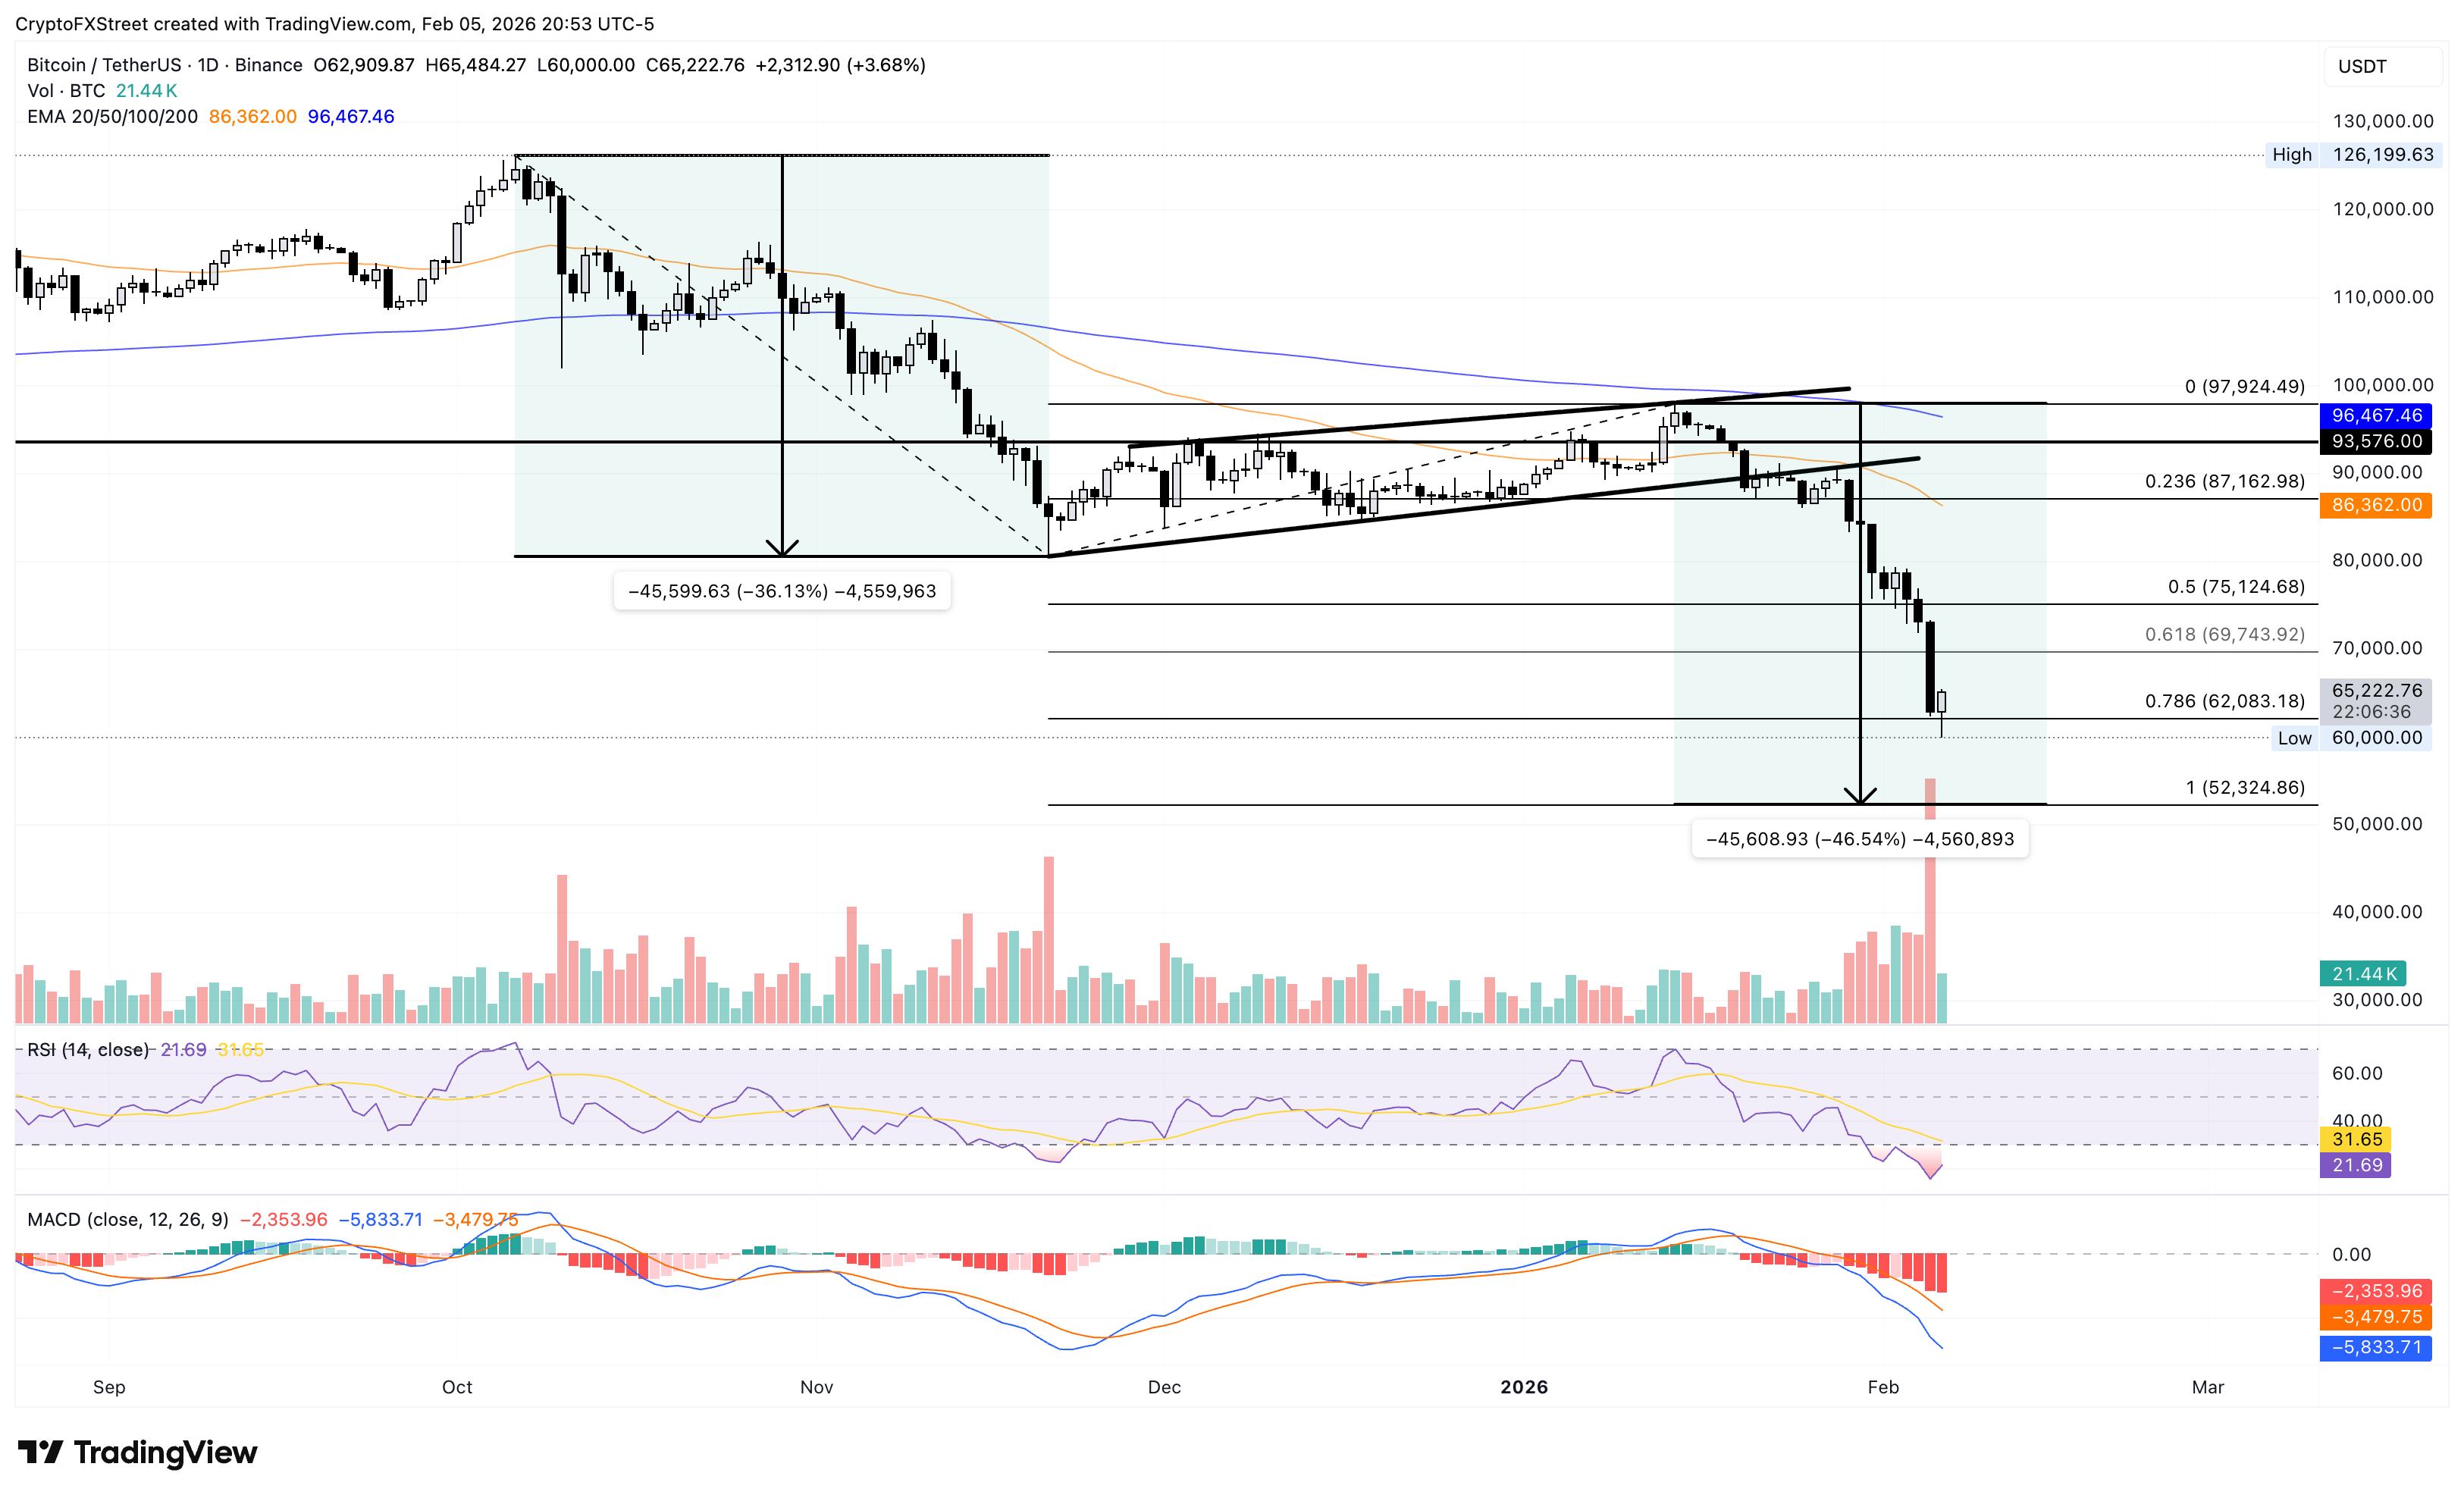
Looking up, Bitcoin should surface above the 61.8% Fibonacci retracement level at $69,743 to ease the downside pressure. This could extend the BTC recovery toward the 50% retracement level at $75,124.
Monero’s decline gains traction
Monero struggles below the $300 area at press time on Friday, following Thursday's 23% decline, which formed a bearish Marubozu candle. The privacy coin remains well below the 50-day Exponential Moving Average (EMA) at $454 and the 200-day EMA at $385, reinforcing a bearish setup.
The MACD and signal line, both below zero, extend lower as the negative histogram expands, suggesting intensifying bearish momentum. The RSI at 26 indicates an oversold condition, implying a potential bounce could emerge.
If the declining trend in XMR sustains, it could approach the August 15 low at $231.
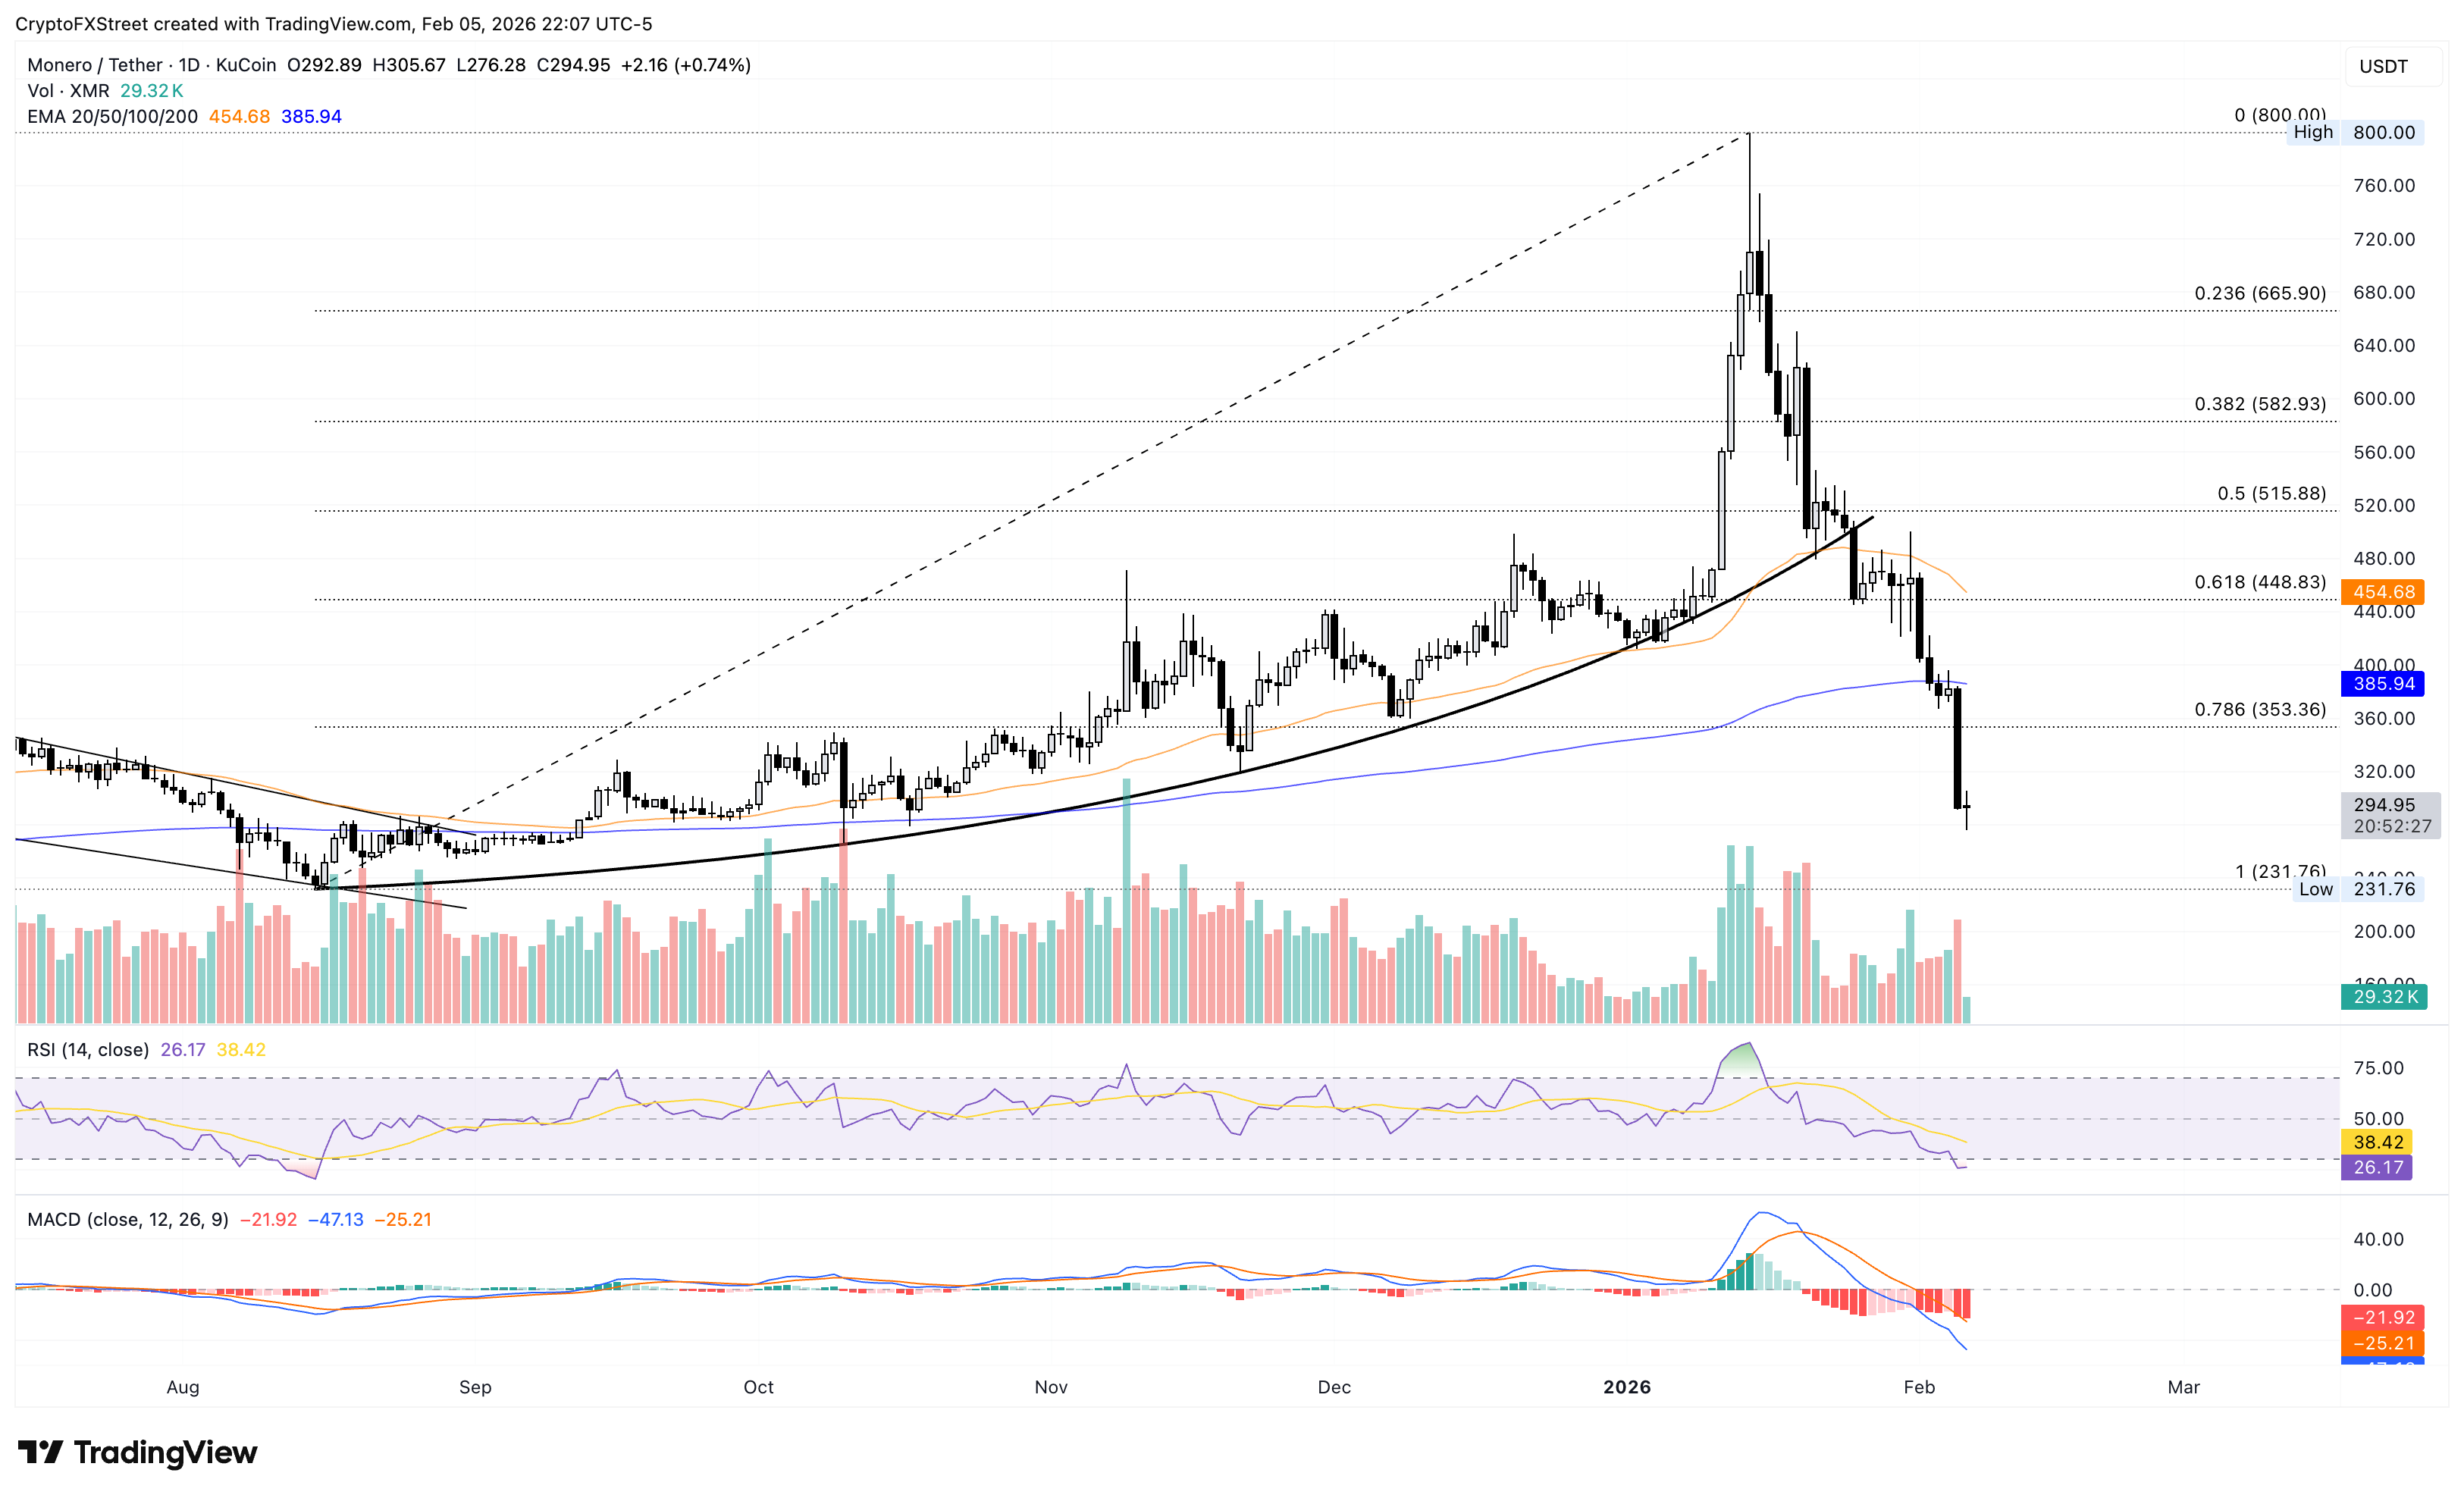
On the upside, the 78.6% Fibonacci retracement level at $353, measured from the August 15 low to the January 14 high at $800, remains a crucial resistance.
Zcash holds at a crucial level
Zcash holds above $200 at press time on Friday after an 18% decline the previous day. The privacy coin extends the decline below the 200-day EMA as the 50-day EMA continues to slope lower, preserving a bearish backdrop.
The MACD and signal line are in a freefall below zero, with a widening negative histogram that suggests intensifying bearish momentum. The RSI at 25, bearish-leaning, confirms an oversold condition.
The 50% Fibonacci retracement level at $186, measured from the September 22 low at $46 to the November 7 high at $750, remains a crucial support.
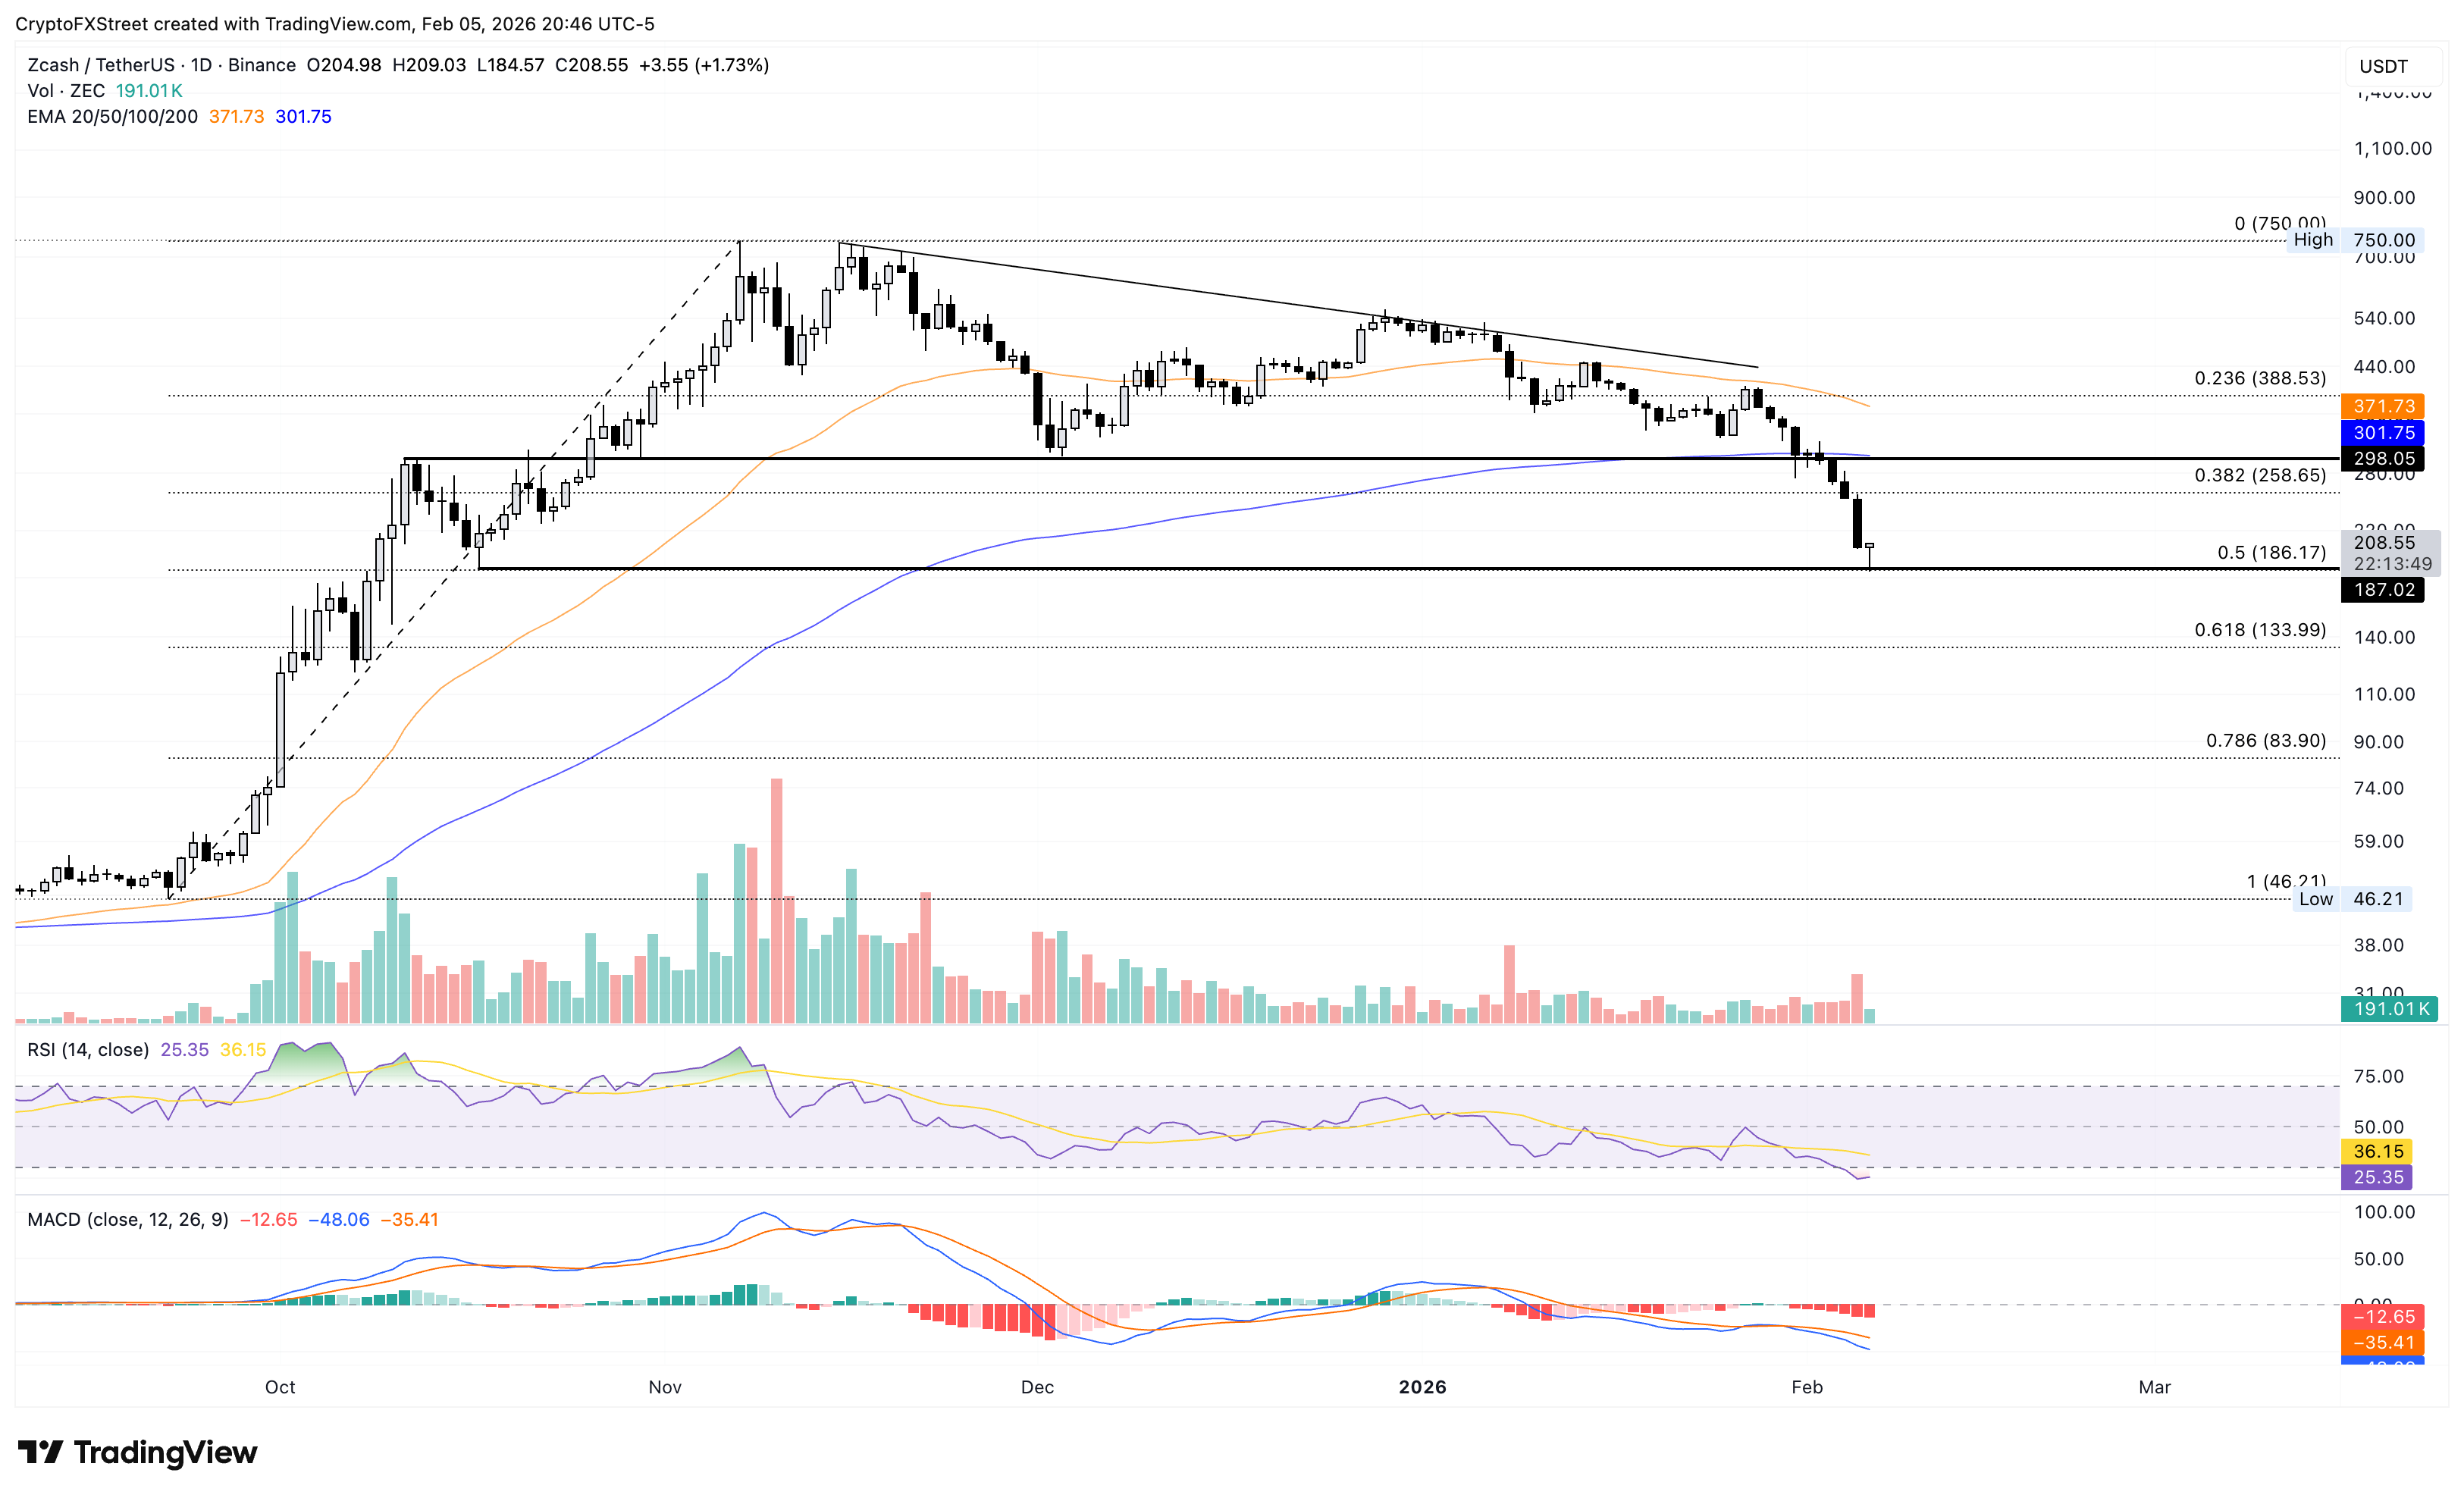
In the event of a recovery, the 38.2% Fibonacci retracement level at $258 would serve as a critical overhead resistance level.
Jupiter struggles for a rebound
Jupiter trades above $0.1500 at the time of writing on Friday, recovering from $0.1389 earlier on the day. The 50-day EMA continues to slide toward the 200-day EMA, signaling a potential Death Cross pattern.
The momentum indicators support the bearish skew as RSI at 36, bearish-leaning, approaches the oversold zone while the MACD histogram widens below zero.
A decisive close below the S1 Pivot Point at $0.1455 could extend the decline to the S2 Pivot Point at $0.1106.
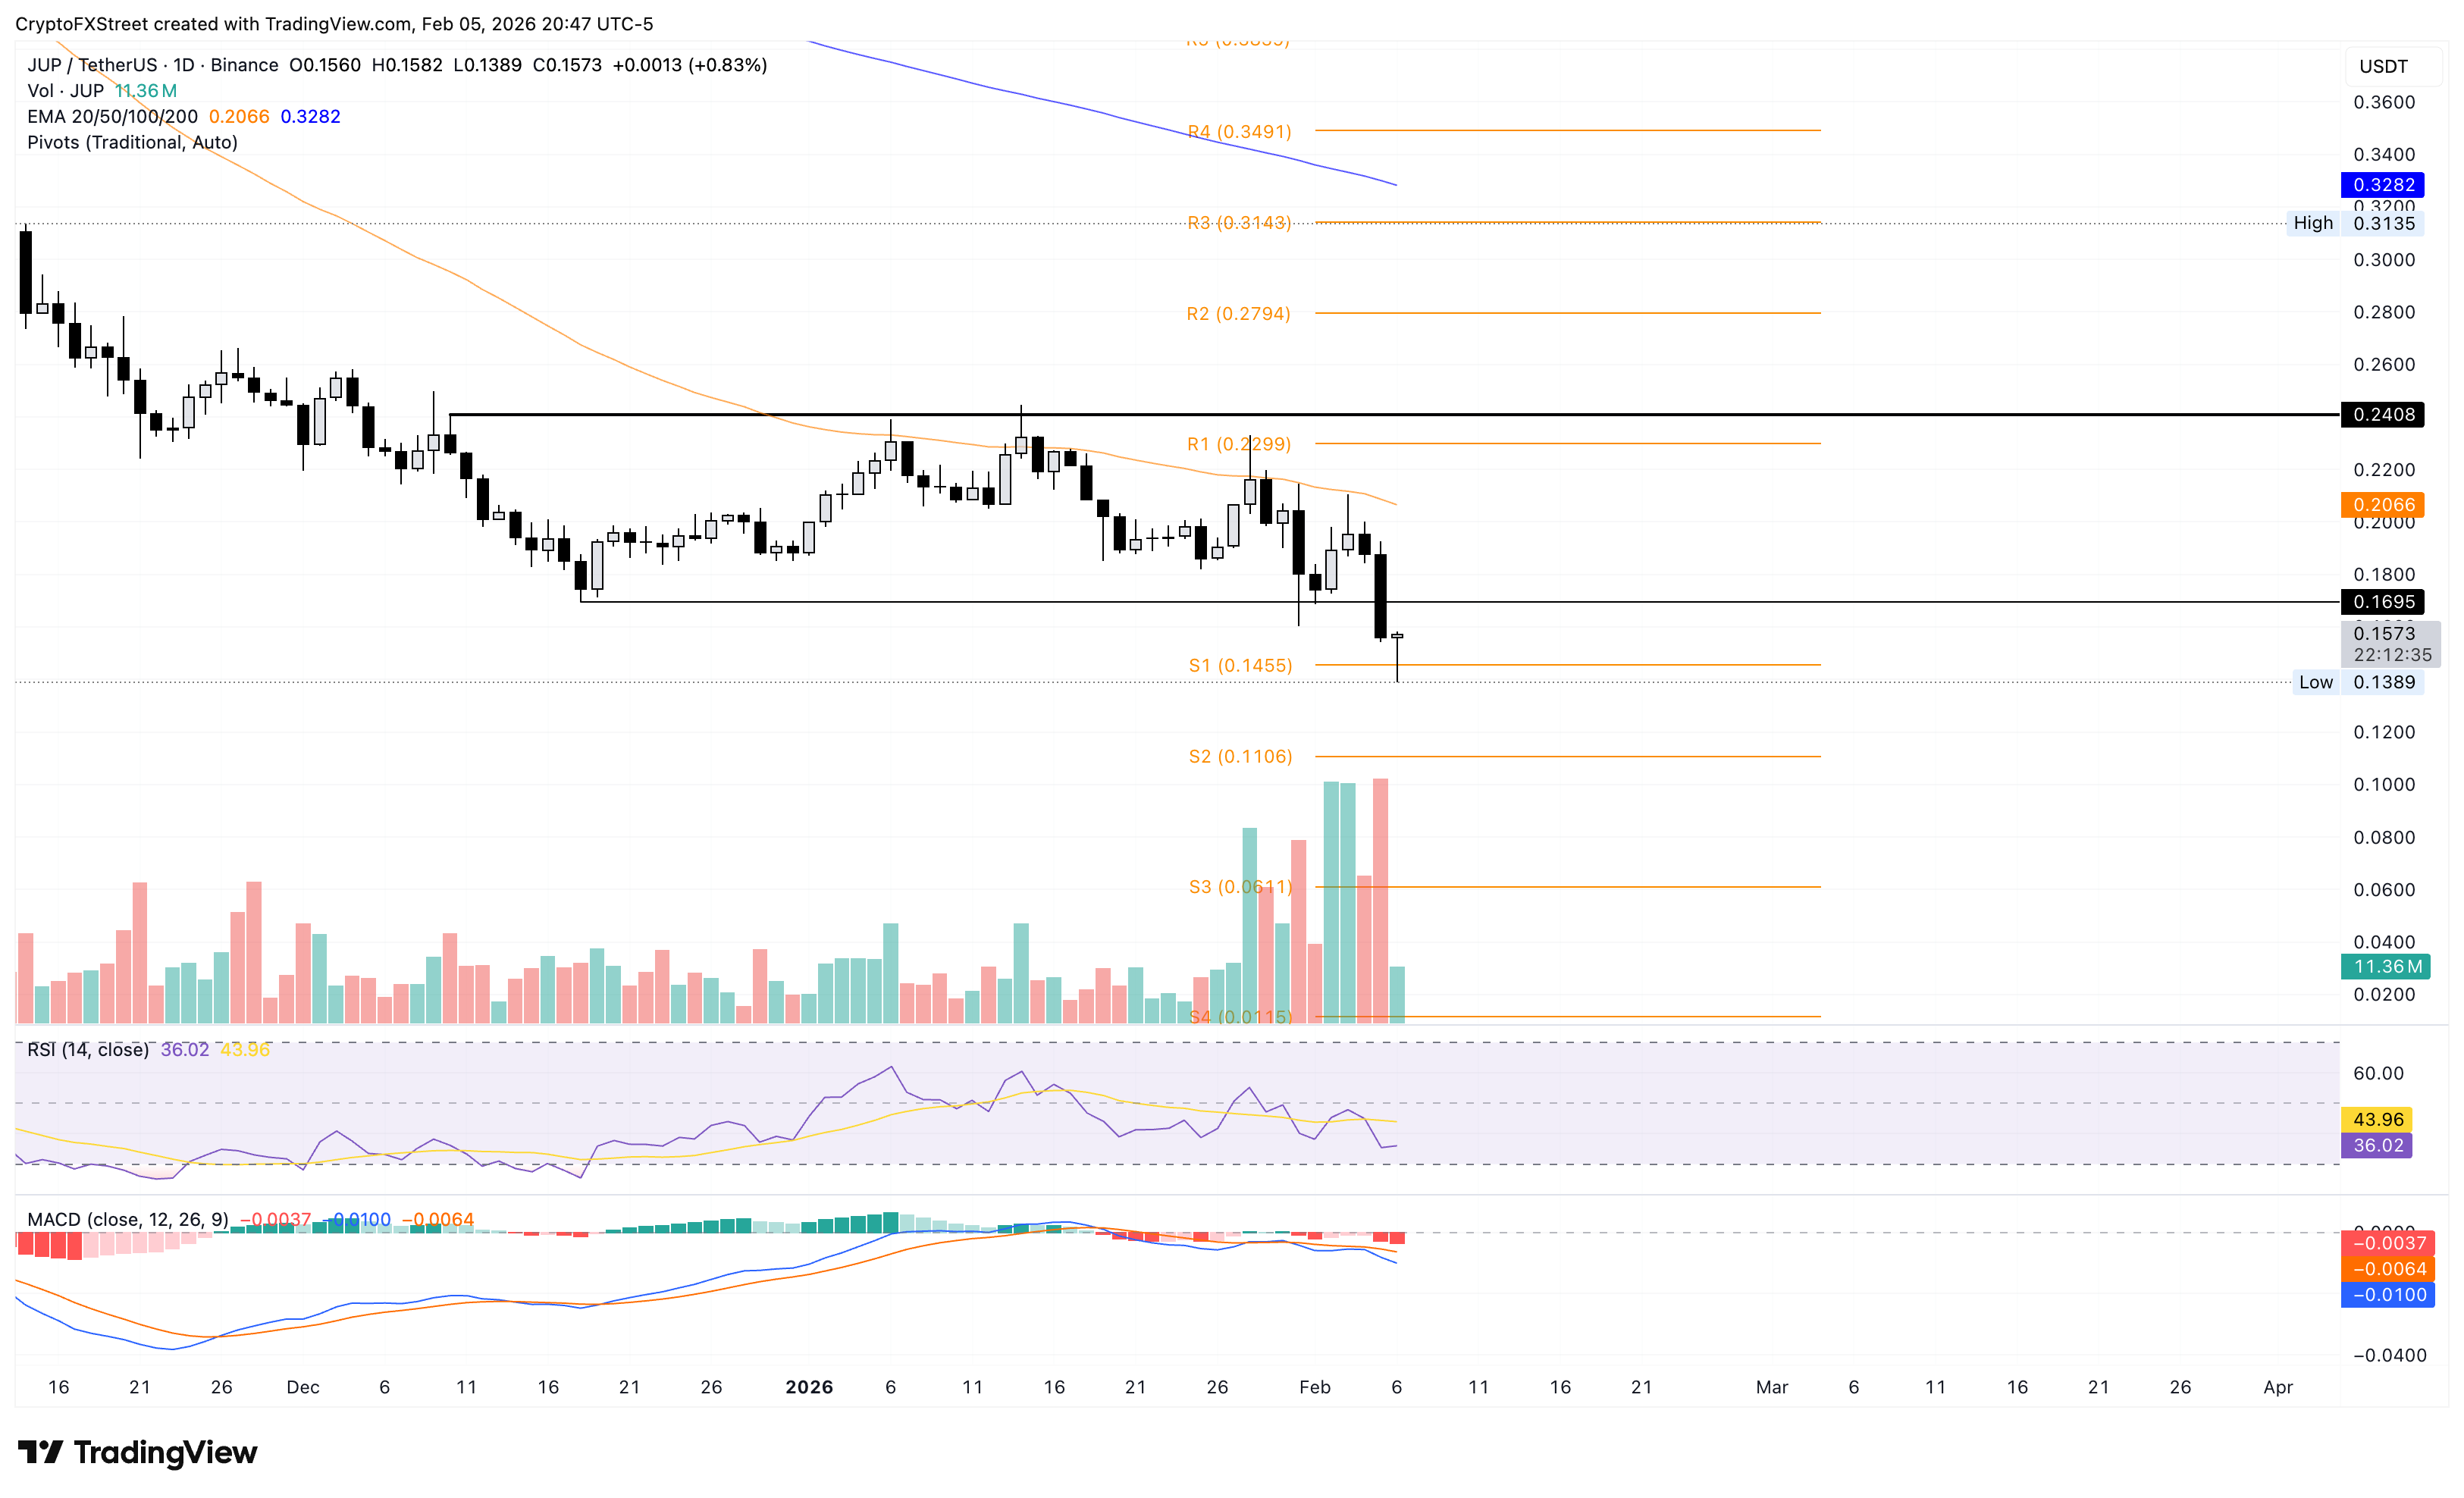
However, a sustained rebound could aim for the 50-day EMA at $0.2066.
(The technical analysis of the altcoins was written with the help of an AI tool.)

Oltre un milione di utenti si affida a FXStreet per dati di mercato in tempo reale, strumenti di charting, approfondimenti di esperti e notizie Forex. Il loro calendario economico completo e i webinar formativi aiutano i trader a rimanere informati e a prendere decisioni ponderate. FXStreet conta circa 60 professionisti tra la sede di Barcellona e diverse regioni globali.
Leggi di più


