
Top Layer 2 Networks Price Prediction: Mantle, Arbitrum, Optimism
Di Michael Ebiekutan
Data di Pubblicazione: 10 Feb 2026 | Data di Modifica: 10 Feb 2026


ARTICOLI POPOLARI

Layer 2 Networks have been in the limelight over the past week following a tweak in Ethereum's rollup-centric roadmap and criticisms from Ethereum co-founder Vitalik Buterin.
- Mantle is likely to test $0.84 if it rises above $0.68.
- ARB could move upwards to $0.171 if it flips $0.126 and the 20-day EMA.
- OP may retest its all-time low at $0.16.
Layer 2 Networks have been in the limelight over the past week following a tweak in Ethereum's rollup-centric roadmap and criticisms from Ethereum co-founder Vitalik Buterin.
The conversation, which sparked a back-and-forth between a few L2 founders and community members, saw a few Layer 2 tokens establishing new lows amid the wider crypto market decline.
Mantle eyes rise above $0.68
Mantle (MNT) is consolidating and attempting to reclaim $0.68 after bouncing off $0.51 last Friday. The Layer-2 token could test $0.84 if it rises above $0.68. However, it faces potential resistance at the 20-day Exponential Moving Average (EMA), which has proven a major hurdle since last December.
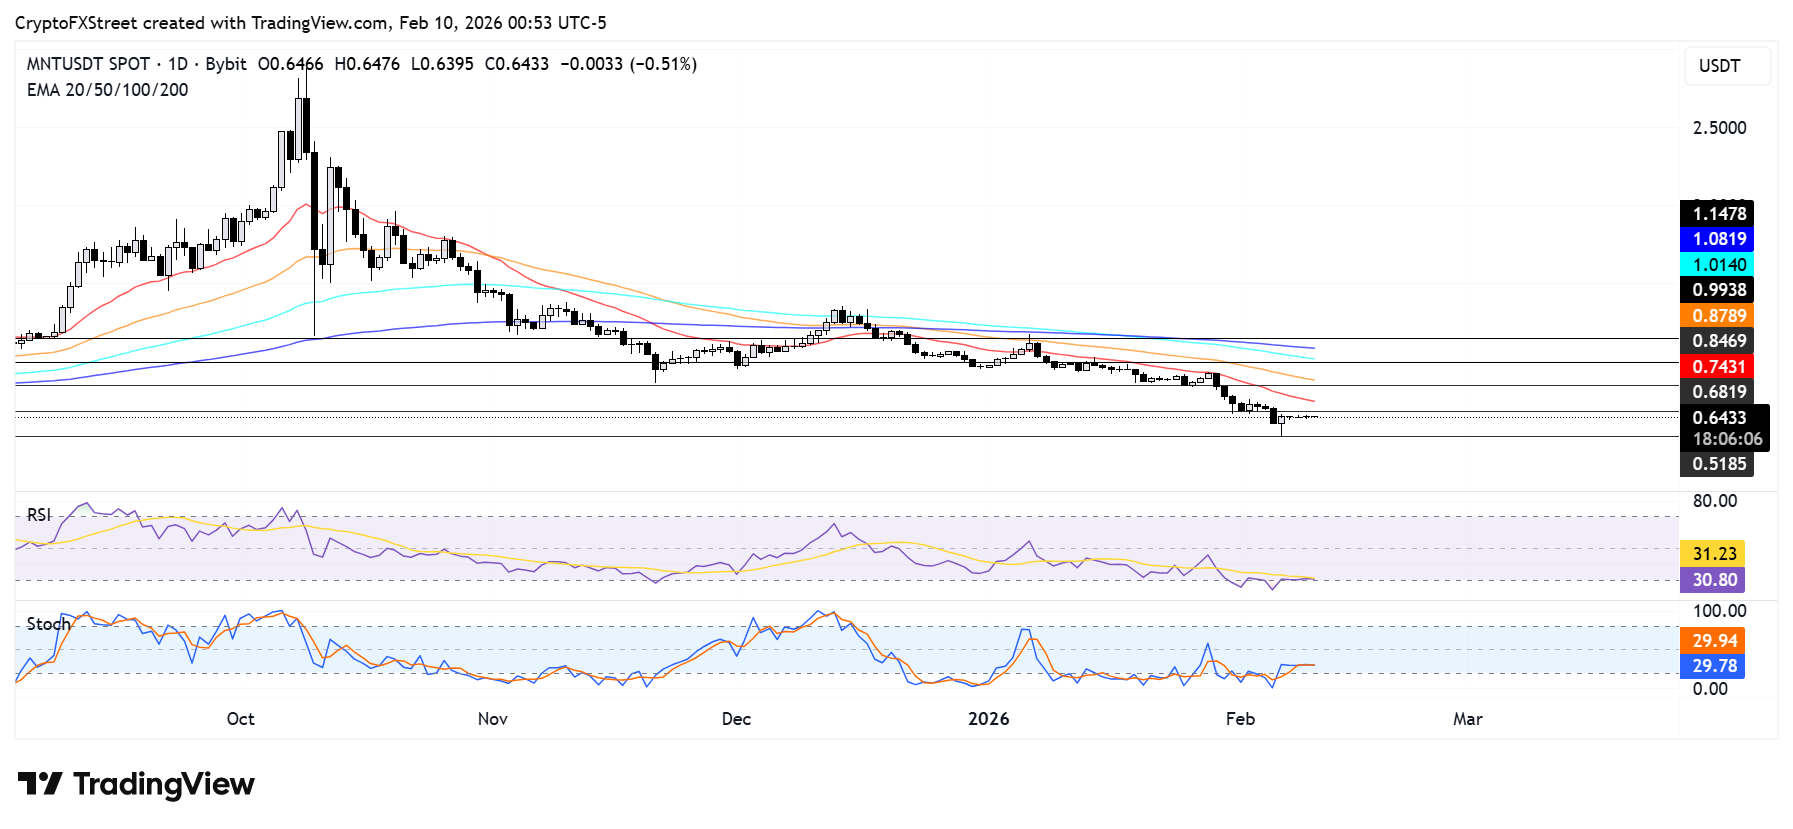
On the downside, MNT could find support at $0.51 if it sees a rejection near $0.68.
The Relative Strength Index (RSI) and Stochastic Oscillator (Stoch) indicators on the daily chart are slightly above their oversold regions, indicating a modest decline in bearish momentum.
MNT is trading at $0.64 on Tuesday, down 0.1% over the past 24 hours at the time of publication.
Arbitrum could see a new low if it breaches $0.096
Arbitrum (ARB) is declining at the time of writing on Tuesday, approaching Friday's low of $0.096, its all-time low. The move comes after seeing a rejection at the $0.126 resistance over the weekend.
ARB could rise to $0.171 if it flips $0.126 and the 20-day EMA. On the downside, a breach of $0.096 could push the token to a new low of $0.063.
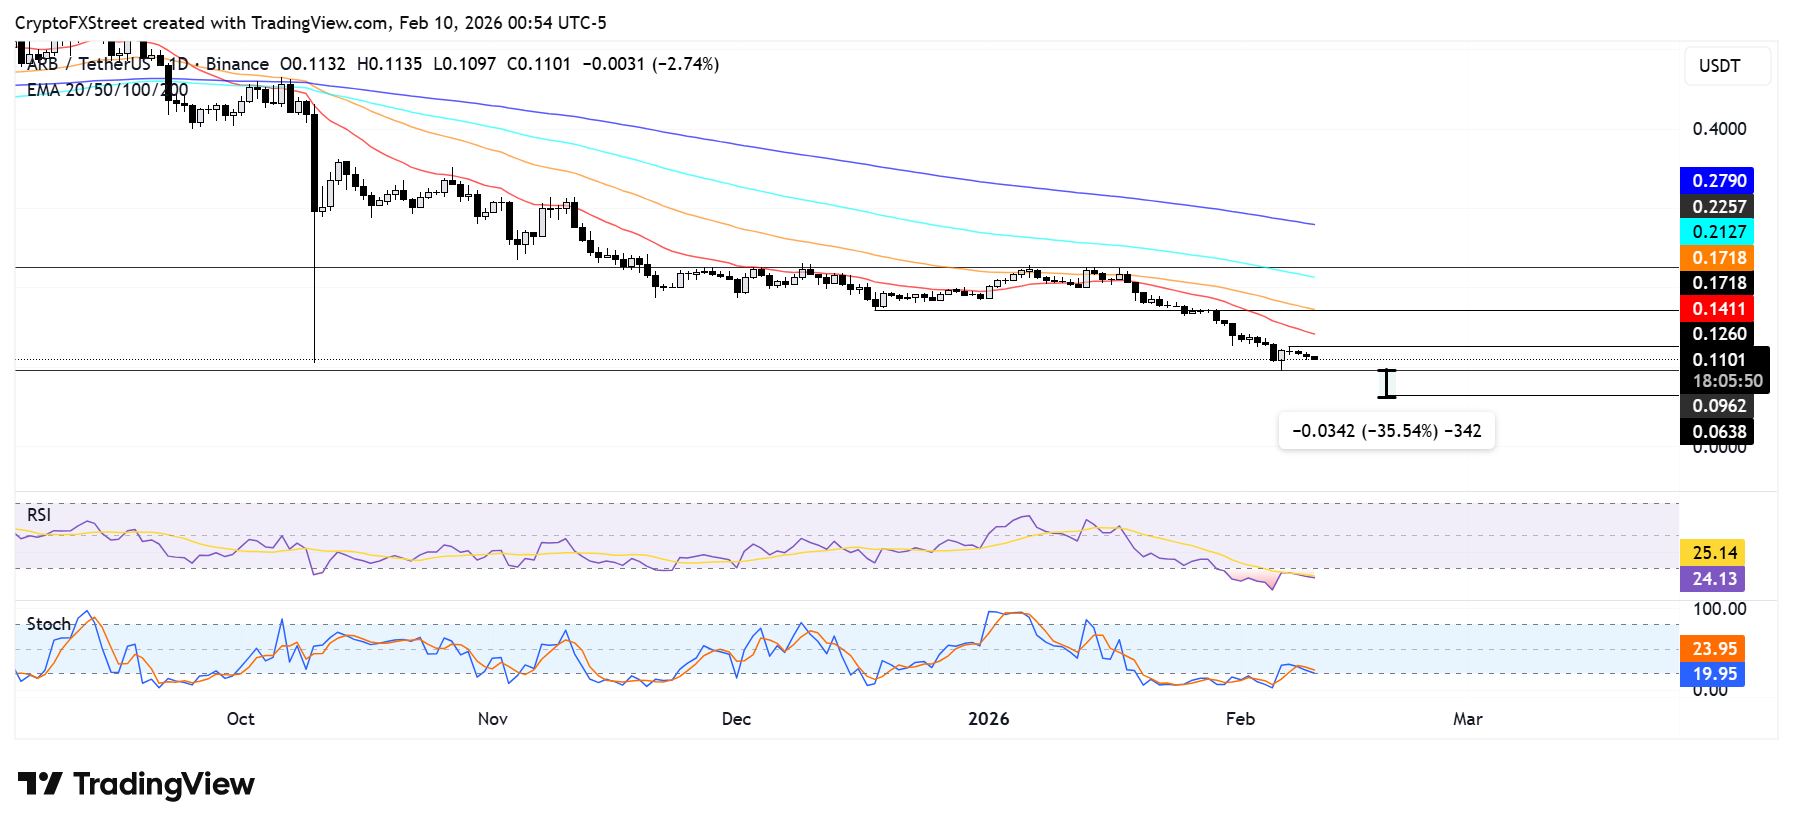
The RSI and Stoch indicators on the daily chart are in oversold territory, indicating a dominant bearish momentum.
ARB is changing hands at $0.11, down nearly 5% over the past 24 hours as of writing.
OP eyes downside after rejection at $0.20
Optimism (OP) is consolidating after seeing a rejection at $0.20 over the weekend. The token is tilted toward the downside and could retest its all-time low at $0.16.
On the upside, OP could rise to test $0.24, just below the 20-day EMA, if it reclaims $0.20.
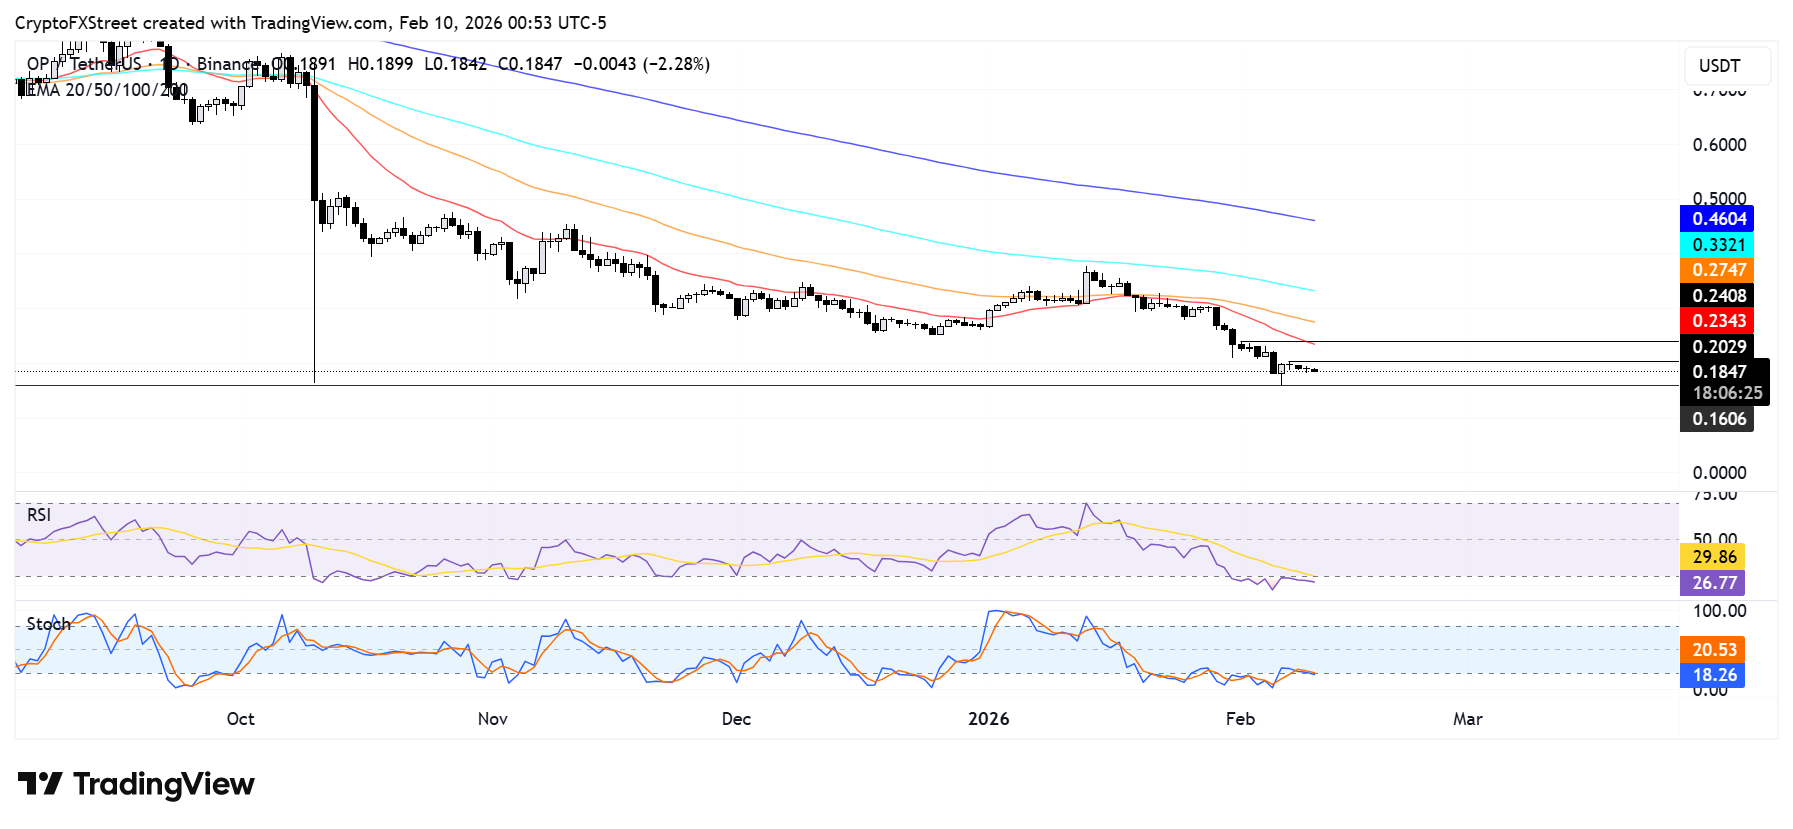
The RSI and Stoch indicators on the daily chart are in oversold conditions, indicating a continued dominance in bearish momentum.
OP is trading around $0.18, down 3% over the past 24 hours at the time of publication.

Oltre un milione di utenti si affida a FXStreet per dati di mercato in tempo reale, strumenti di charting, approfondimenti di esperti e notizie Forex. Il loro calendario economico completo e i webinar formativi aiutano i trader a rimanere informati e a prendere decisioni ponderate. FXStreet conta circa 60 professionisti tra la sede di Barcellona e diverse regioni globali.
Leggi di più


