
USD/CHF Price Analysis: Hovers around 0.8000 after refreshing YTD high
Di Christian Borjon Valencia
Aggiornato: 31 Mar 2026


ARTICOLI POPOLARI

The USD/CHF retreats after refreshing a year-to-date (YTD) high at 0.8041, but retreats below the 0.8000 figure amid growing speculation of a de-escalation of the Middle East conflict. At the time of writing, the pair trades at 0.7997, up 0.01%.
- USD/CHF retreats after hitting YTD high at 0.8041 level.
- RSI remains bullish, supporting continuation of broader upward trend.
- Break above 0.8000 targets 0.8041 and 0.8100 resistance levels.
The USD/CHF retreats after refreshing a year-to-date (YTD) high at 0.8041, but retreats below the 0.8000 figure amid growing speculation of a de-escalation of the Middle East conflict. At the time of writing, the pair trades at 0.7997, up 0.01%.
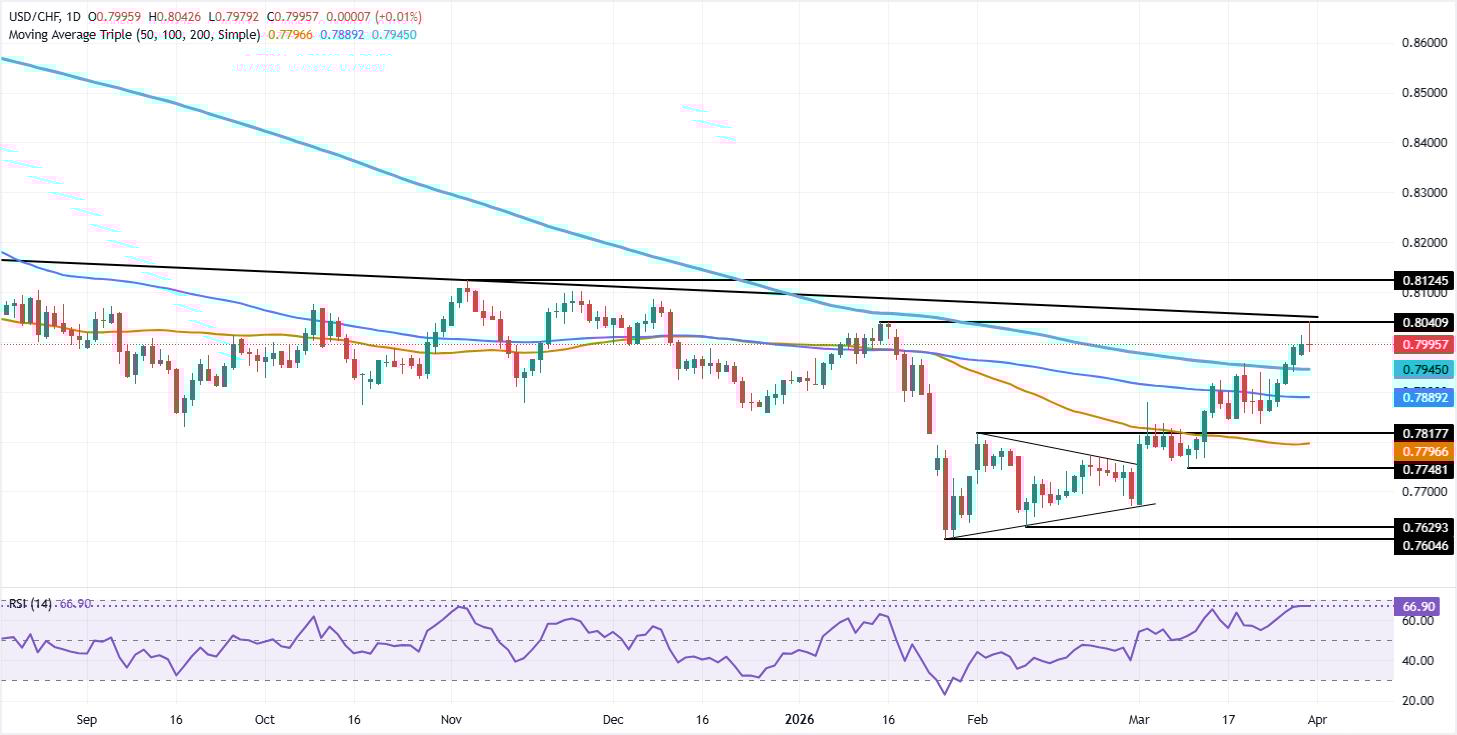
USD/CHF Price Analysis: Technical Outlook
The technical picture shows that the USD/CHF remains upward-biased after clearing the crucial 200-day Simple Moving Average (SMA) at 0.7942. Even though it is trading off daily highs, the momentum supports buyers, as evidenced by the Relative Strength Index (RSI) in bullish territory, aiming higher.
If USD/CHF climbs past 0.8000, the next resistance would be 0.8041. Once surpassed, the next area of interest becomes the November 25 daily high at 0.8102, ahead of the August 1 swing high at 0.8171.
On the other hand, if the pair struggles at 0.8000 and closes below it on a daily basis, the first support would be the March 30 daily low at 0.7971. On further weakness, the pair could drop towards the 200-day SMA at 0.7942, ahead of the 0.7900 mark.
USD/CHF Price Chart – Daily
Swiss Franc Price This Month
The table below shows the percentage change of Swiss Franc (CHF) against listed major currencies this month. Swiss Franc was the strongest against the New Zealand Dollar.
| USD | EUR | GBP | JPY | CAD | AUD | NZD | CHF | |
|---|---|---|---|---|---|---|---|---|
| USD | 2.11% | 1.93% | 1.65% | 1.69% | 3.06% | 4.19% | 3.31% | |
| EUR | -2.11% | -0.18% | -0.46% | -0.40% | 0.93% | 2.04% | 1.18% | |
| GBP | -1.93% | 0.18% | -0.25% | -0.23% | 1.11% | 2.19% | 1.35% | |
| JPY | -1.65% | 0.46% | 0.25% | 0.06% | 1.39% | 2.54% | 1.64% | |
| CAD | -1.69% | 0.40% | 0.23% | -0.06% | 1.33% | 2.46% | 1.59% | |
| AUD | -3.06% | -0.93% | -1.11% | -1.39% | -1.33% | 1.10% | 0.24% | |
| NZD | -4.19% | -2.04% | -2.19% | -2.54% | -2.46% | -1.10% | -0.84% | |
| CHF | -3.31% | -1.18% | -1.35% | -1.64% | -1.59% | -0.24% | 0.84% |
The heat map shows percentage changes of major currencies against each other. The base currency is picked from the left column, while the quote currency is picked from the top row. For example, if you pick the Swiss Franc from the left column and move along the horizontal line to the US Dollar, the percentage change displayed in the box will represent CHF (base)/USD (quote).

Oltre un milione di utenti si affida a FXStreet per dati di mercato in tempo reale, strumenti di charting, approfondimenti di esperti e notizie Forex. Il loro calendario economico completo e i webinar formativi aiutano i trader a rimanere informati e a prendere decisioni ponderate. FXStreet conta circa 60 professionisti tra la sede di Barcellona e diverse regioni globali.
Leggi di più


