
Trade The World
Avalanche Price Forecast: AVAX slips below $24 as momentum turns bearish
Di Manish Chhetri
Data di Pubblicazione: 19 Aug 2025 | Data di Modifica: 19 Aug 2025


POPULAR ARTICLES

Avalanche (AVAX) price extends its losses on Tuesday after falling nearly 6% the previous day. Derivatives market data signals growing bearish sentiment, with funding rates turning negative and short bets on the rise.
- Avalanche price continues to trade down over 2% on Tuesday after falling nearly 6% the previous day.
- Derivatives data show bearish sentiment building, with funding rates turning negative and short bets rising.
- The technical indicators highlight weakening momentum, signaling a likely correction ahead.
Avalanche (AVAX) price extends its losses on Tuesday after falling nearly 6% the previous day. Derivatives market data signals growing bearish sentiment, with funding rates turning negative and short bets on the rise. The technical outlook further confirms weakening momentum, suggesting the likelihood of a deeper correction in the near term.
Avalanche derivatives and on-chain data lean bearish
Coinglass’s OI-Weighted Funding Rate data shows that the number of traders betting that the price of Avalanche will slide further is higher than that anticipating a price increase.
In AVAX’s case, the metric has flipped a negative rate on Monday, indicating that shorts are paying longs. Historically, as shown in the chart below, when the funding rates have flipped from positive to negative, AVAX’s price has fallen sharply.
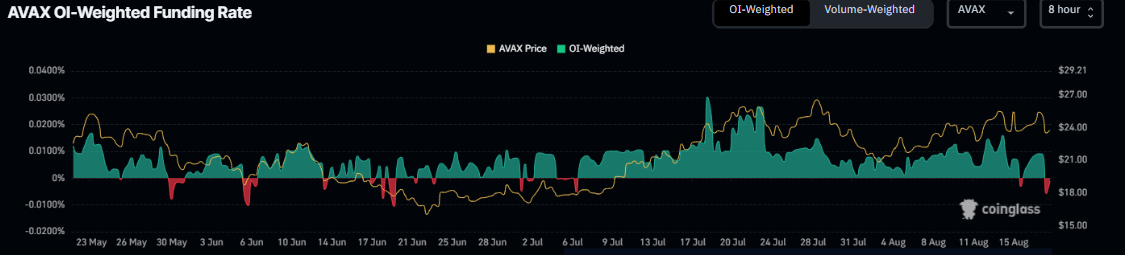
AVAX funding rate chart. Source: Coinglass
Coinglass’s long-to-short ratio of Avalanche further supports the bearish thesis. The ratio reads 0.84 on Tuesday, the lowest level in a month. This ratio, below one, reflects bearish sentiment in the markets, as more traders are betting on the asset price to fall.
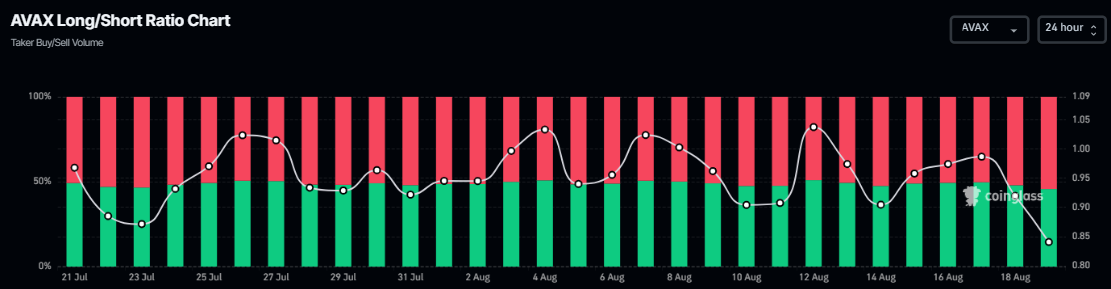
AVAX long-to-short chart. Source: Coinglass
CryptoQuant data, as shown in the graph below, also supports the bearish outlook. The Taker CVD (Cumulative Volume Delta) for AVAX has been negative and increasing, indicating the Taker Sell Dominant Phase, highlighting selling pressure.
 (2)-1755581879594-1755581879597.png)
Avalanche Spot Taker CVD chart. Source: CryptoQuant
Some sign of optimism
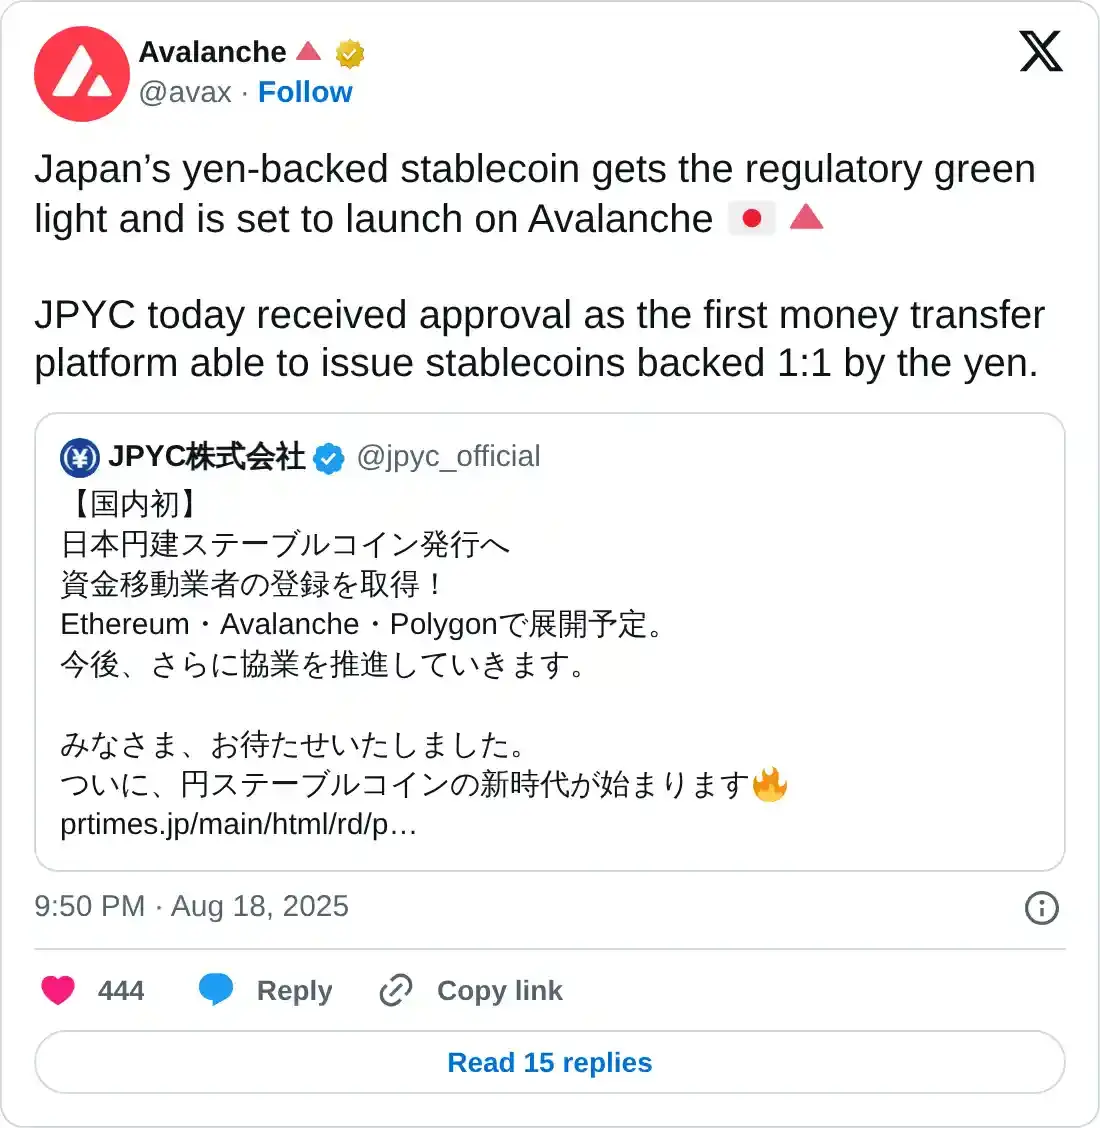
Despite a bearish outlook shown by derivatives and on-chain data, there are some signs of optimism for Avalanche. JPYC Co., Ltd. announced on Monday that it has become the first fund transfer company in Japan to issue stablecoins linked to the Japanese yen on a 1:1 basis.
The Japan yen-denominated stablecoin JPYC, which will be issued through this fund transfer business, is scheduled to be issued on three chains: Ethereum, Avalanche, and Polygon.
This is bullish news for Avalanche in the longer term, as the stablecoin launches on the AVAX blockchain could boost wider usage, utility, and adoption of its native token.
Avalanche Price Forecast: AVAX momentum indicators show weakness
Avalanche price faced a pullback on Monday and continues its decline when writing on Tuesday, approaching its 50-day Exponential Moving Average (EMA) at $22.74.
If AVAX closes below the $22.74 support level, it could extend the decline to test its weekly support at $20.99.
The Relative Strength Index (RSI) on the daily chart 48, slipping below its neutral level of 50, indicating bearish momentum is gaining traction. The MACD is also showing a bearish crossover on Tuesday, further supporting the bearish outlook.
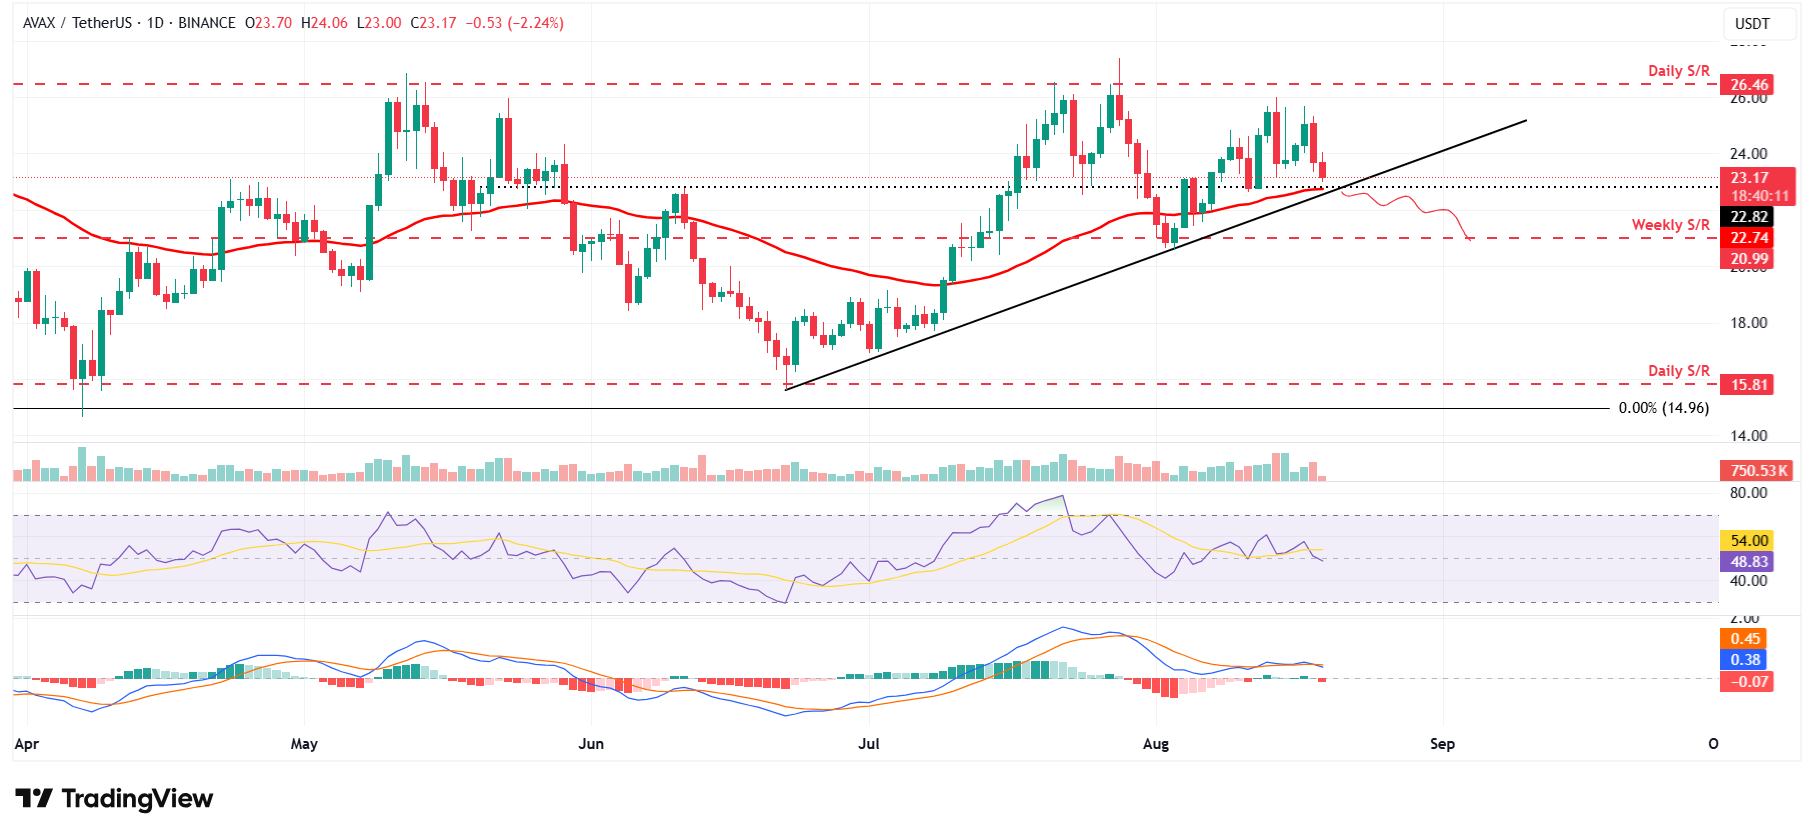
AVAX/USDT daily chart
However, if AVAX recovers, it could extend the recovery toward its next daily resistance at $26.46.

FXStreet
Oltre un milione di utenti si affida a FXStreet per dati di mercato in tempo reale, strumenti di charting, approfondimenti di esperti e notizie Forex. Il loro calendario economico completo e i webinar formativi aiutano i trader a rimanere informati e a prendere decisioni ponderate. FXStreet conta circa 60 professionisti tra la sede di Barcellona e diverse regioni globali.
Read More


