


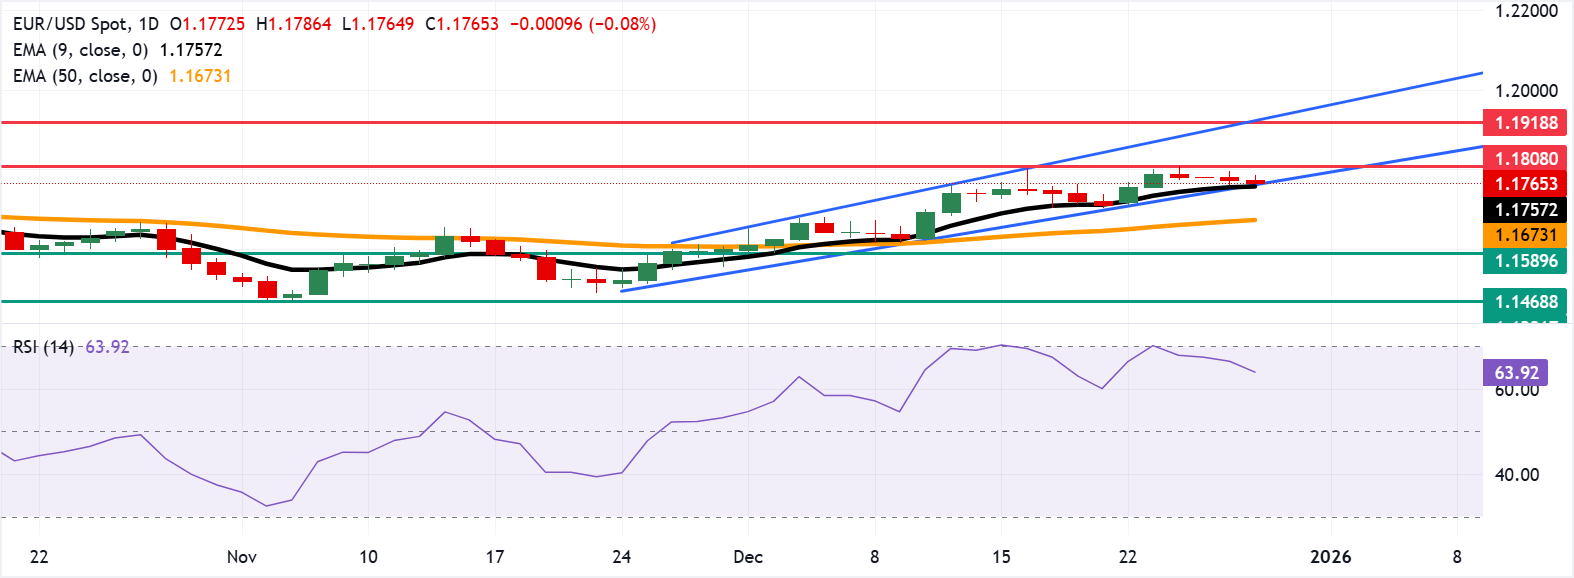
- EUR/USD may rise toward the psychological level of 1.1800.
- The 14-day Relative Strength Index holds above the midline, signaling buyer control.
- The pair tests the immediate support at the nine-day EMA of 1.1757.
EUR/USD loses ground for the fourth consecutive session, trading around 1.1760 during the Asian hours on Monday. On the daily chart, technical analysis indicates a weakening bullish bias, as the pair tests to break below the lower boundary of the ascending channel pattern.
Additionally, the 14-day Relative Strength Index (RSI) at 63.92 remains constructive above its midline, though it has eased from recent overbought readings. RSI stays elevated, indicating buyers remain in control even as momentum cools from prior peaks.
The nine-day Exponential Moving Average (EMA) rises above the 50-day EMA, reinforcing a bullish bias. The EUR/USD pair holds above both averages, keeping the short-term uptrend intact. The moving average structure continues to favor the topside, with the upward-sloping nine-day EMA acting as dynamic support and the 50-day EMA underpinning the broader climb. A sustained hold above the faster average would keep the path of least resistance higher.
The EUR/USD pair could target the psychological level of 1.1800, followed by the three-month high of 1.1808, which was recorded on December 24. Further advances above this confluence resistance area would open the doors toward the 1.1918, the highest level since June 2021, followed by the upper boundary of the ascending channel around 1.1930.
On the downside, the EUR/USD pair could find its immediate support at the nine-day EMA of 1.1757, aligned with the lower ascending channel boundary. A break below the channel would undermine short-term momentum, exposing the pair to a test of the 50-day EMA at 1.1673. Further downside could see prices retest the three-week low at 1.1589, set on December 1.
Euro Price Today
The table below shows the percentage change of Euro (EUR) against listed major currencies today. Euro was the weakest against the Australian Dollar.
| USD | EUR | GBP | JPY | CAD | AUD | NZD | CHF | |
|---|---|---|---|---|---|---|---|---|
| USD | 0.12% | 0.11% | -0.11% | 0.00% | -0.11% | 0.17% | 0.11% | |
| EUR | -0.12% | -0.04% | -0.22% | -0.15% | -0.25% | 0.03% | -0.03% | |
| GBP | -0.11% | 0.04% | -0.19% | -0.11% | -0.22% | 0.06% | 0.00% | |
| JPY | 0.11% | 0.22% | 0.19% | 0.07% | -0.01% | 0.25% | 0.15% | |
| CAD | -0.00% | 0.15% | 0.11% | -0.07% | -0.11% | 0.17% | 0.11% | |
| AUD | 0.11% | 0.25% | 0.22% | 0.01% | 0.11% | 0.28% | 0.22% | |
| NZD | -0.17% | -0.03% | -0.06% | -0.25% | -0.17% | -0.28% | -0.06% | |
| CHF | -0.11% | 0.03% | -0.00% | -0.15% | -0.11% | -0.22% | 0.06% |
The heat map shows percentage changes of major currencies against each other. The base currency is picked from the left column, while the quote currency is picked from the top row. For example, if you pick the Euro from the left column and move along the horizontal line to the US Dollar, the percentage change displayed in the box will represent EUR (base)/USD (quote).
(The technical analysis of this story was written with the help of an AI tool.)


