
Trade The World
Litecoin Price Forecast: LTC steadies after sharp drop, eyes recovery
Di Manish Chhetri
Data di Pubblicazione: 24 Sep 2025 | Data di Modifica: 24 Sep 2025


POPULAR ARTICLES

Litecoin (LTC) price is attempting to recover, trading above $106 at the time of writing on Wednesday after starting the week on a bearish note. Supply distribution data shows that a certain whale seized the opportunity and accumulated Litecoin during recent price dips.
- Litecoin price shows signs of stabilization on Wednesday, after sliding more than 7% at the start of the week.
- On-chain supply distribution data indicate that certain whales accumulated during the recent dip.
- The technical outlook suggests a potential bounce if the key support zone remains intact.
Litecoin (LTC) price is attempting to recover, trading above $106 at the time of writing on Wednesday after starting the week on a bearish note. Supply distribution data shows that a certain whale seized the opportunity and accumulated Litecoin during recent price dips. Meanwhile, the technical analysis suggests LTC could stage a rebound as long as its key support zone holds firm.
LTC whale bought the recent price dips
Santiment’s Supply Distribution data supports a bullish outlook for Litecoin. The metric indicates that whales holding between 100,000 and 1 million LTC tokens (red line) have accumulated 660,000 tokens since September 20. During the same period, wallets holding between 1 million and 10 million LTC tokens (yellow line) have shed 580,000 tokens.
This shows that the second cohort of whales could have fallen prey to the capitulation event. In contrast, the first set of wallets seized the opportunity and accumulated Litecoin at a discount.
 [12-1758701284138-1758701284140.52.29, 24 Sep, 2025].png)
LTC supply distribution metric chart. Source: Santiment
Examining Santiments’ Age Consumed index also shows bullish signs. The spikes in this index suggest dormant tokens (tokens stored in wallets for a long time) are in motion, and it can be used to spot short-term local tops or bottoms.
As in the case of Litecoin, history shows that a rally followed the spikes in LTC’s price as holders moved tokens from exchanges to wallets, thereby decreasing the selling pressure. The most recent uptick on Wednesday forecasts that LTC is ready for an uptrend.
 [11-1758701320726-1758701320727.02.05, 24 Sep, 2025].png)
LTC Age Consumed index chart. Source: Santiment
Litecoin Price Forecast: LTC could rebound if the support zone holds
Litecoin price faced rejection at the start of this week and declined over 7% on Monday, closing below the 61.8% Fibonacci retracement level at $107.09 (drawn from the April low of $63.08 to the August high of $134.29). However, LTC recovered slightly on Tuesday after retesting the 200-day Exponential Moving Average (EMA) at $103.24.
The 200-day EMA roughly coincides with other key levels, making this a significant support zone for a key reversal.
- The volume profile POC (Point of Control) is at $102.62, the price level with the highest traded volume since November 2024.
- The 50% Fibonacci retracement level is at $98.68.
- The ascending trendline (drawn by connecting multiple lows since early April).
At the time of writing on Wednesday, LTC continues to recover, trading around $106.
If LTC continues to hold above the above-mentioned support zone, it could extend the rally toward the next resistance at $130.
However, the Relative Strength on the daily chart reads 39, indicating that the bears are still in control of the momentum. For the recovery rally to be sustained, the RSI must move above the neutral level of 50.
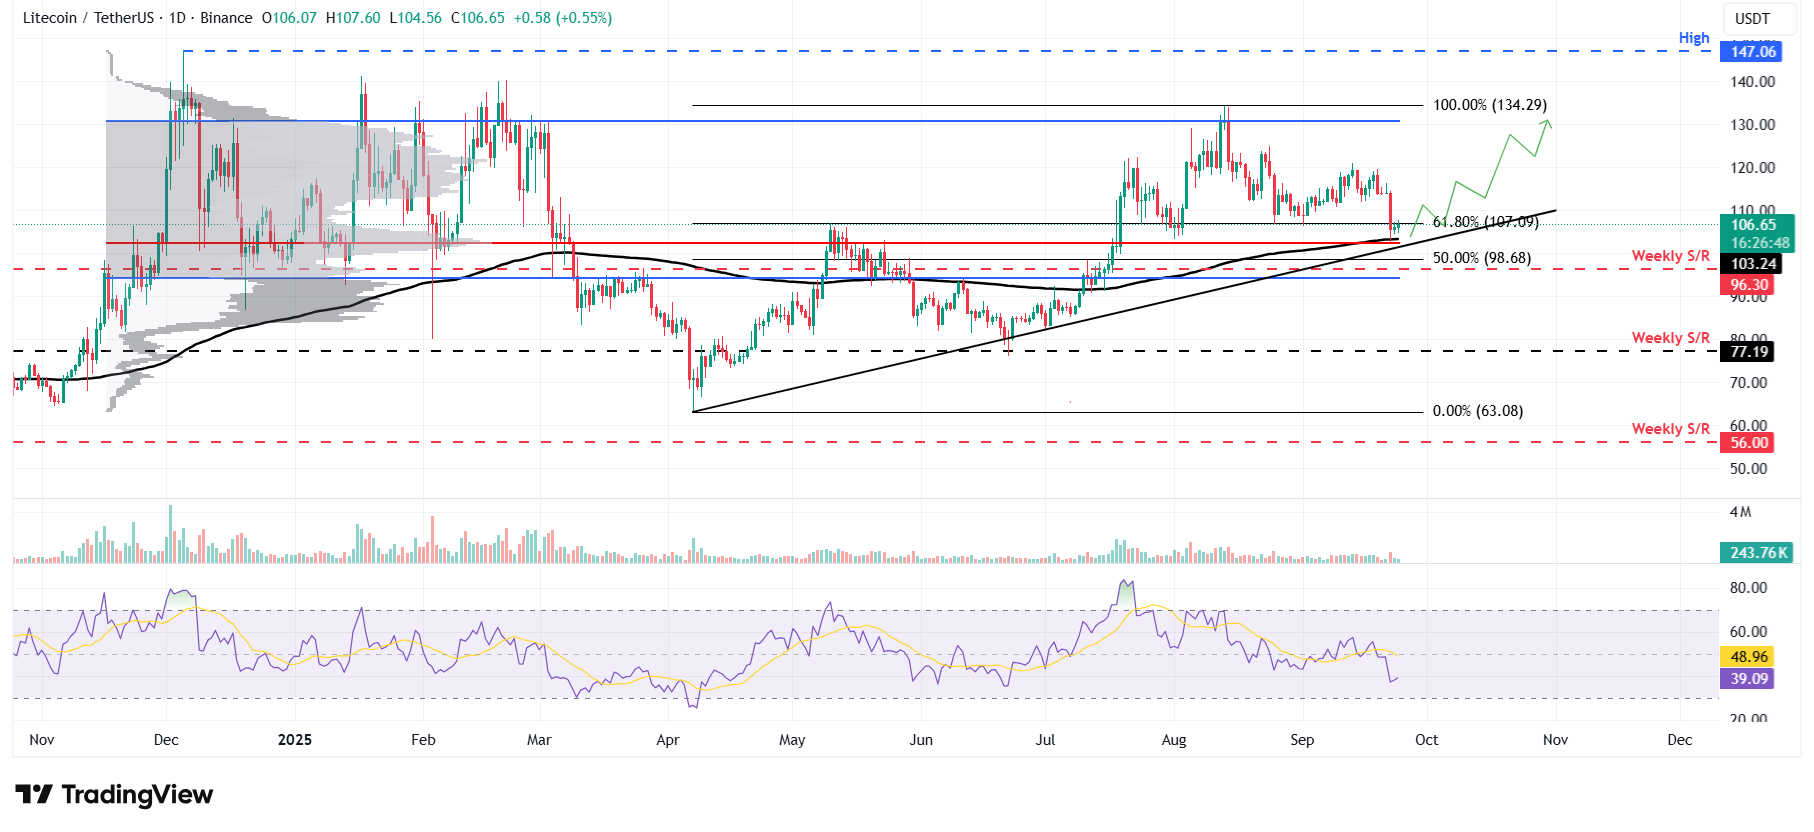
LTC/USDT daily chart
However, if LTC corrects and closes below the 50% Fibonacci retracement level at $98.68, it could extend the decline toward the weekly support level at $96.30.

FXStreet
Oltre un milione di utenti si affida a FXStreet per dati di mercato in tempo reale, strumenti di charting, approfondimenti di esperti e notizie Forex. Il loro calendario economico completo e i webinar formativi aiutano i trader a rimanere informati e a prendere decisioni ponderate. FXStreet conta circa 60 professionisti tra la sede di Barcellona e diverse regioni globali.
Read More


