
Trade The World
Solana-based meme coins PENGU, FARTCOIN, and BONK target key breakouts amid bullish momentum
Di Vishal Dixit
Data di Pubblicazione: 9 Sep 2025 | Data di Modifica: 9 Sep 2025


POPULAR ARTICLES
Solana-based meme coins such as Pudgy Penguins’ token PENGU, Fartcoin (FARTCOIN), and Bonk (BONK) are a few of the top-performing coins on the broader cryptocurrency market.
- Pudgy Penguins’ token PENGU aims to break out of a falling channel pattern to extend gains.
- Fartcoin’s wedge breakout rally gains traction amid an opposing Death Cross pattern.
- Bonk exceeds the 50-day EMA, targeting a crucial resistance breakout for further recovery.
Solana-based meme coins such as Pudgy Penguins’ token PENGU, Fartcoin (FARTCOIN), and Bonk (BONK) are a few of the top-performing coins on the broader cryptocurrency market. The rising social chatter surrounding the Solana-based meme coins, combined with the technical outlook, suggests a potential extension of the uptrend.
Rising demand for Solana-based meme coins
Santiment’s data shows a surge in social volume and social dominance of the Solana-based meme coins, reaching 85 and 0.15% respectively on Monday. The sudden spike aligns with the broader market recovery, indicating a rise in risk-on sentiment among investors.
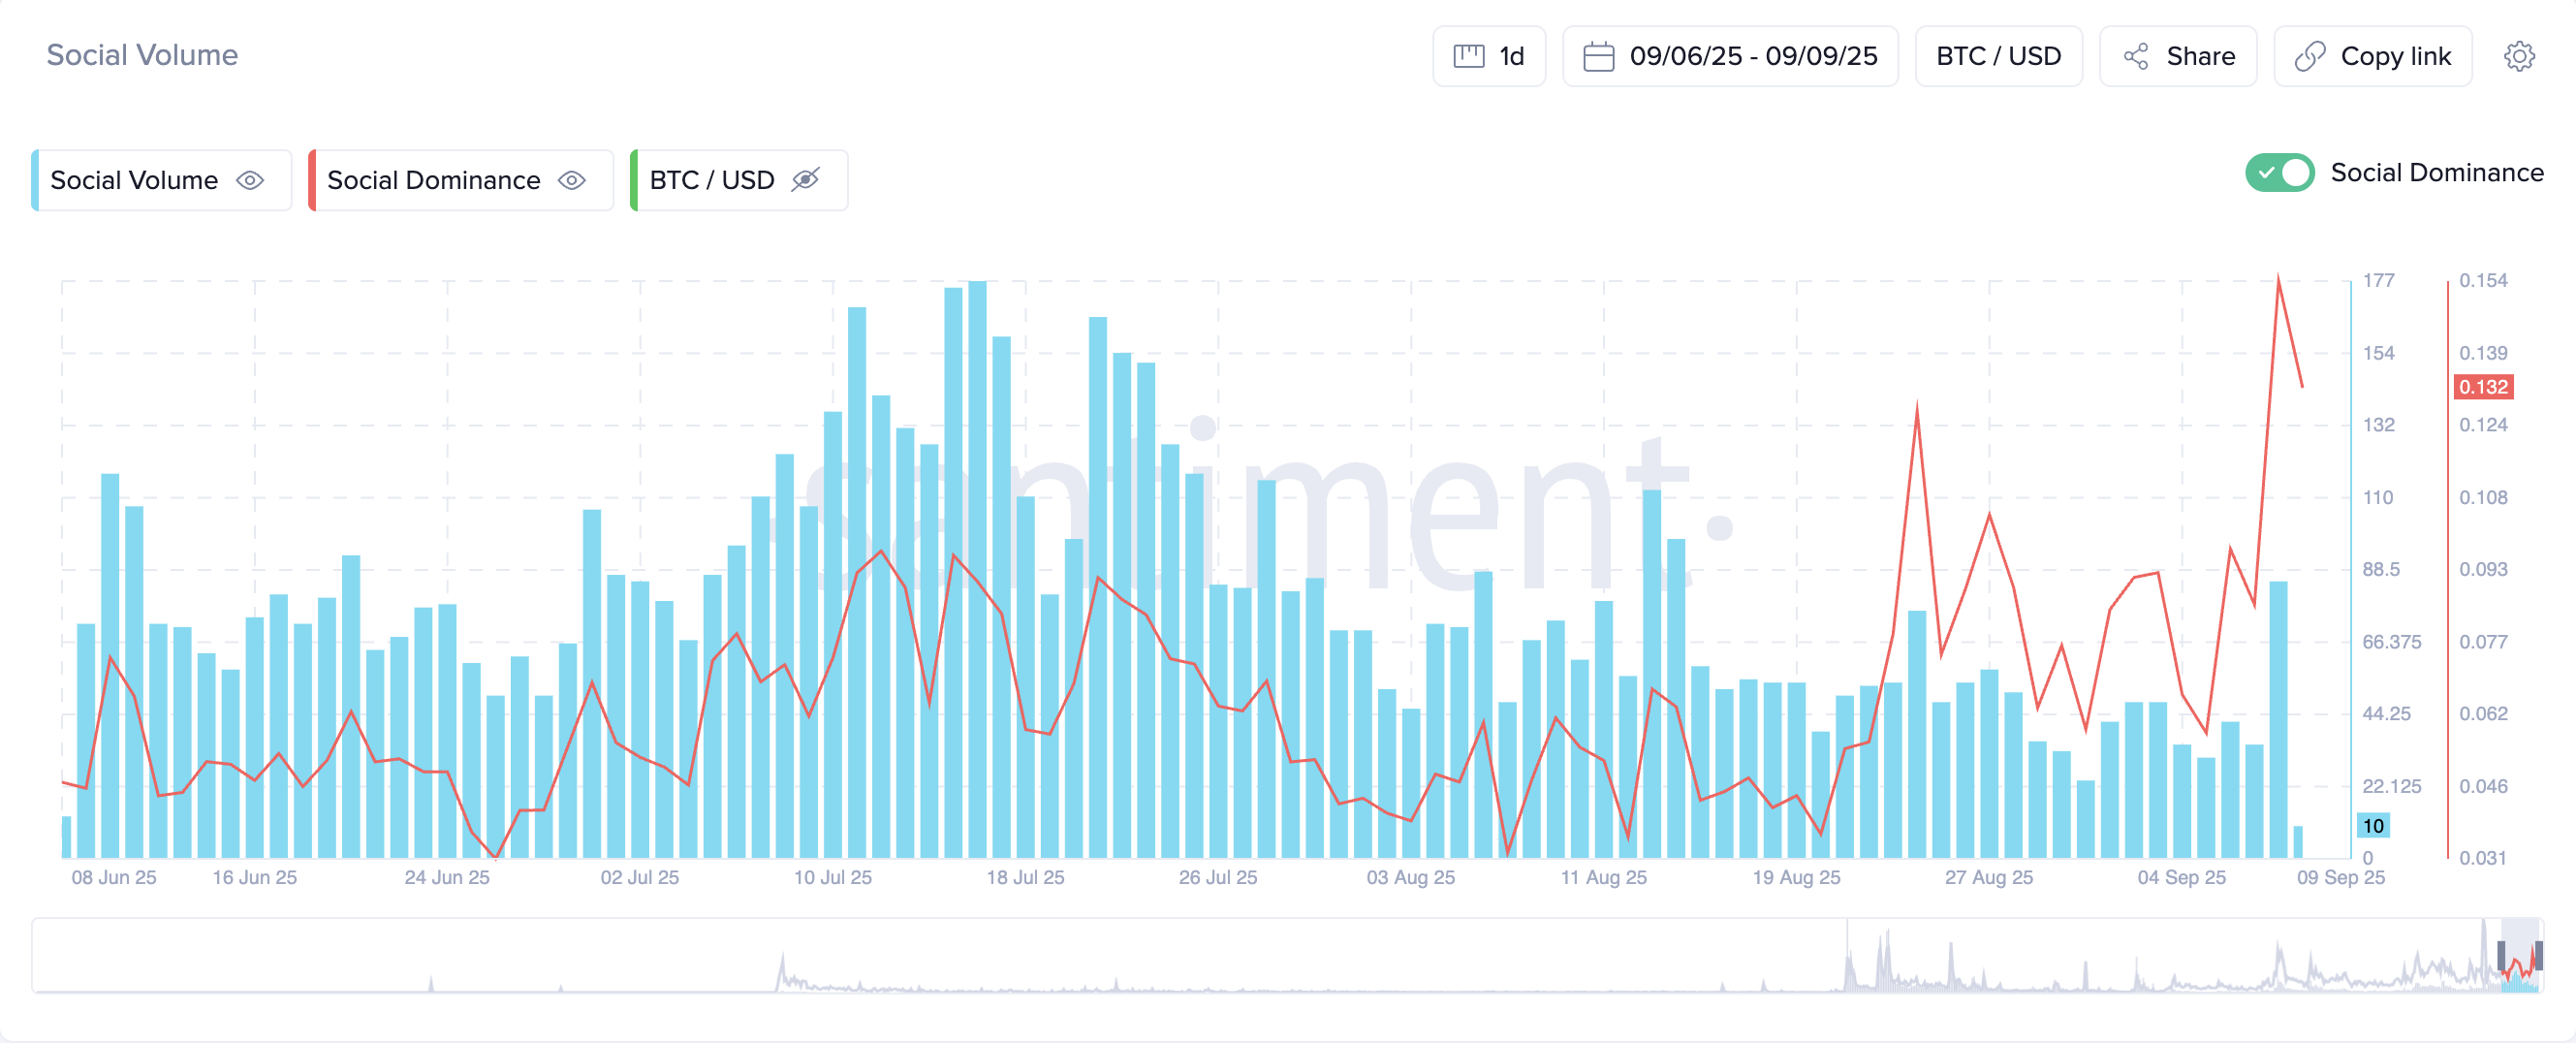
Social Volume. Source: Santiment
Adding to the risk-on sentiment, CoinGlass data shows the Open Interest (OI) of FARTCOIN, PENGU, and BONK has increased by nearly 1%, 15% and 6%, respectively. Notably, despite a spike in trading volumes, the long/short ratio still remains under 1, indicating a bearish imbalance in active derivatives contracts.
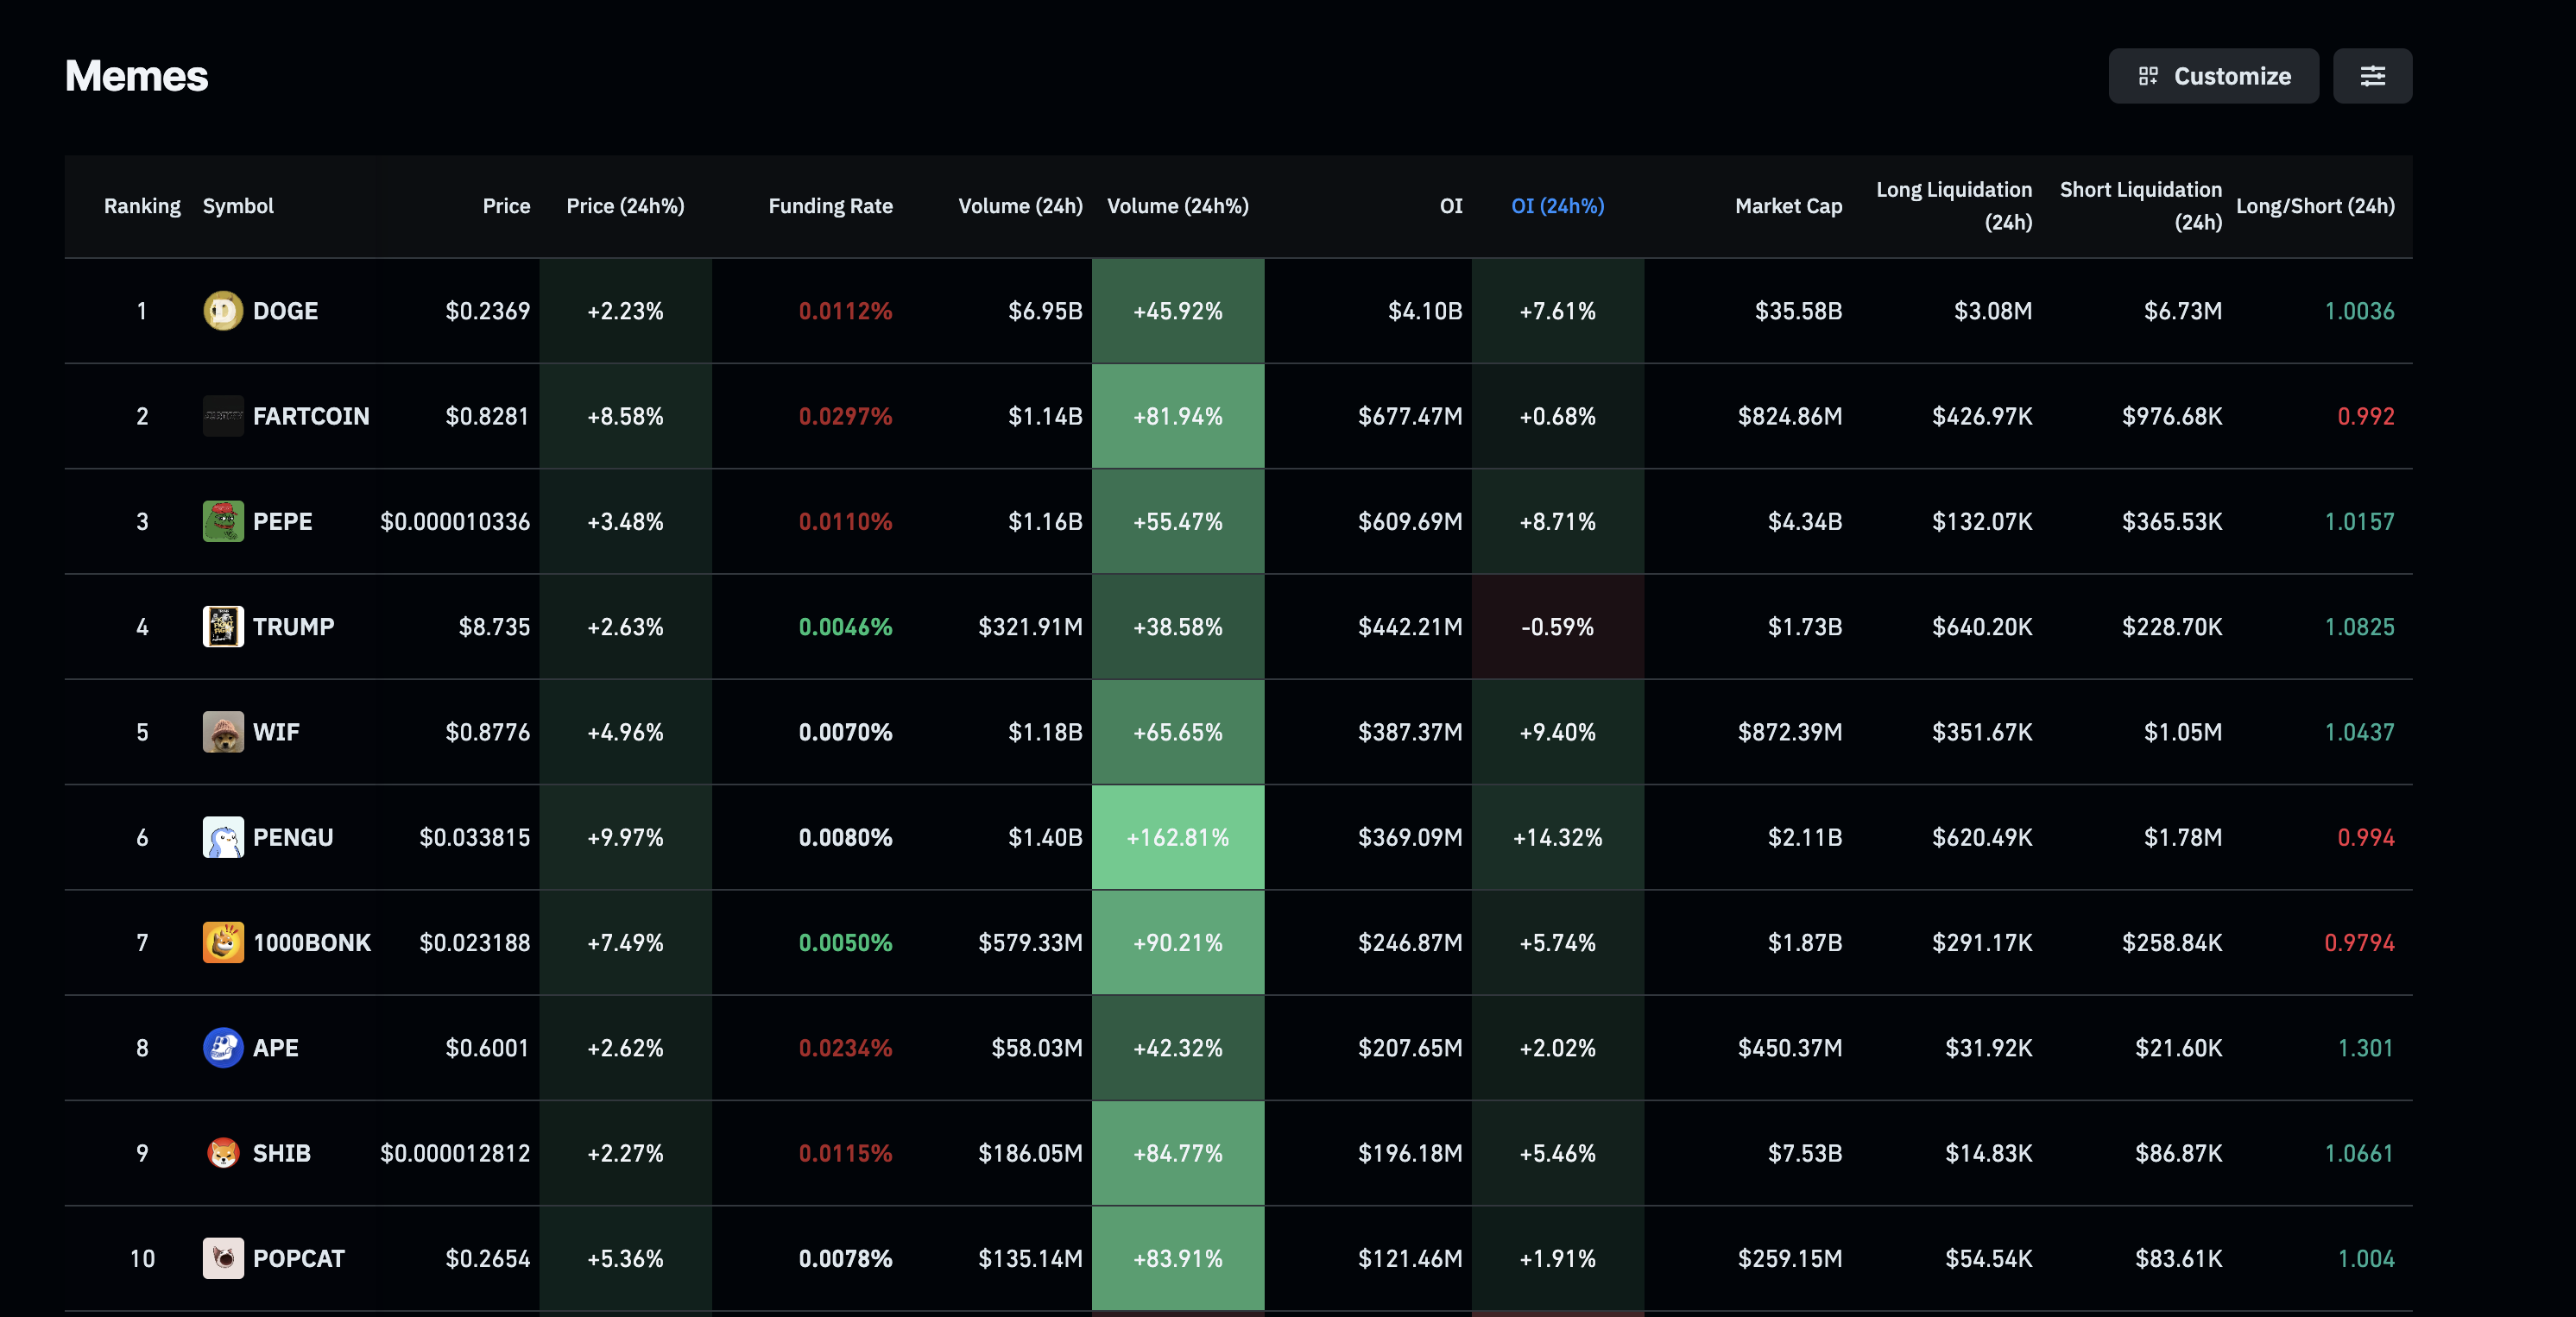
Open Interest. Source: CoinGlass
PENGU nears channel breakout to extend the rally
Pudgy Penguins is an Ethereum-based Non-Fungible Token (NFT) project with a Solana-based PENGU token. PENGU trades above $0.03000 at press time on Tuesday, challenging the overhead resistance trendline of a falling channel pattern on the daily chart.
A decisive close above the Monday high at $0.03464 would confirm the channel breakout, potentially targeting the R1 pivot resistance at $0.03774.
The Moving Average Convergence Divergence (MACD) indicator on the daily chart flashes a surge in bullish momentum with a rise in green histogram bars from the zero line. An uptrend in the MACD and signal line following the crossover on Saturday would trigger a buy signal once it crosses above the zero line.
Additionally, the Relative Strength Index (RSI) on the same chart at 55 hovers above the halfway line, indicating a bullish tilt in trend.
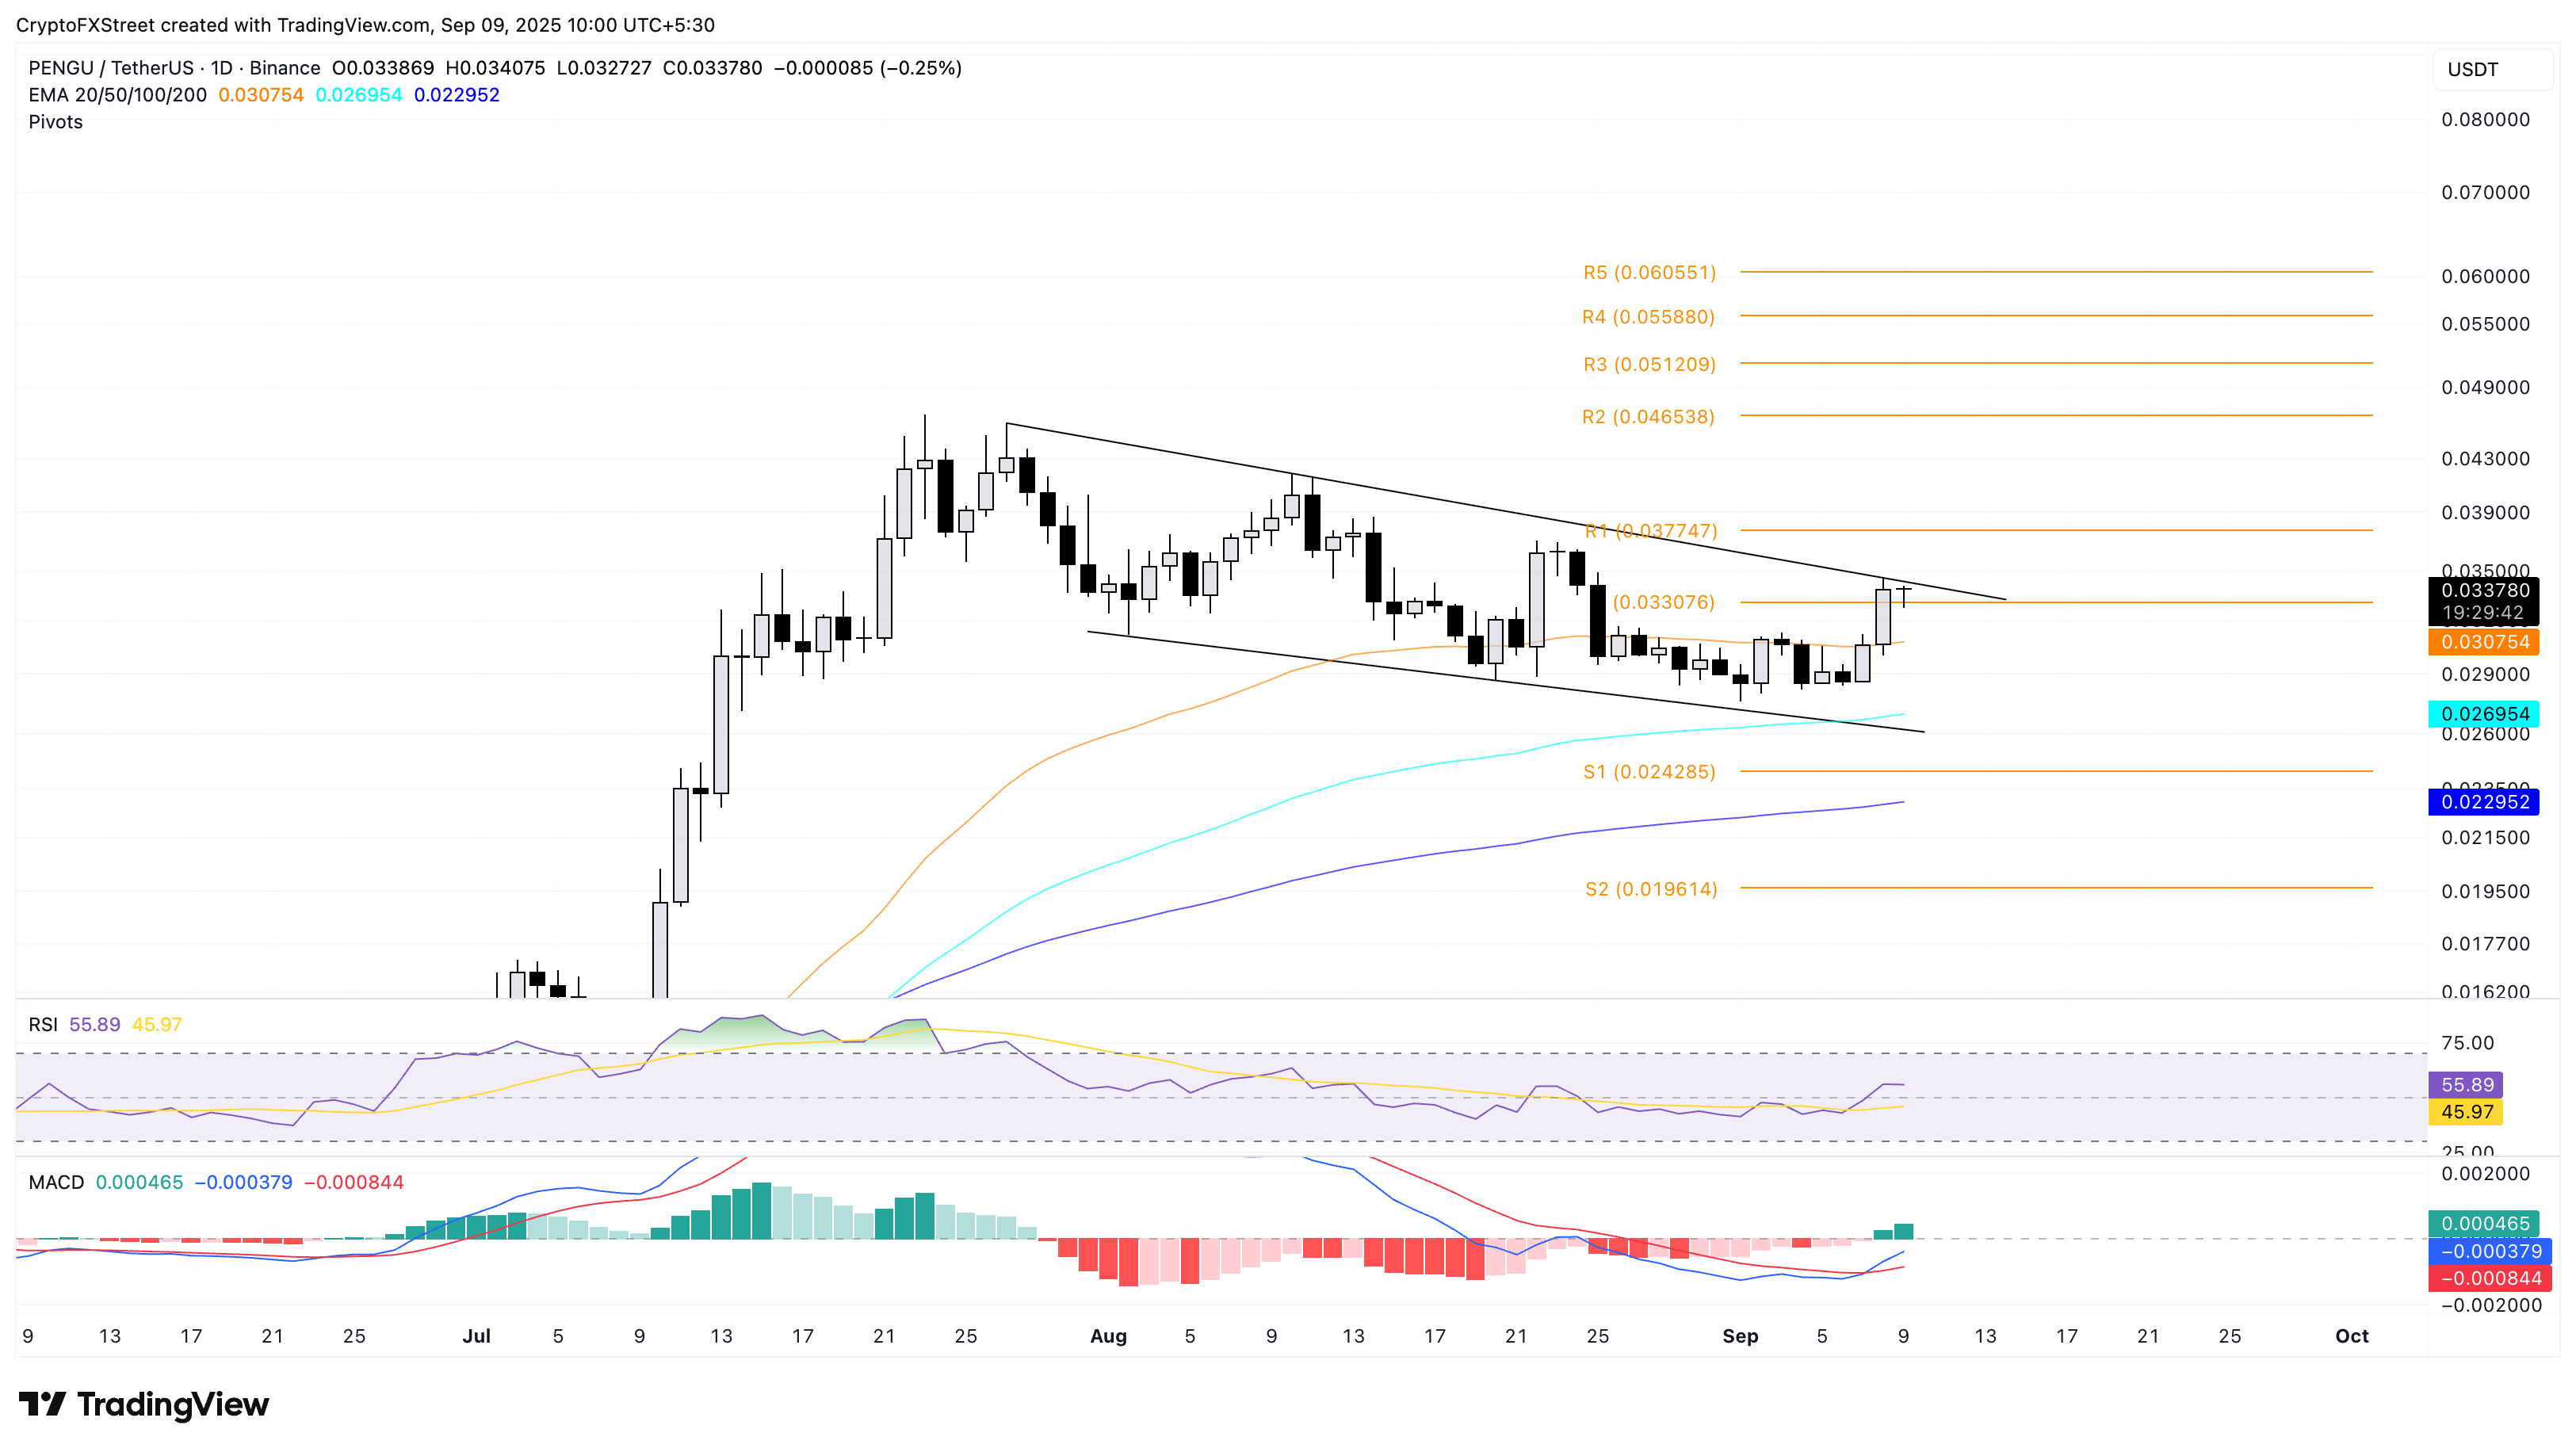
PENGU/USDT daily price chart.
However, a reversal from the resistance trendline could result in a retest of the 50-day Exponential Moving Average (EMA) at $0.03075.
FARTCOIN targets $0.88 as bullish momentum builds
FARTCOIN trades above the $0.80 level at press time on Tuesday, adding to the 8% gains from Monday. The meme coin confirmed the breakout of a falling wedge pattern on the daily chart with Monday’s recovery.
The breakout rally targets the centre pivot level at $0.88, which is acting as the immediate resistance. A positive close above this level could extend the rally to the 50-day EMA at $0.92.
Notably, the declining 50-day EMA has crossed below the 200-day EMA, signaling a Death Cross pattern, which indicates that the short-term downtrend has outpaced the prevailing longer-term trend.
Still, the momentum indicators uphold a bullish bias as the MACD and signal line on the daily chart rise towards the zero line following the crossover on Sunday.
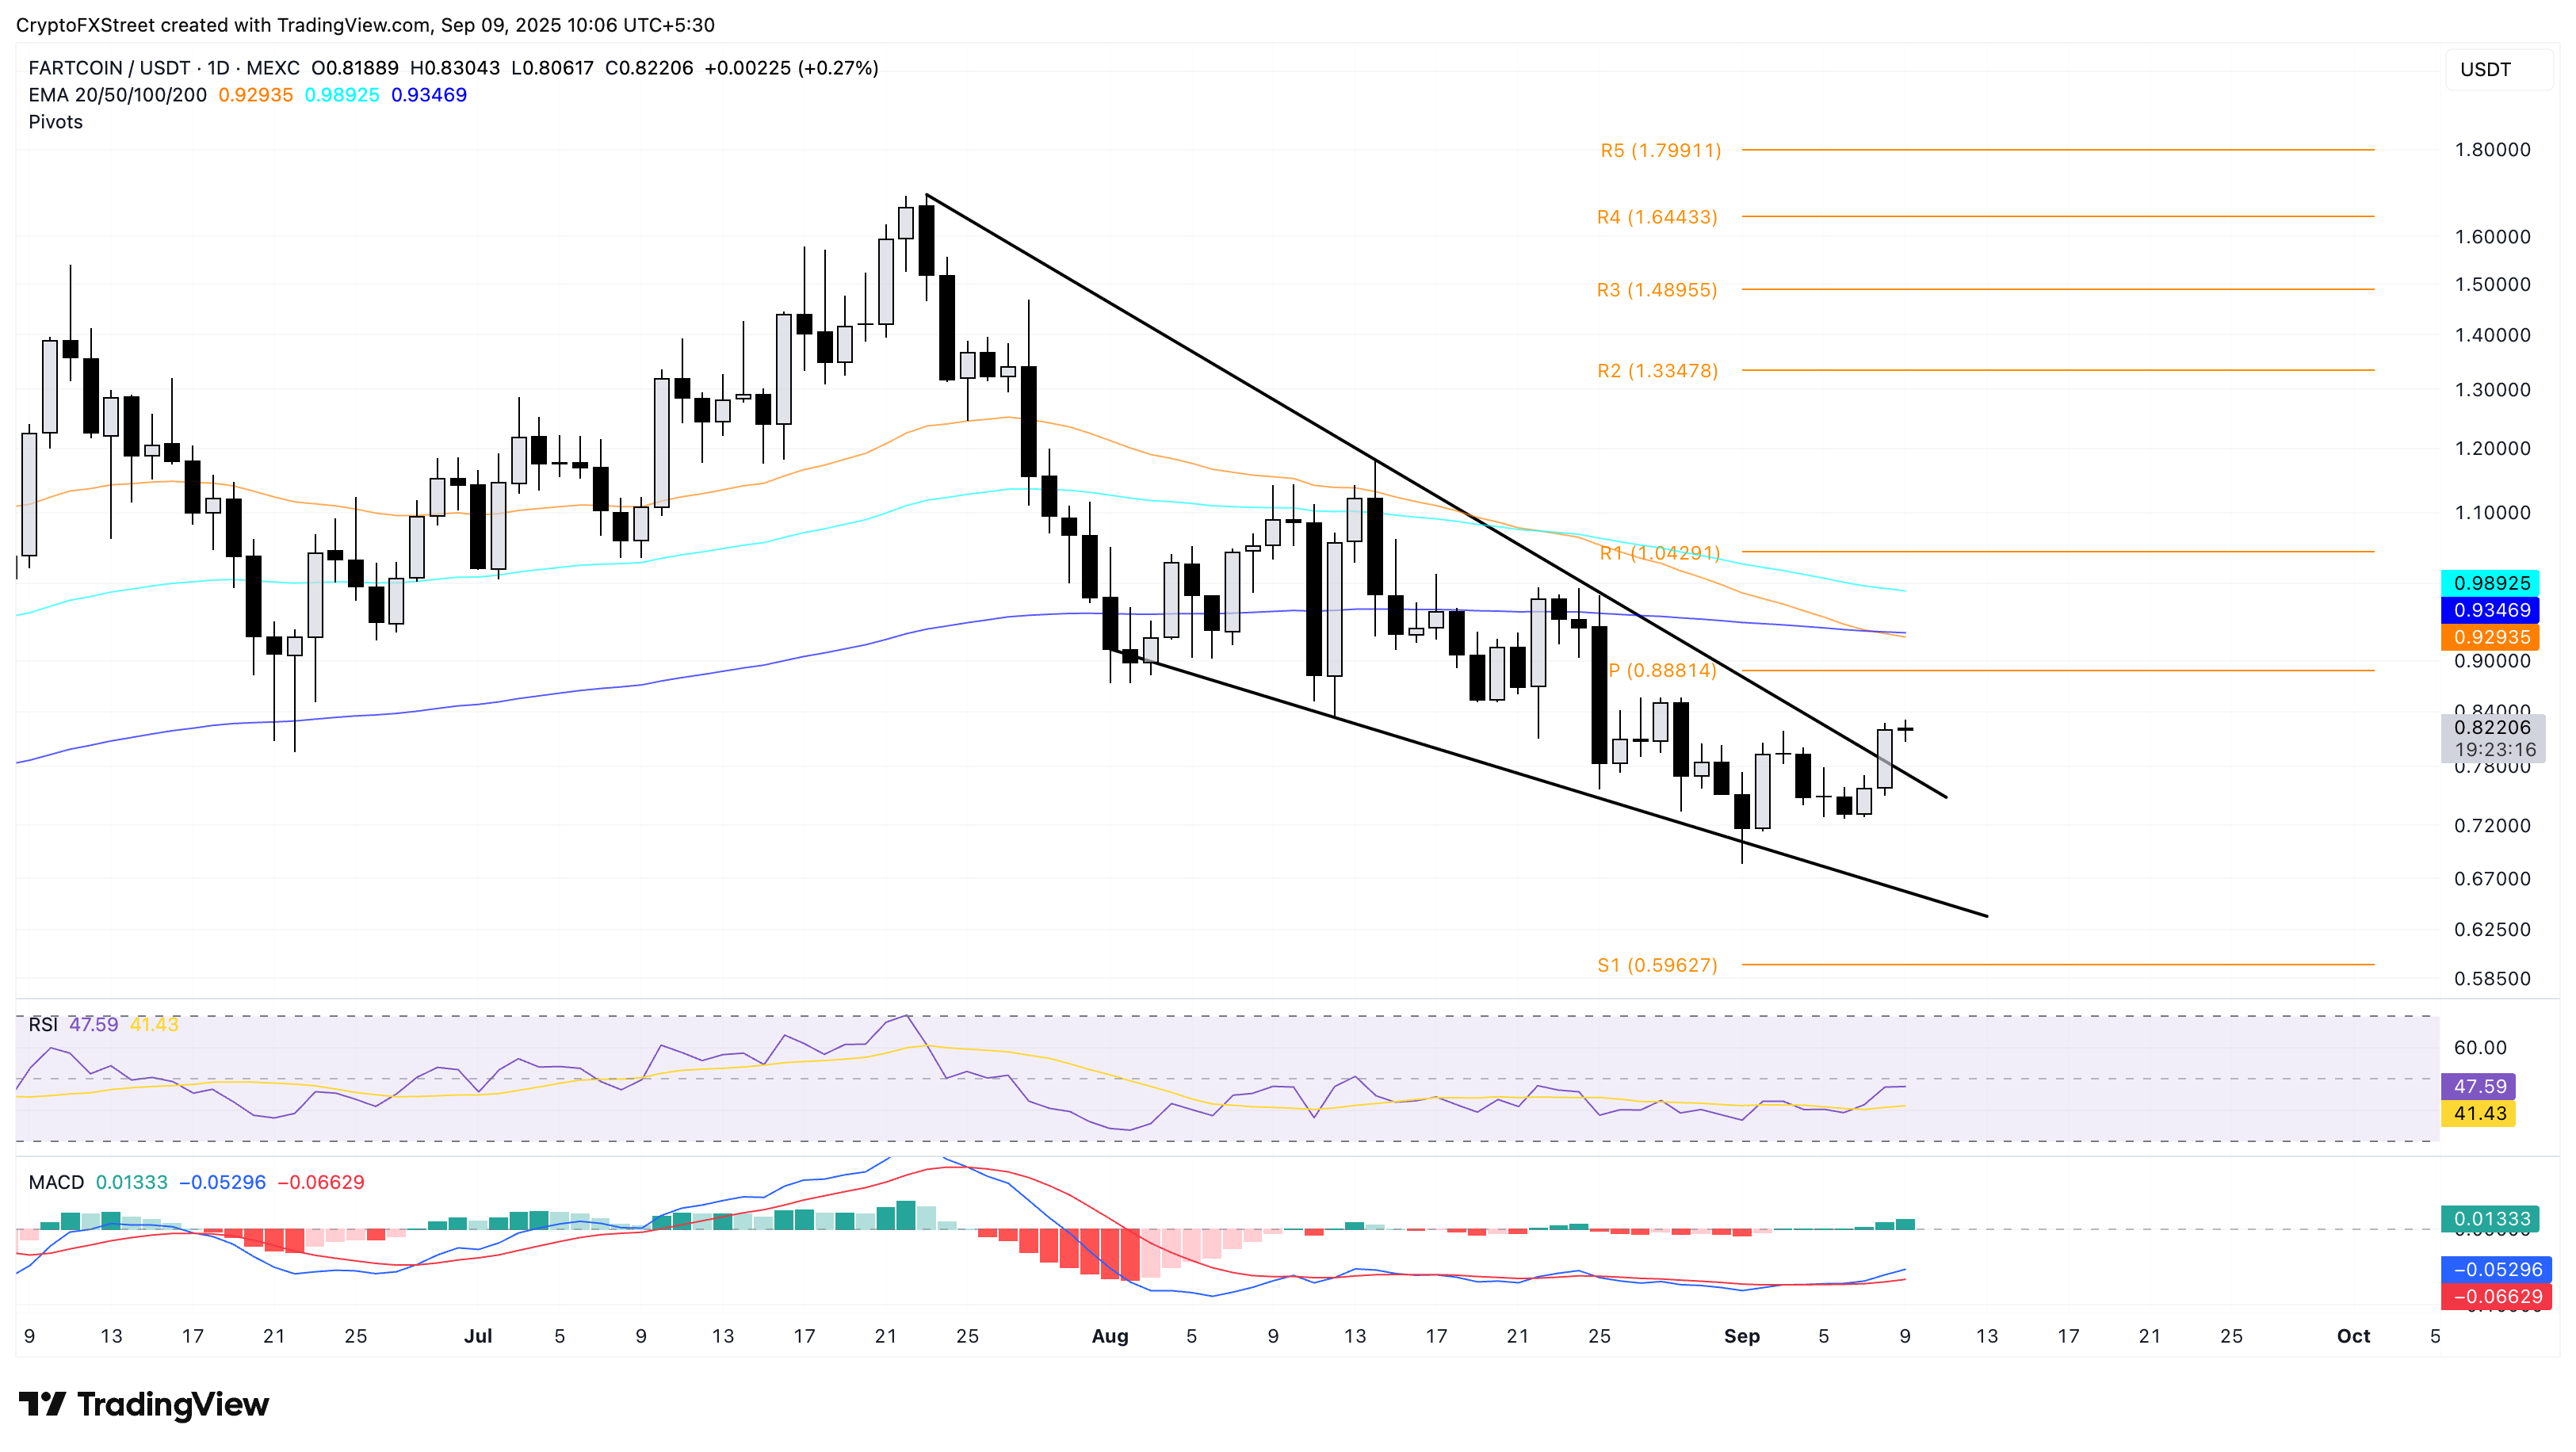
FARTCOIN/USDT daily price chart.
On the downside, a failure to sustain the uptrend could result in a retest of the broken resistance trendline at $0.77.
BONK aims to expand the wedge breakout rally
BONK edges lower by nearly 1% at the time of writing on Tuesday, following the 10% surge on the previous day. The 50% Fibonacci retracement level at $0.00002350 is drawn from the high of $0.00006230 on November 20, 2024, to the low of $0.00000886 on April 7, 2025, and acts as the overhead resistance.
A decisive close above this level could extend the uptrend to the 61.8% Fibonacci level at $0.00002958.
The RSI indicator on the same chart has surpassed the halfway line, currently at 53, suggesting a bullish shift in trend momentum. Adding to the bullish shift, the MACD extends an uptrend following a crossover above its signal line on Sunday.
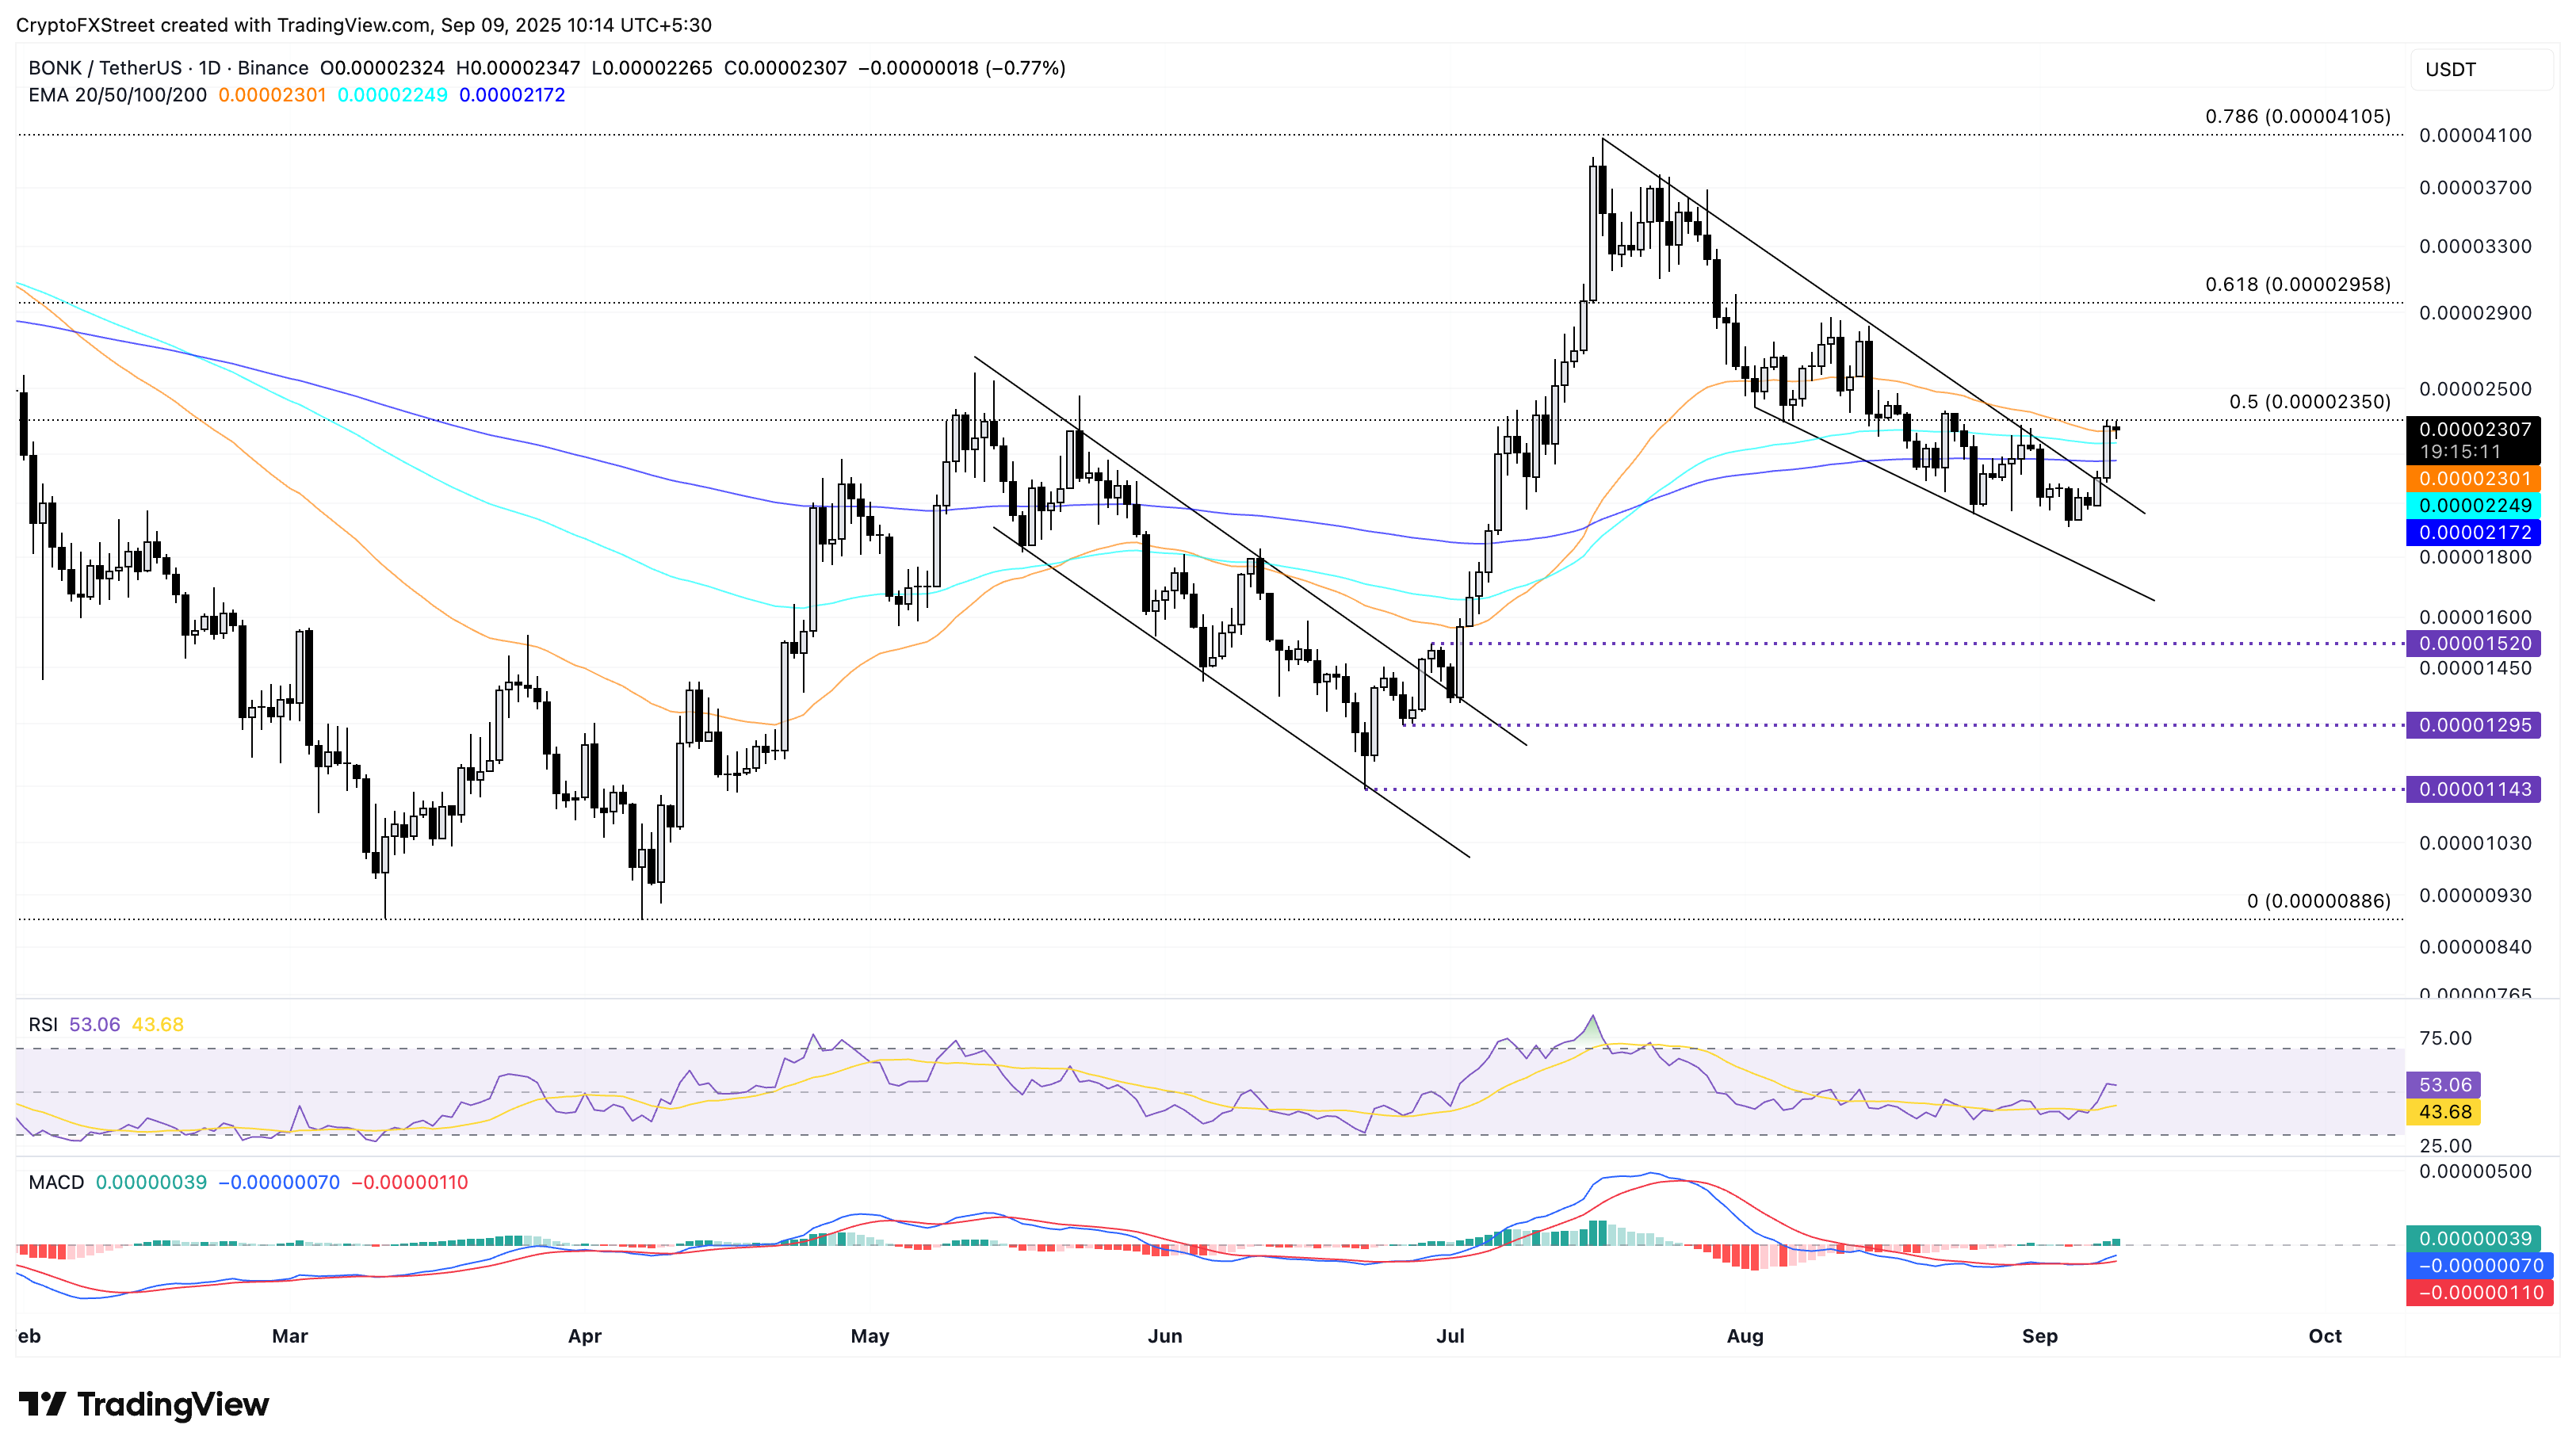
BONK/USDT daily price chart.
If BONK reverses from the $0.00002350 resistance, it could retest the 100-day EMA at $0.00002249.

FXStreet
Oltre un milione di utenti si affida a FXStreet per dati di mercato in tempo reale, strumenti di charting, approfondimenti di esperti e notizie Forex. Il loro calendario economico completo e i webinar formativi aiutano i trader a rimanere informati e a prendere decisioni ponderate. FXStreet conta circa 60 professionisti tra la sede di Barcellona e diverse regioni globali.
Read More


