
Trade The World
Stellar Price Forecast: XLM eyes breakout as TVL hits record $169 million
Di Manish Chhetri
Data di Pubblicazione: 25 Nov 2025 | Data di Modifica: 25 Nov 2025


POPULAR ARTICLES

Stellar (XLM) price is approaching its key resistance level around $0.256 at the time of writing on Tuesday, after gaining over 10% in the previous two days.
- Stellar price nears its key resistance at $0.256 on Tuesday after gaining over 10% in the last two days.
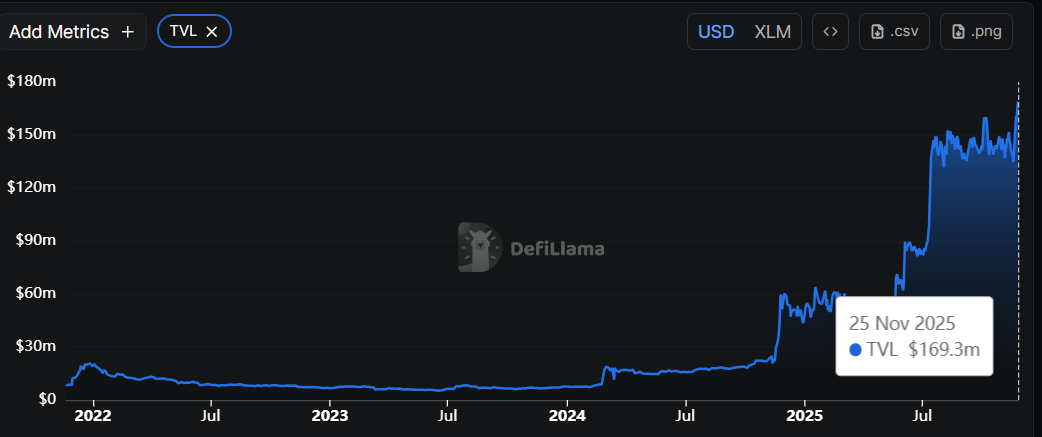
- On-chain data paints a bullish picture, with XLM’s TVL reaching a record $169.3 million, reflecting growing ecosystem activity.
- The technical outlooks suggest upside if XLM closes above the $0.256 resistance zone.
Stellar (XLM) price is approaching its key resistance level around $0.256 at the time of writing on Tuesday, after gaining over 10% in the previous two days. Meanwhile, the network’s Total Value Locked (TVL) has climbed to a record high, highlighting growing ecosystem activity and bolstering bullish sentiment. On the technical side, if XLM closes above $0.256 resistance zone, it could trigger a further upside rally.
Stellar’s TVL hits a new record high
Data from crypto intelligence tracker DefiLlama shows that XLM’s TVL has reached a new all-time high (ATH) of $169.30 million on Tuesday. This increase in TVL indicates growing activity and interest in Stellar’s ecosystem, suggesting that more users are depositing or using assets on XLM-based protocols, which aligns with XLM's price performance.
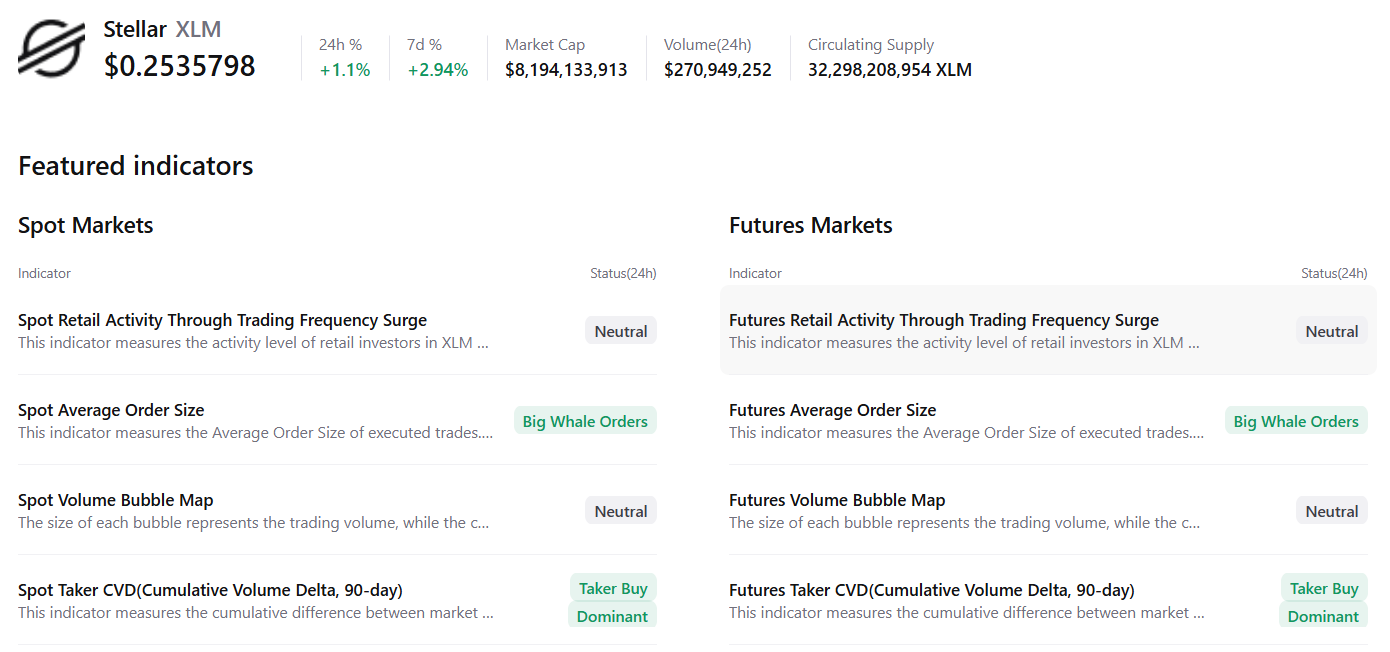
Additionally, CryptoQuant’s summary data also supports the positive outlook, as XLM’s spot and futures markets show large whale orders and buy dominance, signaling a potential rally ahead.
Stellar Price Forecast: XLM bulls aiming for a breakout
Stellar price retested and found support around the weekly support level at $0.221 on Friday, and rose over 10% in the next three days. At the time of writing on Tuesday, XLM is nearing the 38.20% Fibonacci retracement level (drawn from the October 6 high of $0.413 to the October 10 low of $0.160 ) at $0.256, which also coincides with the upper trendline of the falling wedge pattern, making a key resistance zone to watch.
If XLM breaks and closes above the $0.256 resistance level on a daily basis, it could extend the rally toward the 50-day Exponential Moving Average (EMA) at $0.292.
The Relative Strength Index (RSI) on the daily chart is 42, pointing upward toward the neutral 50 level, indicating fading bearish momentum. For the recovery rally to be sustained, the RSI must move above the neutral level. Additionally, the Moving Average Convergence Divergence (MACD) showed a bullish crossover on Monday, providing a buy signal and further supporting the bullish thesis.
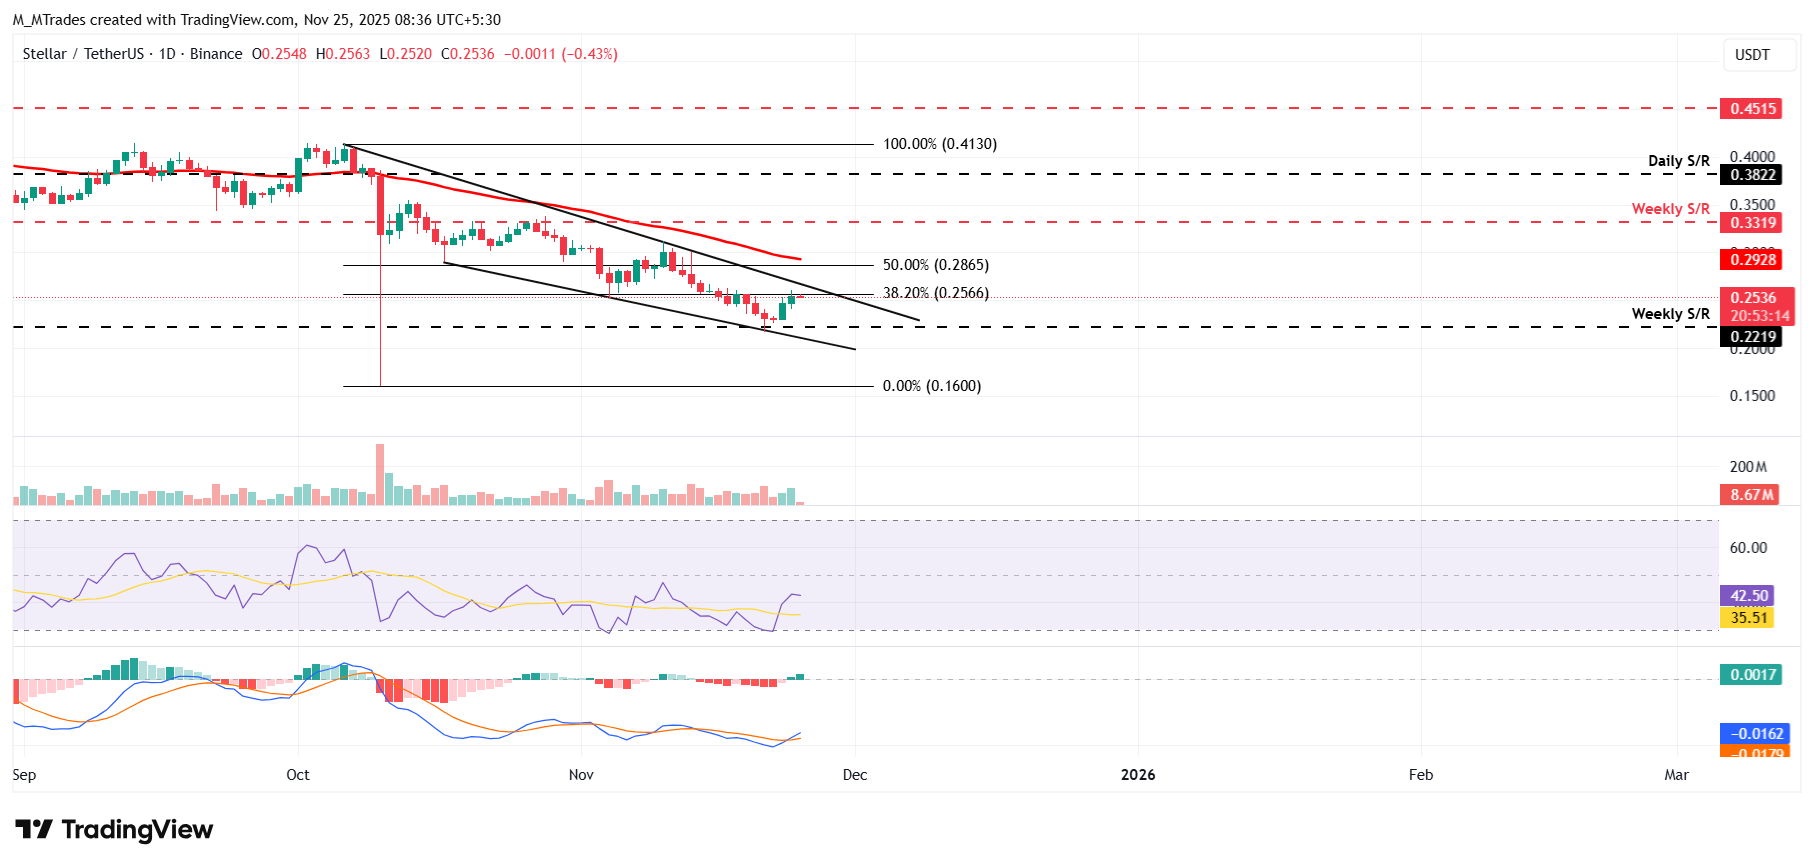
On the other hand, if XLM faces a correction, it could extend the decline toward the weekly support level at $0.221.

FXStreet
Oltre un milione di utenti si affida a FXStreet per dati di mercato in tempo reale, strumenti di charting, approfondimenti di esperti e notizie Forex. Il loro calendario economico completo e i webinar formativi aiutano i trader a rimanere informati e a prendere decisioni ponderate. FXStreet conta circa 60 professionisti tra la sede di Barcellona e diverse regioni globali.
Read More


