
Trade The World
Top 3 Price Prediction: Bitcoin, Ethereum, Ripple – BTC, ETH and XRP extend correction as bearish momentum builds
Di Manish Chhetri
Data di Pubblicazione: 17 Dec 2025 | Data di Modifica: 17 Dec 2025


POPULAR ARTICLES

Bitcoin (BTC), Ethereum (ETH), and Ripple (XRP) remain under pressure as the broader market continues its corrective phase into midweek.
- Bitcoin price finds support around the key level at $85,569, a firm close below suggests further correction.
- Ethereum price trades below $3,000 on Wednesday, extending its decline to four consecutive days.
- XRP momentum indicators are flashing early bearish signals, suggesting further downside risk ahead.
Bitcoin (BTC), Ethereum (ETH), and Ripple (XRP) remain under pressure as the broader market continues its corrective phase into midweek. The weak price action of these top three cryptocurrencies by market capitalization suggests a deeper correction, as momentum indicators are beginning to tilt bearish.
Bitcoin could extend its correction if it closes below $85,569
Bitcoin price was rejected from a descending trendline (drawn by connecting multiple highs since early October) on Friday and has declined nearly 7% since then, retesting the $85,569 support level on Monday. However, BTC rebounded slightly on Tuesday after finding support at $85,569. At the time of writing on Wednesday, BTC hovers at around $87,300.
If BTC continues its correction and closes below $85,569 on a daily basis, which aligns with the 78.6% Fibonacci retracement, it could extend the decline toward the psychological $80,000 level.
The Relative Strength Index (RSI) on the daily chart is at 40, below its neutral level of 50, indicating bearish momentum gaining traction. Moreover, the Moving Average Convergence Divergence (MACD) lines are converging, and a flip to a bearish crossover would further support the bearish outlook.
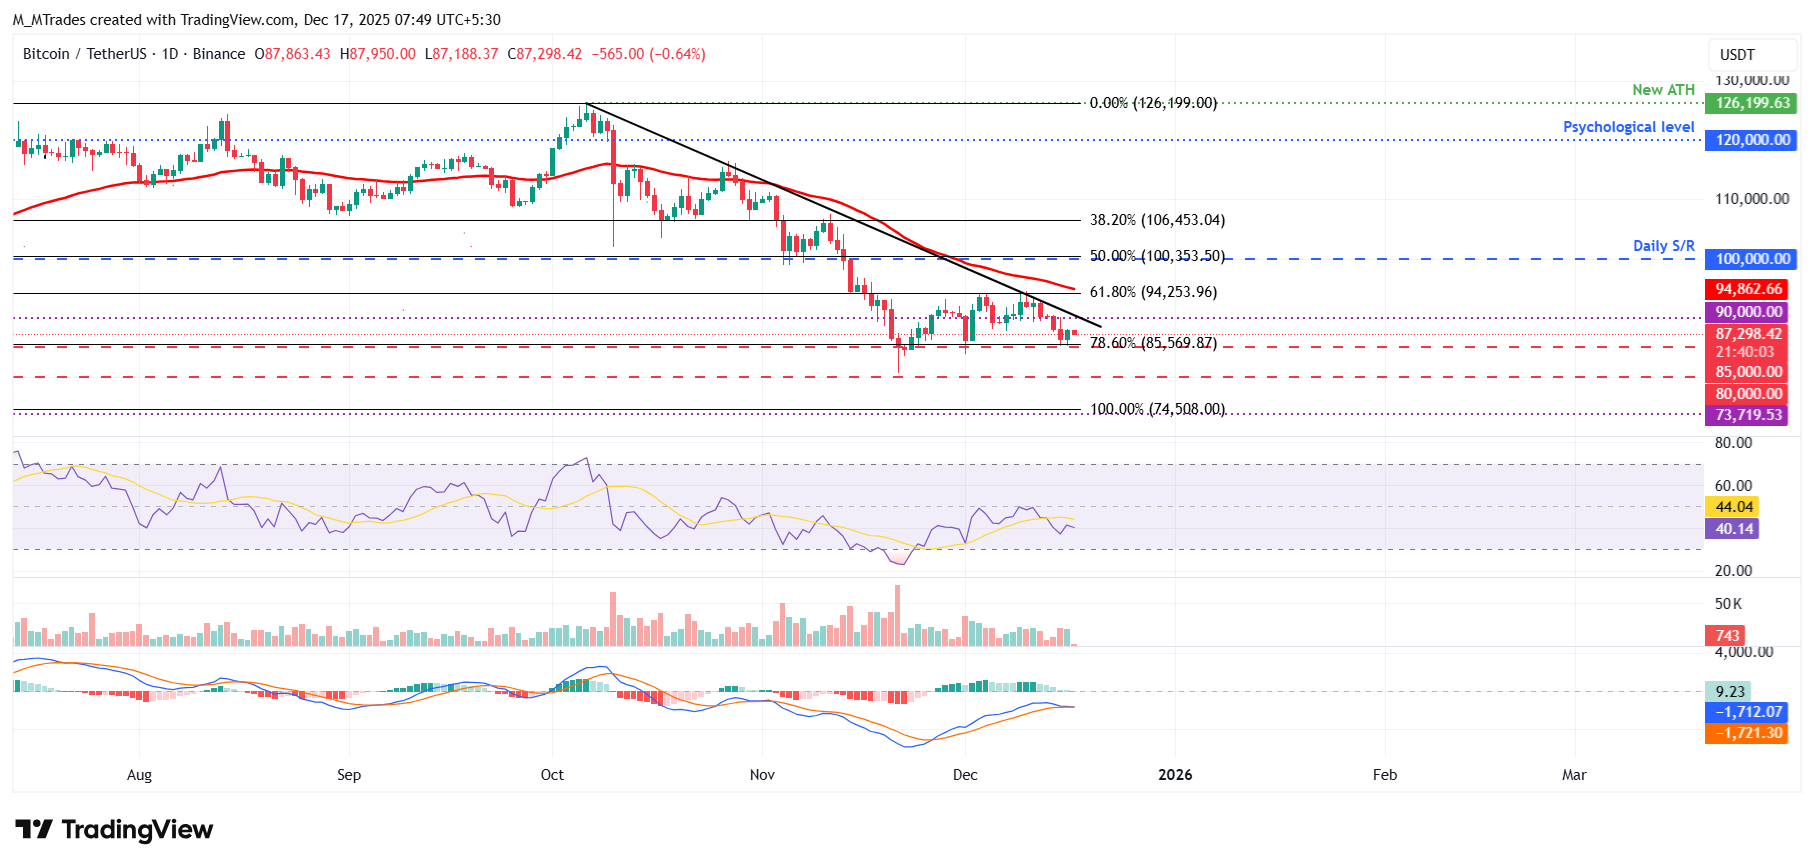
If BTC recovers, it could extend the advance toward the 61.8% Fibonacci retracement level at $94,253.
Ethereum momentum indicators show bearish signs
Ethereum price failed to close above the 50-day Exponential Moving Average (EMA) at $3,249 on December 10 and declined 11% by Tuesday. As of Wednesday, ETH continues to decline, trading below $2,946.
If ETH continues its correction, it could extend the decline toward the next support at $2,749.
The RSI on the daily chart is 41, below its neutral level of 50, indicating that bearish momentum is gaining traction. Moreover, the MACD is showing a bearish crossover on Wednesday, further supporting the negative outlook.
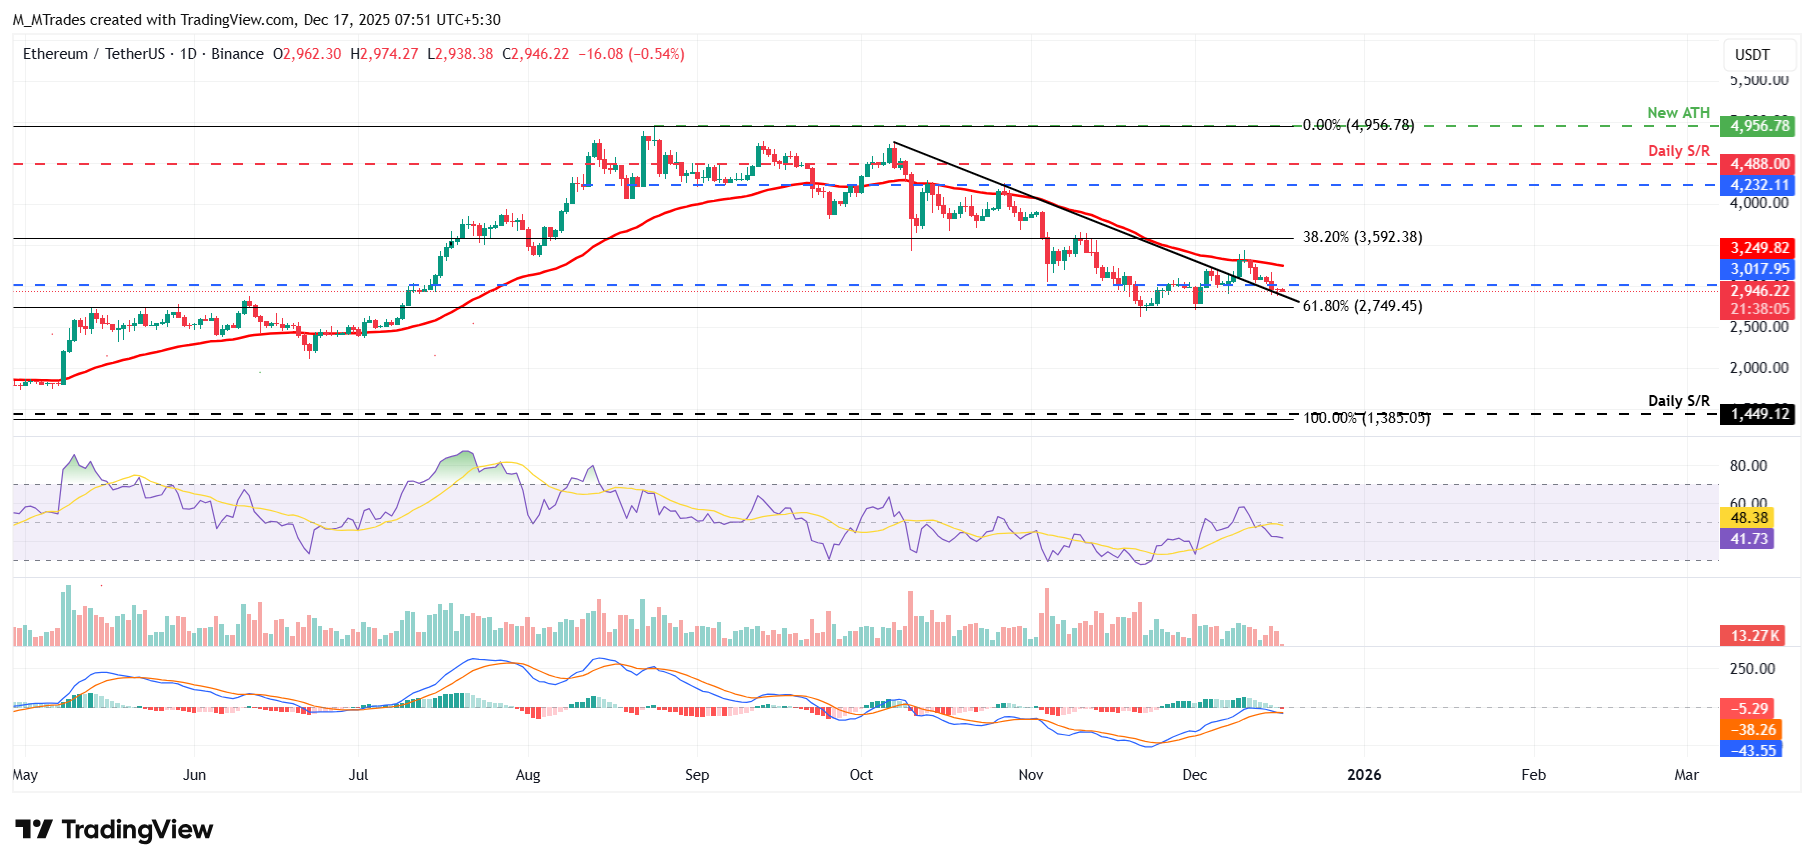
On the other hand, if ETH recovers, it could extend the recovery toward the 50-day EMA at $3,249.
XRP bears are aiming for $1.77 as it closes below key support
XRP price declined for the second consecutive week by 3.22%, retesting the key daily support at $1.96 on Sunday. As of this week, on Monday, XRP continues the correction and closes below this support level. However, on Tuesday, XRP recovered slightly, and as of Wednesday, it hovers around $1.91.
If XRP continues its pullback, it could extend the decline toward the next daily support at $1.77.
The RSI on the daily chart is 37, below its neutral level of 50, indicating that bearish momentum is gaining traction. Additionally, the MACD indicator also showed a bearish crossover on Sunday, which remains intact, further supporting the bearish thesis.
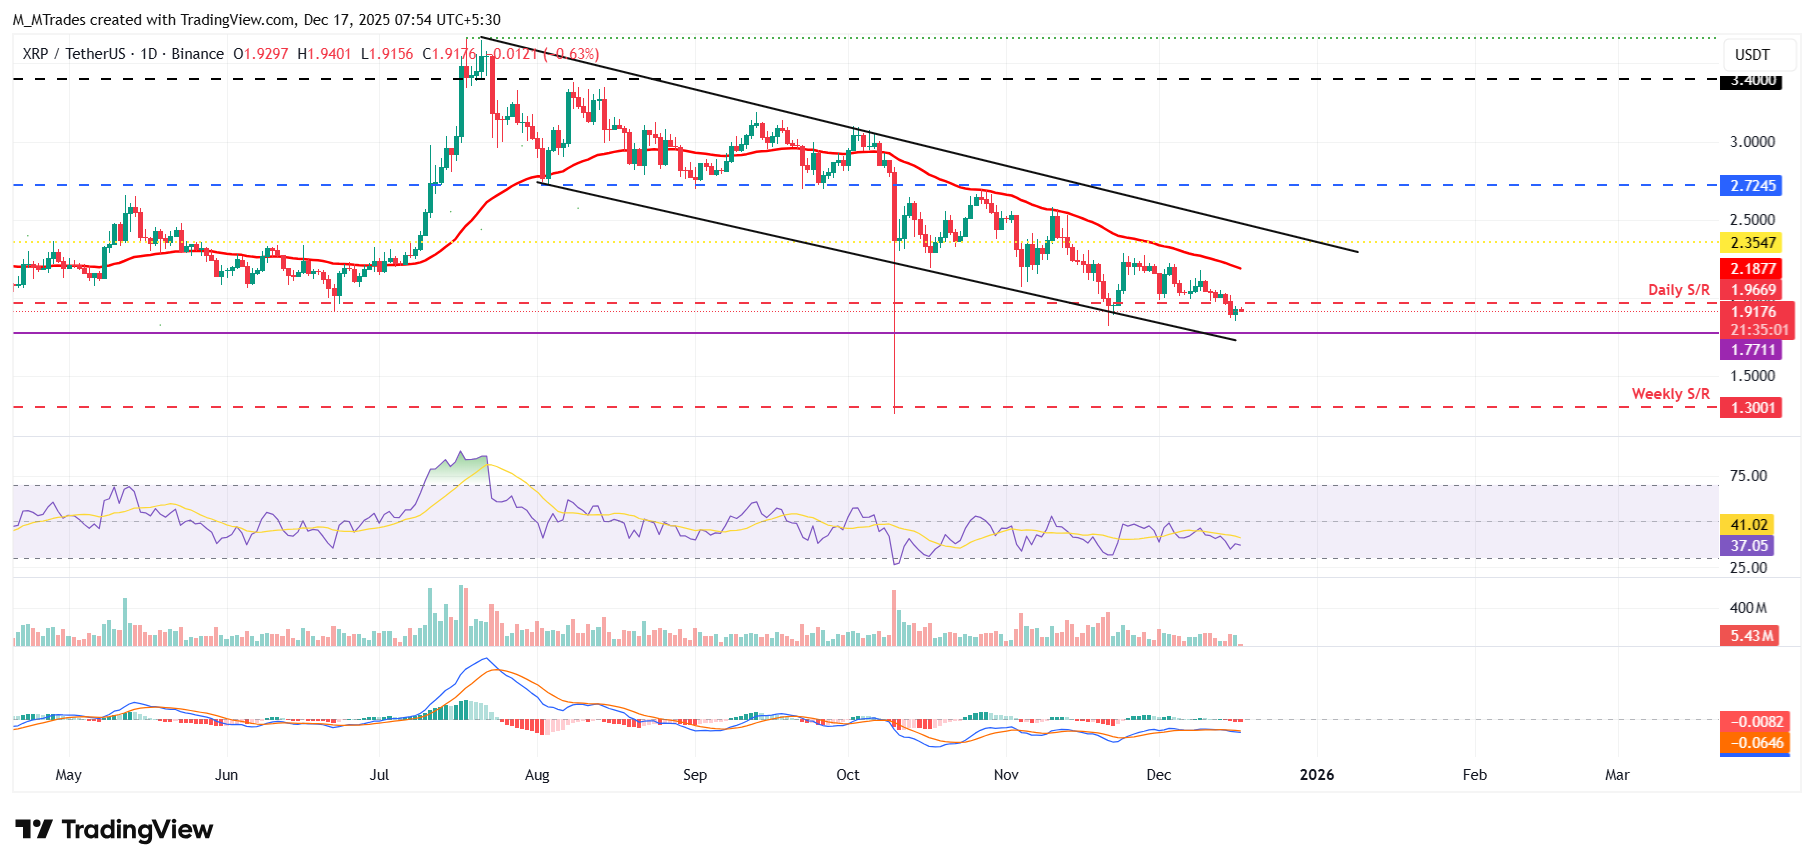
However, if XRP recovers, it could extend the advance toward the daily resistance level at $1.96.
Cryptocurrency metrics FAQs
The developer or creator of each cryptocurrency decides on the total number of tokens that can be minted or issued. Only a certain number of these assets can be minted by mining, staking or other mechanisms. This is defined by the algorithm of the underlying blockchain technology. On the other hand, circulating supply can also be decreased via actions such as burning tokens, or mistakenly sending assets to addresses of other incompatible blockchains.
Market capitalization is the result of multiplying the circulating supply of a certain asset by the asset’s current market value.
Trading volume refers to the total number of tokens for a specific asset that has been transacted or exchanged between buyers and sellers within set trading hours, for example, 24 hours. It is used to gauge market sentiment, this metric combines all volumes on centralized exchanges and decentralized exchanges. Increasing trading volume often denotes the demand for a certain asset as more people are buying and selling the cryptocurrency.
Funding rates are a concept designed to encourage traders to take positions and ensure perpetual contract prices match spot markets. It defines a mechanism by exchanges to ensure that future prices and index prices periodic payments regularly converge. When the funding rate is positive, the price of the perpetual contract is higher than the mark price. This means traders who are bullish and have opened long positions pay traders who are in short positions. On the other hand, a negative funding rate means perpetual prices are below the mark price, and hence traders with short positions pay traders who have opened long positions.

FXStreet
Oltre un milione di utenti si affida a FXStreet per dati di mercato in tempo reale, strumenti di charting, approfondimenti di esperti e notizie Forex. Il loro calendario economico completo e i webinar formativi aiutano i trader a rimanere informati e a prendere decisioni ponderate. FXStreet conta circa 60 professionisti tra la sede di Barcellona e diverse regioni globali.
Read More


