
Trade The World
Top 3 Price Prediction: Bitcoin, Ethereum, Ripple – BTC, ETH, and XRP extend gains, gear up for another bullish week
Di Manish Chhetri
Data di Pubblicazione: 27 Oct 2025 | Data di Modifica: 27 Oct 2025


POPULAR ARTICLES

Bitcoin (BTC), Ethereum (ETH), and Ripple (XRP) extend gains on Monday after rallying more than 5%, 4%, and 10%, respectively, in the previous week amid improving market sentiment.
- Bitcoin price trades in green on Monday after rallying over 5% in the previous week.
- Ethereum price is nearing key resistance at $4,232, a successful breakout could pave the way for further upside.
- XRP shows signs of a rally, with momentum indicators pointing to strengthening bullish momentum.
Bitcoin (BTC), Ethereum (ETH), and Ripple (XRP) extend gains on Monday after rallying more than 5%, 4%, and 10%, respectively, in the previous week amid improving market sentiment. The technical outlook for these top three cryptocurrencies suggests further upside potential, with momentum indicators signaling strengthening bullish momentum.
Bitcoin bulls aiming for $120,000 mark
Bitcoin price found support around the 61.8% Fibonacci retracement level (drawn from the April low of $74,508 to the record high of $126,199) at $106,453 on Wednesday. BTC rose 6.57% in the next four days and closed above the 50-day Exponential Moving Average (EMA) at $113,397. At the time of writing on Monday, BTC trades above $114,975, nearing the key resistance at $115,137.
If BTC closes above the 78.6% Fibonacci retracement at $115,137, it could extend the rally toward the psychologically important $120,000 level.
The Relative Strength Index (RSI) on the daily chart reads 54, above the neutral level of 50, indicating bullish momentum gaining traction. Additionally, the Moving Average Convergence Divergence (MACD) showed a bullish crossover on Sunday, providing a buy signal and further supporting the bullish view.
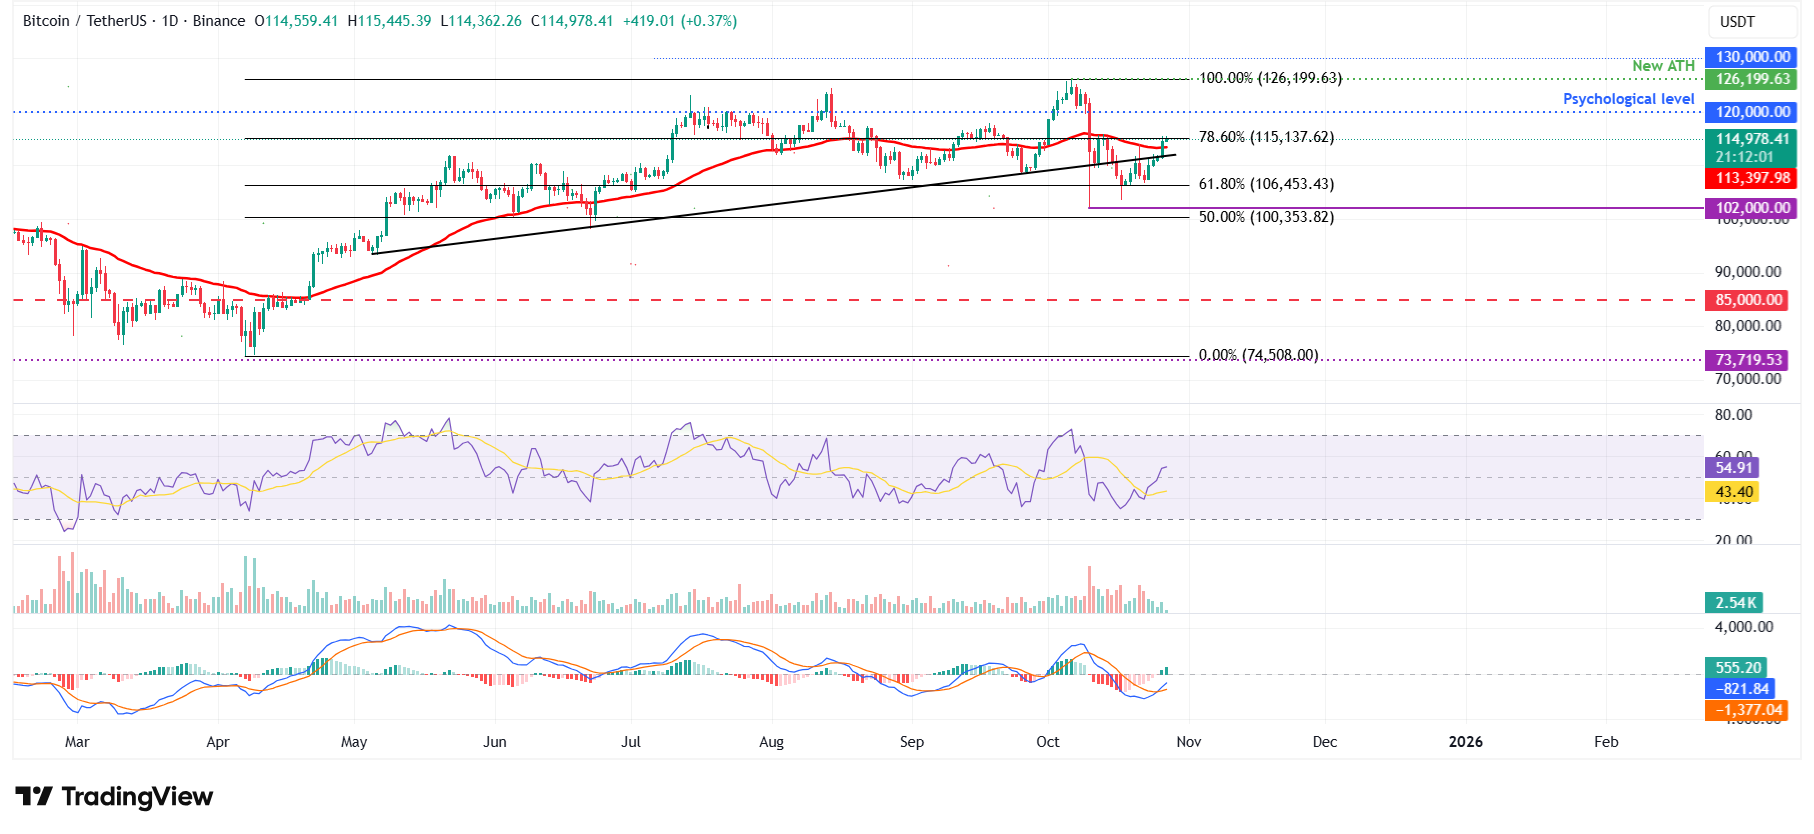
BTC/USDT daily chart
However, if BTC faces rejection from the $115,137 level, it could extend the decline toward the 50-day EMA at $113,397.
Ethereum shows bullish signs on momentum indicators
Ethereum price rose nearly 5% last week and closed above the 50-day EMA at $4,129 on Sunday. At the time of writing on Monday, ETH continues its rally, trading above $4,206.
If ETH breaks and closes above the daily resistance at $4,232, it could extend the rally toward the next daily resistance at $4,488.
Like Bitcoin, Ethereum’s RSI and MACD show bullish momentum, gaining traction and supporting the bullish view.
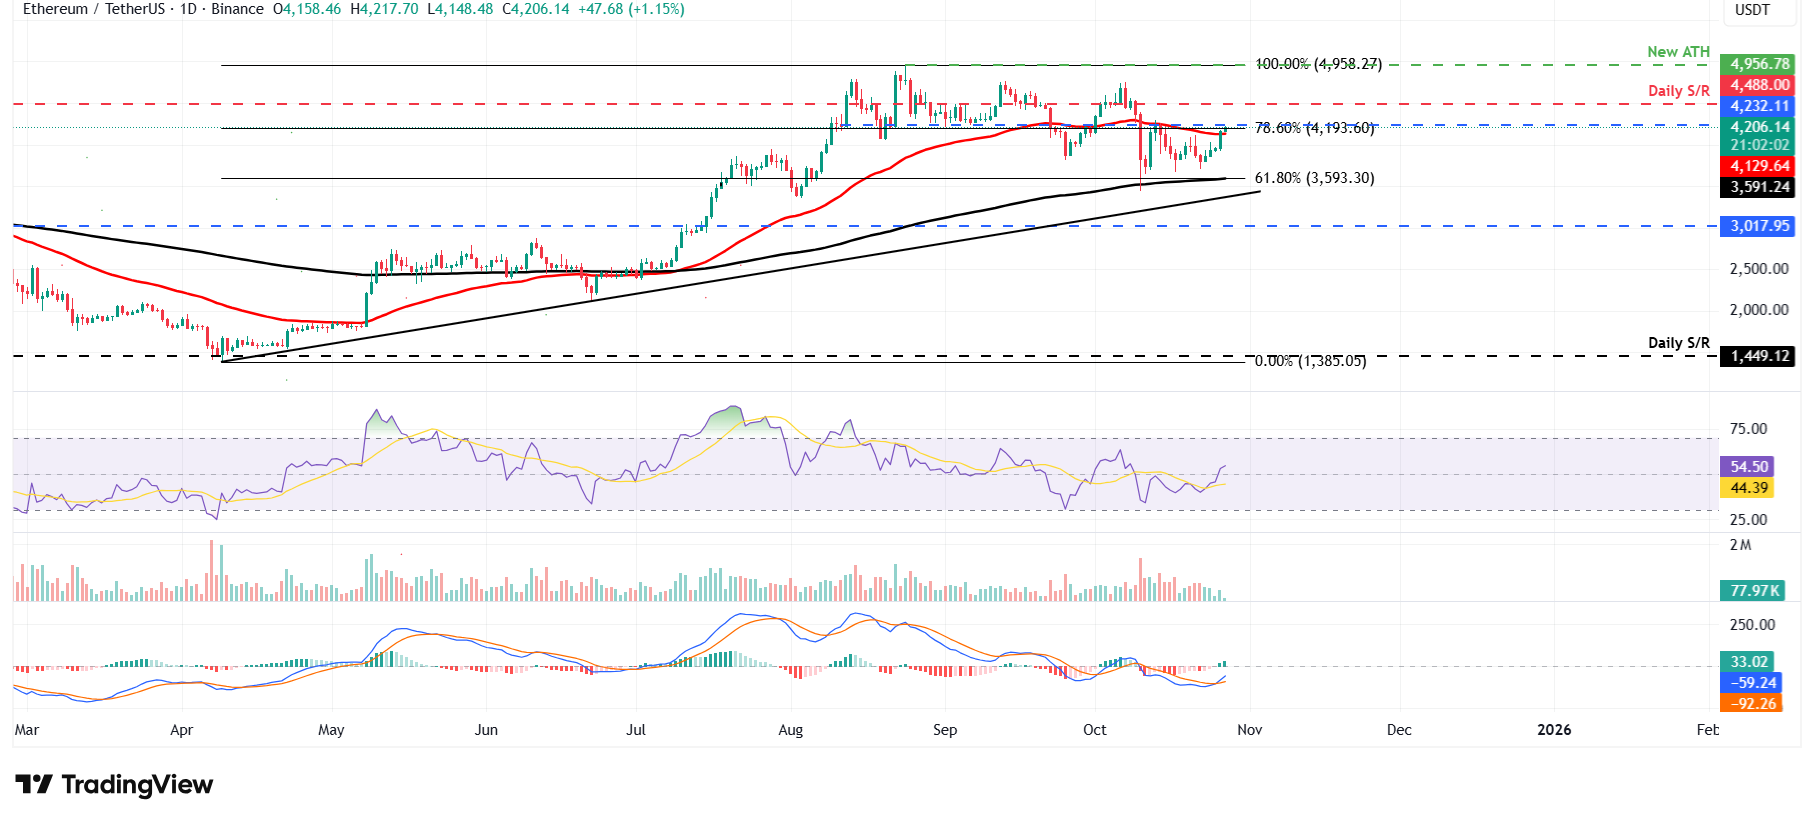
ETH/USDT daily chart
On the other hand, if ETH faces a correction, it could extend the decline toward the 61.8% Fibonacci retracement at $3,593.
XRP shows potential for further upside
XRP gained more than 10% in the previous week, closing above the previously broken trendline and the 200-day EMA at $2.61 on Sunday. At the time of writing on Monday, it is nearing the key resistance at $2.69.
If XRP breaks and closes above the key resistance at $2.69, it could extend the gains toward the next daily resistance at $3.40.
Like Bitcoin and Ethereum, XRP’s RSI and MACD show bullish momentum, gaining traction and supporting the bullish view.
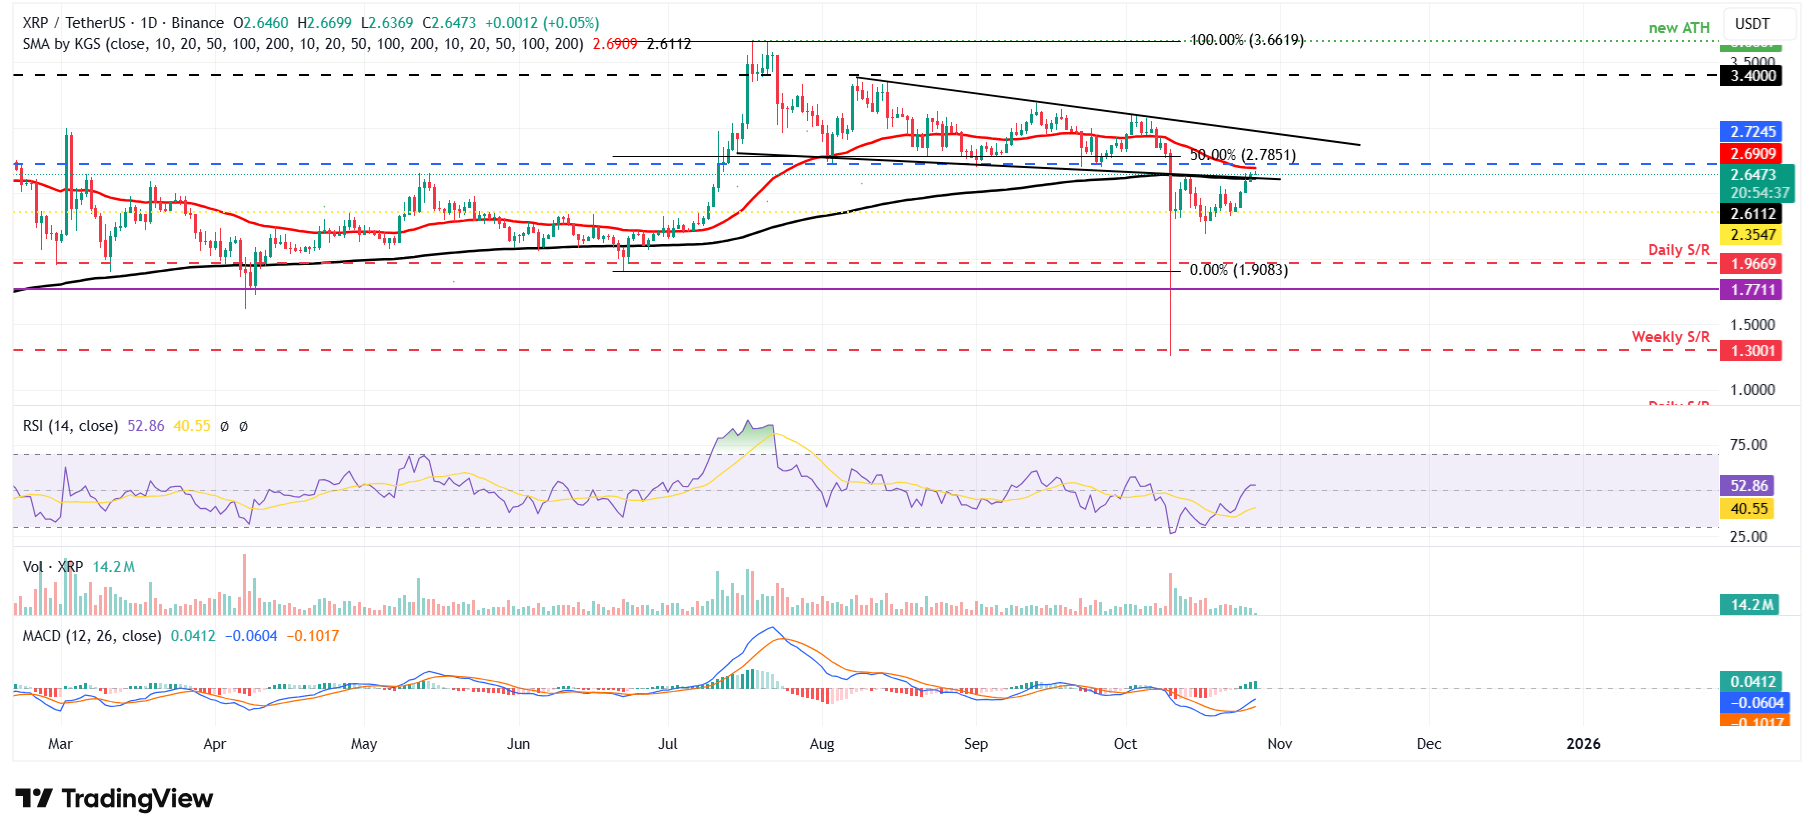
XRP/USDT daily chart
On the other hand, if XRP faces a correction, it could extend the decline toward the key daily support at $2.35.
Cryptocurrency metrics FAQs
The developer or creator of each cryptocurrency decides on the total number of tokens that can be minted or issued. Only a certain number of these assets can be minted by mining, staking or other mechanisms. This is defined by the algorithm of the underlying blockchain technology. On the other hand, circulating supply can also be decreased via actions such as burning tokens, or mistakenly sending assets to addresses of other incompatible blockchains.
Market capitalization is the result of multiplying the circulating supply of a certain asset by the asset’s current market value.
Trading volume refers to the total number of tokens for a specific asset that has been transacted or exchanged between buyers and sellers within set trading hours, for example, 24 hours. It is used to gauge market sentiment, this metric combines all volumes on centralized exchanges and decentralized exchanges. Increasing trading volume often denotes the demand for a certain asset as more people are buying and selling the cryptocurrency.
Funding rates are a concept designed to encourage traders to take positions and ensure perpetual contract prices match spot markets. It defines a mechanism by exchanges to ensure that future prices and index prices periodic payments regularly converge. When the funding rate is positive, the price of the perpetual contract is higher than the mark price. This means traders who are bullish and have opened long positions pay traders who are in short positions. On the other hand, a negative funding rate means perpetual prices are below the mark price, and hence traders with short positions pay traders who have opened long positions.

FXStreet
Oltre un milione di utenti si affida a FXStreet per dati di mercato in tempo reale, strumenti di charting, approfondimenti di esperti e notizie Forex. Il loro calendario economico completo e i webinar formativi aiutano i trader a rimanere informati e a prendere decisioni ponderate. FXStreet conta circa 60 professionisti tra la sede di Barcellona e diverse regioni globali.
Read More


