
Trade The World
USD/CHF Price Forecast: US Dollar is looking for direction above 0.7955
Di Guillermo Alcala
Data di Pubblicazione: 13 Jan 2026 | Data di Modifica: 13 Jan 2026


POPULAR ARTICLES

The US Dollar has found support at 0.7955, after retreating from highs near 0.8020 against the Swiss Franc on Monday.
- USD/CHF found support at 0.7955 after retreating from 0.8020 highs.
- The pair is looking for direction, with investors awaiting US CPI data.
- Recent price action shows an ascending wedge; technical indicators are neutral-to-bearish.
The US Dollar has found support at 0.7955, after retreating from highs near 0.8020 against the Swiss Franc on Monday. Recent price action keeps the upside trend from late December lows in play, although technical indicators show a weakening momentum.
The pair's bearish pressure stemming from the escalation of the conflict between the US government and the Federal Reserve (Fed) seems to have abated, and investors are looking from the sidelines on Tuesday, awaiting the release of the US CPI report, to place directional bets on the US Dollar.
Technical Analysis: USD/CHF trades within an expanding wedge
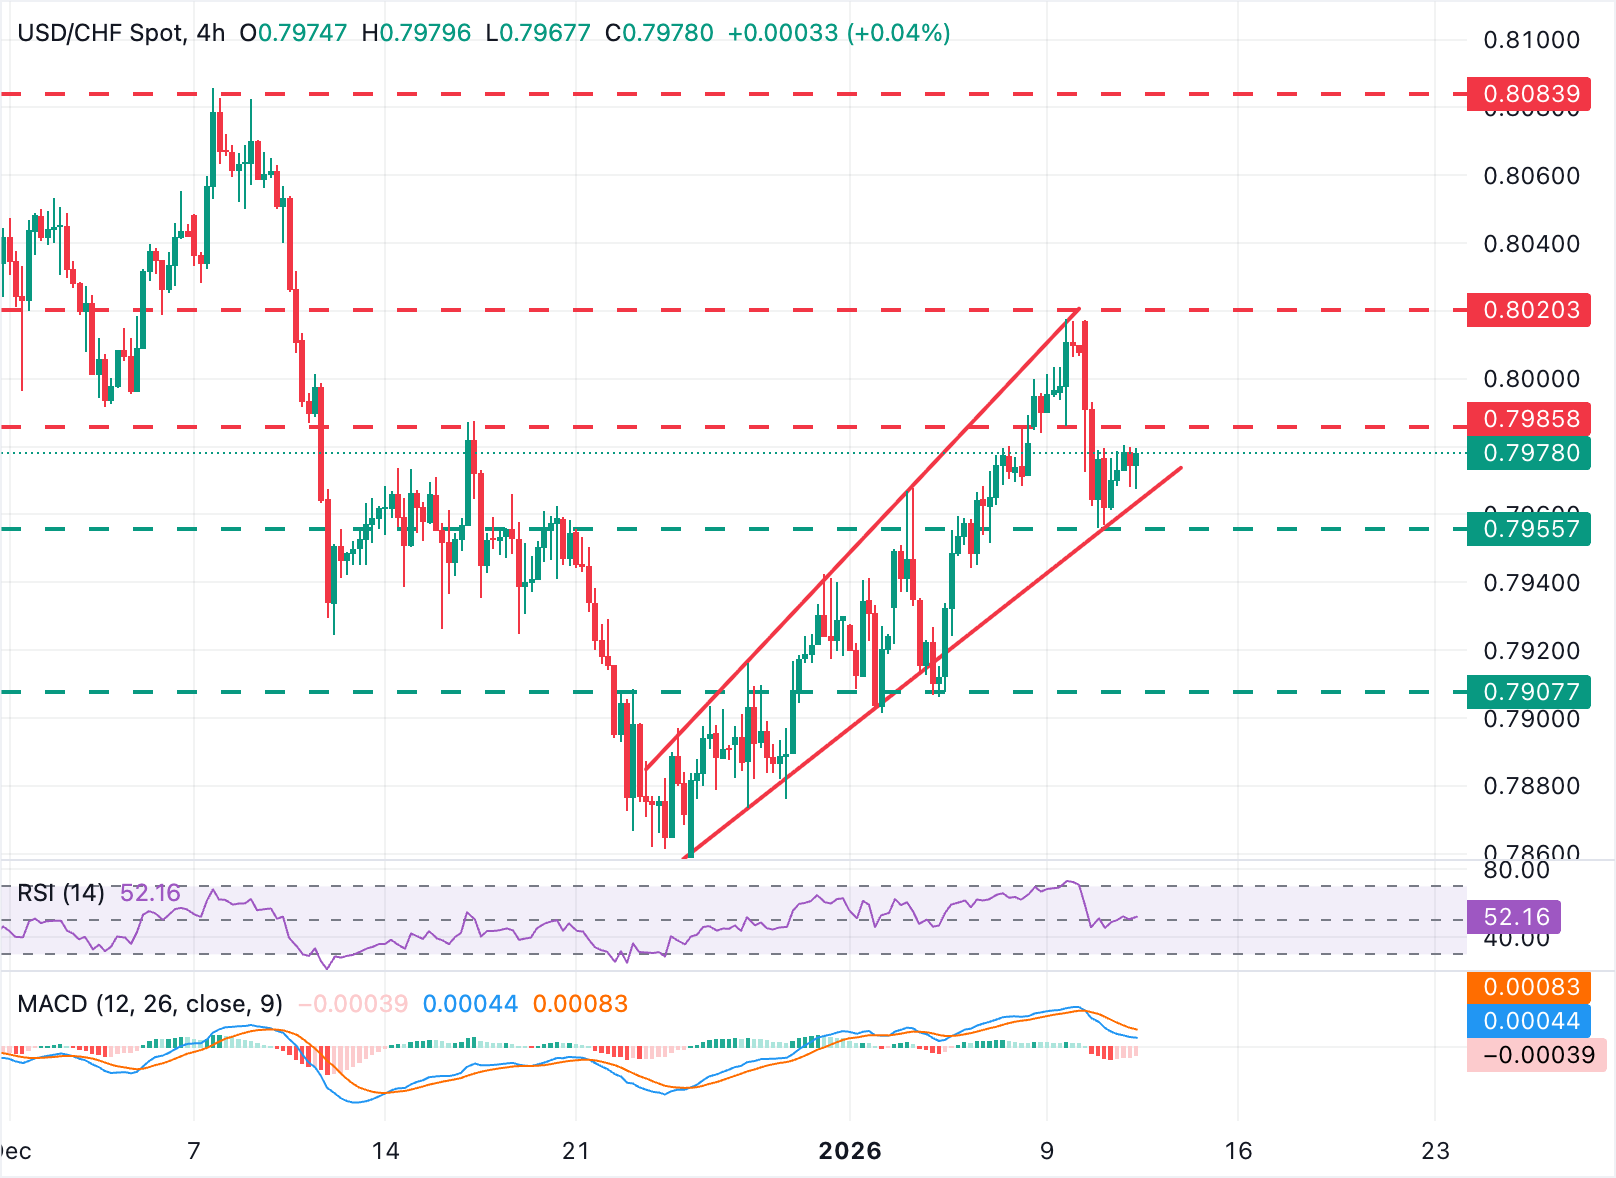
The USD/CHF paid trades at 0.7977 after bouncing from 0.7955 lows. Price action shows an expanding wedge, a figure highlighting an emotional market, and often anticipating a bearish outcome. Technical indicators show a neutral-to bearish momentum. The Moving Average Convergence Divergence (MACD) has slipped marginally below the zero line, and the Relative Strength Index (RSI) hovers around the 50 line, which reflects a lack of a clear bias.
Immediate support is in the confluence between trendline support and Monday's low, around 0.7955. If this level gives way, the next target is the January 2 and 6 lows at the 0.7900-0.7905 area. To the upside, a previous support at 0.7985 (January 9 low) is holding bulls right now and closing the path to Monday's high, at 0.8020, and the wedge top, now at 0.8035.
(The technical analysis of this story was written with the help of an AI tool.)
US Dollar Price Today
The table below shows the percentage change of US Dollar (USD) against listed major currencies today. US Dollar was the strongest against the Japanese Yen.
| USD | EUR | GBP | JPY | CAD | AUD | NZD | CHF | |
|---|---|---|---|---|---|---|---|---|
| USD | 0.00% | -0.08% | 0.51% | 0.00% | 0.17% | -0.03% | 0.03% | |
| EUR | -0.00% | -0.08% | 0.50% | 0.00% | 0.16% | -0.03% | 0.03% | |
| GBP | 0.08% | 0.08% | 0.56% | 0.09% | 0.25% | 0.05% | 0.10% | |
| JPY | -0.51% | -0.50% | -0.56% | -0.47% | -0.32% | -0.52% | -0.45% | |
| CAD | -0.01% | -0.01% | -0.09% | 0.47% | 0.16% | -0.04% | 0.02% | |
| AUD | -0.17% | -0.16% | -0.25% | 0.32% | -0.16% | -0.19% | -0.13% | |
| NZD | 0.03% | 0.03% | -0.05% | 0.52% | 0.04% | 0.19% | 0.06% | |
| CHF | -0.03% | -0.03% | -0.10% | 0.45% | -0.02% | 0.13% | -0.06% |
The heat map shows percentage changes of major currencies against each other. The base currency is picked from the left column, while the quote currency is picked from the top row. For example, if you pick the US Dollar from the left column and move along the horizontal line to the Japanese Yen, the percentage change displayed in the box will represent USD (base)/JPY (quote).

FXStreet
Oltre un milione di utenti si affida a FXStreet per dati di mercato in tempo reale, strumenti di charting, approfondimenti di esperti e notizie Forex. Il loro calendario economico completo e i webinar formativi aiutano i trader a rimanere informati e a prendere decisioni ponderate. FXStreet conta circa 60 professionisti tra la sede di Barcellona e diverse regioni globali.
Read More


