


핵심 요약
차트 패턴과 캔들스틱 패턴의 차이: 캔들은 패턴(소수의 캔들스틱)을 형성하고, 이러한 패턴이 다시 시장 구조를 나타내는 차트 패턴(다수의 캔들스틱)을 형성합니다.
지속형 패턴 vs. 반전형 패턴: 추세 재개 구조와 추세 소진 신호를 구분하는 것은 주문 흐름(order flow)을 맥락적으로 해석하는 데 매우 중요합니다.
패턴 매매 기법: 브레이크아웃과 박스권 매매는 트레이더가 거래량 과 가격 움직임 확인 규칙을 기다릴 때 가장 효과적입니다.
진입 타이밍과 보호 스톱: 적절한 리스크 관리를 위해서는 전략적인 진입 스톱을 활용하고, 하드 보호 스톱을 설정해 거짓 브레이크아웃에 대응해야 합니다.
차트 패턴의 유형: 지속형 vs. 반전형
시장 맥락을 이해하려면 지속형 패턴 (추세 재개 전 일시적 멈춤을 나타냄)과 반전형 패턴 (추세 소진 및 반전을 시사함)을 구분해야 합니다.
차트 패턴 을 분류하는 것은 현재 진행 중인 차트의 메커니즘, 시장 행동, 그리고 트레이더’의 심리를 이해하는 데 중요합니다.
지속형 차트 패턴
이러한 형성은 일시적인 조정을 나타내며, 시장이 지배적인 거시 추세를 재개하기 전에 유동성을 축적할 수 있도록 합니다
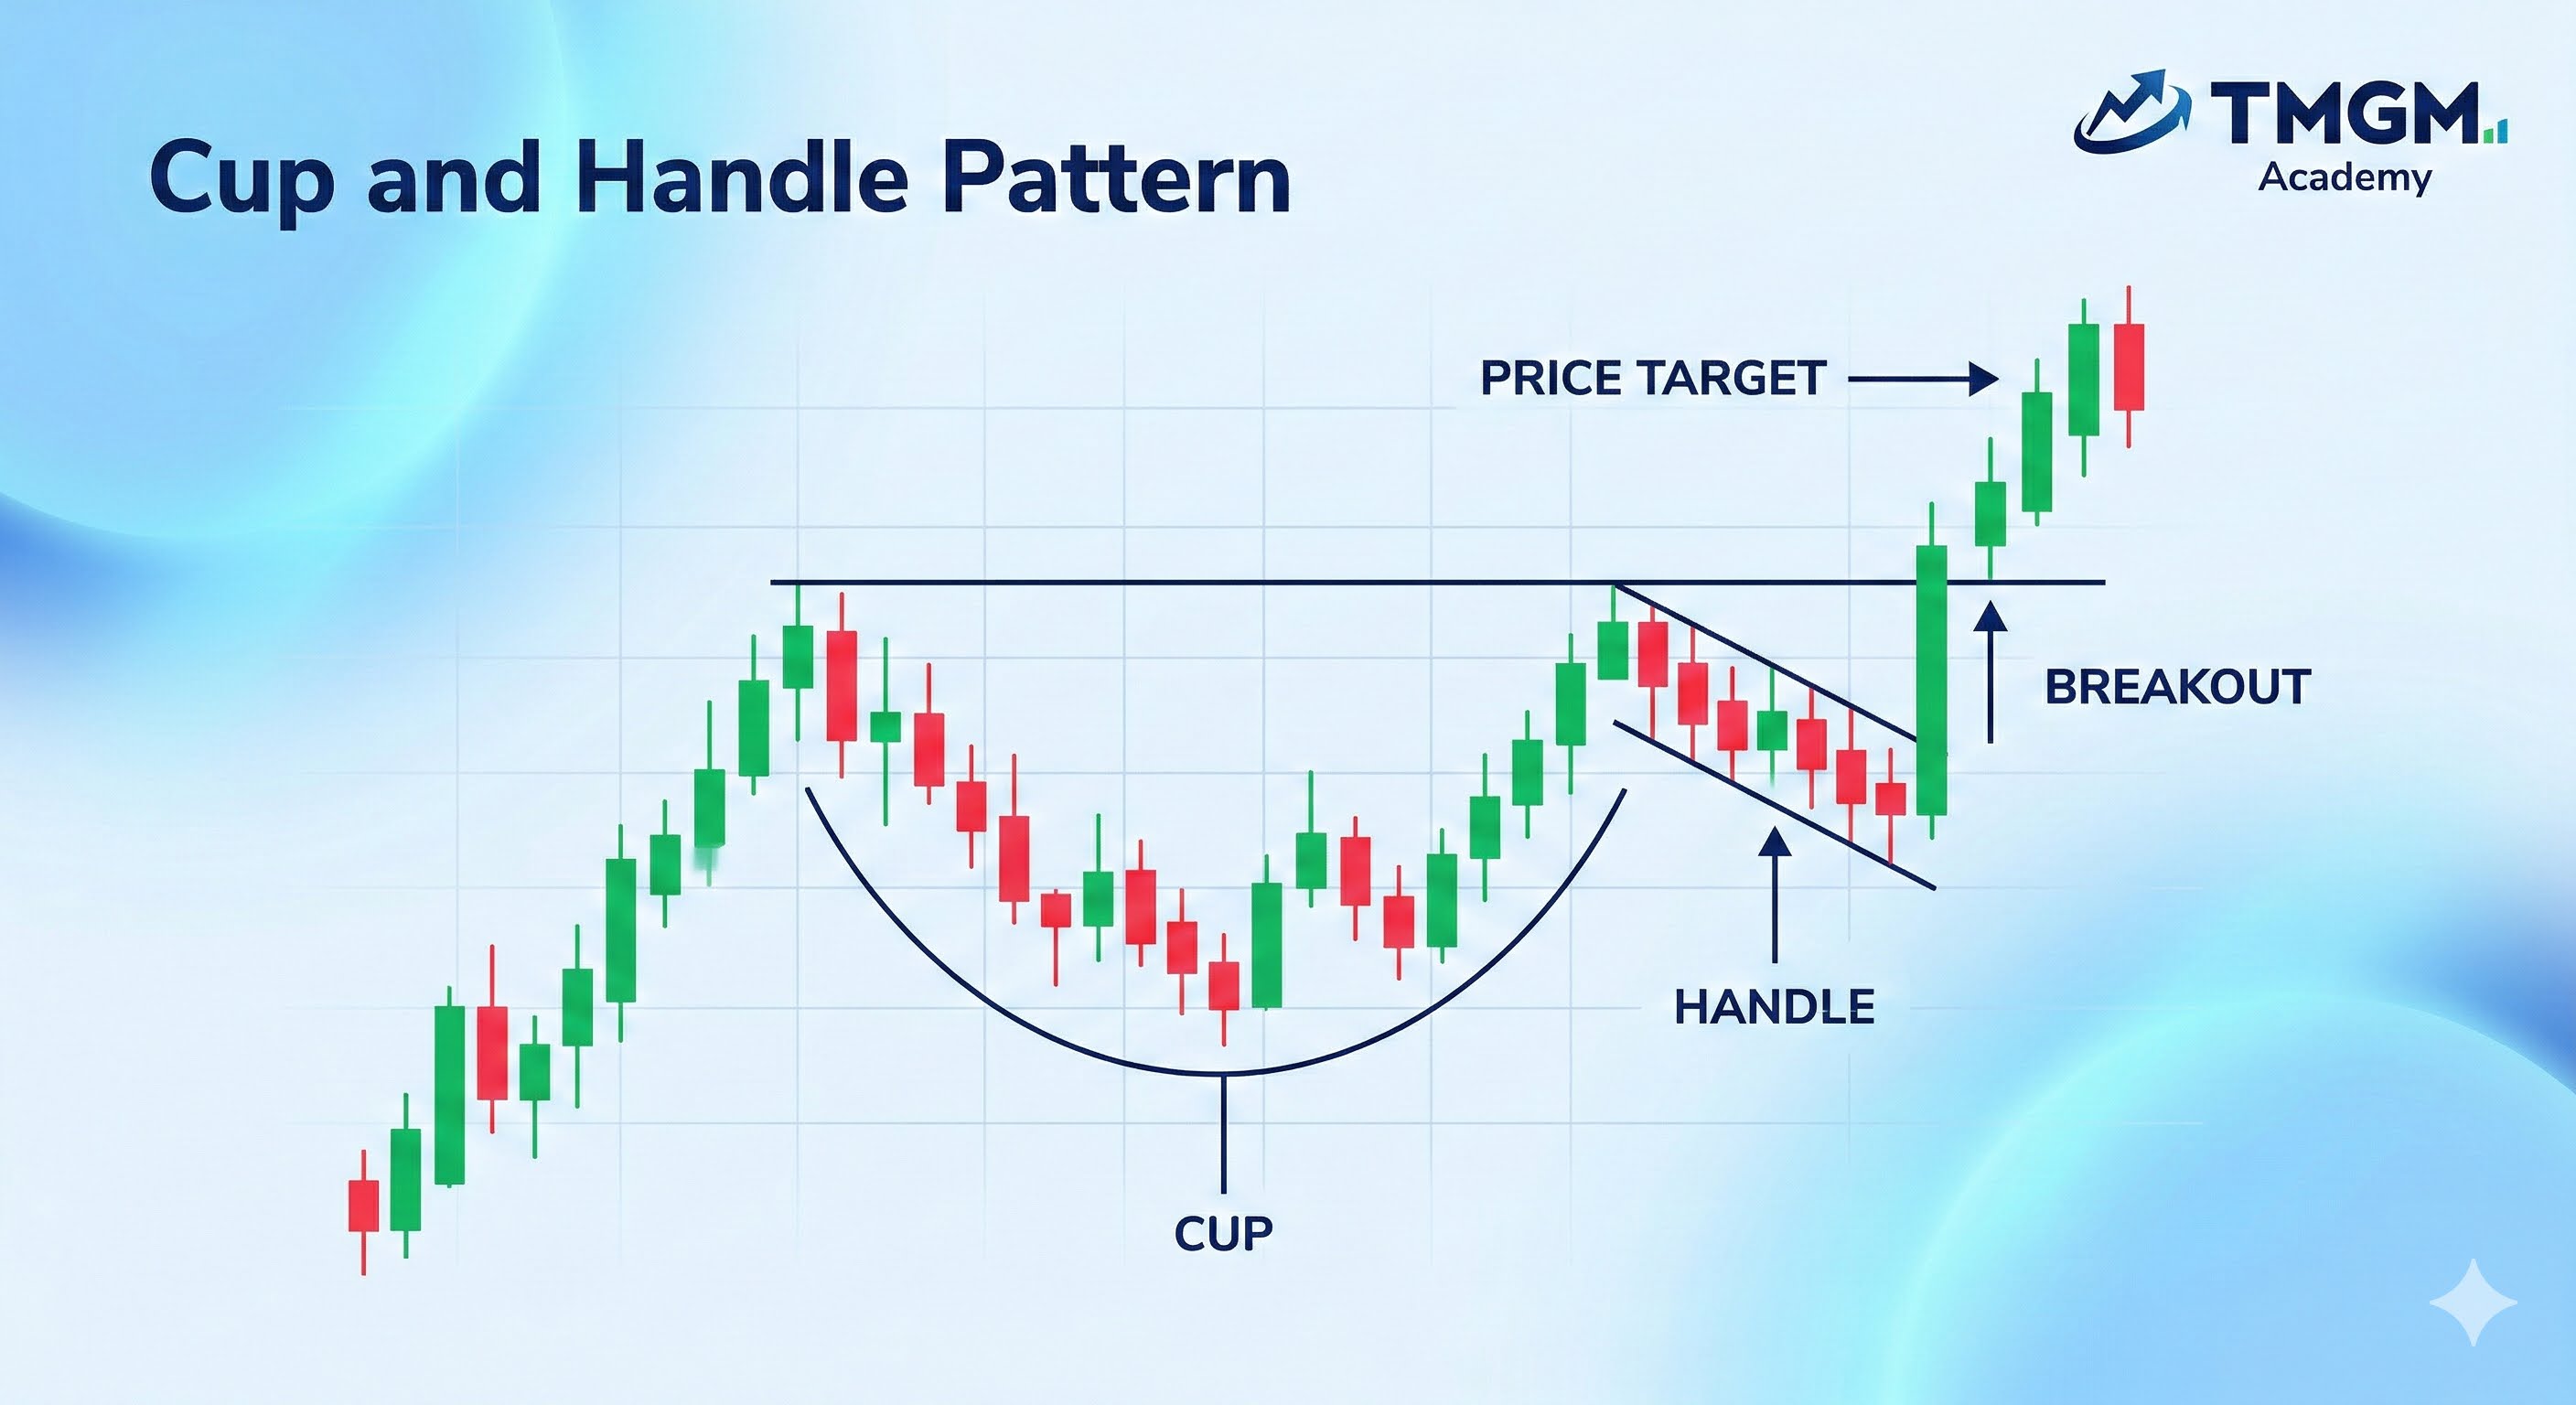
컵 앤 핸들 패턴:
그릇 또는 ‘컵’ 모양의 강세 조정 이후, 소폭의 하락 흐름(‘핸들’)이 이어지며 상승 브레이크아웃을 준비하는 패턴입니다.
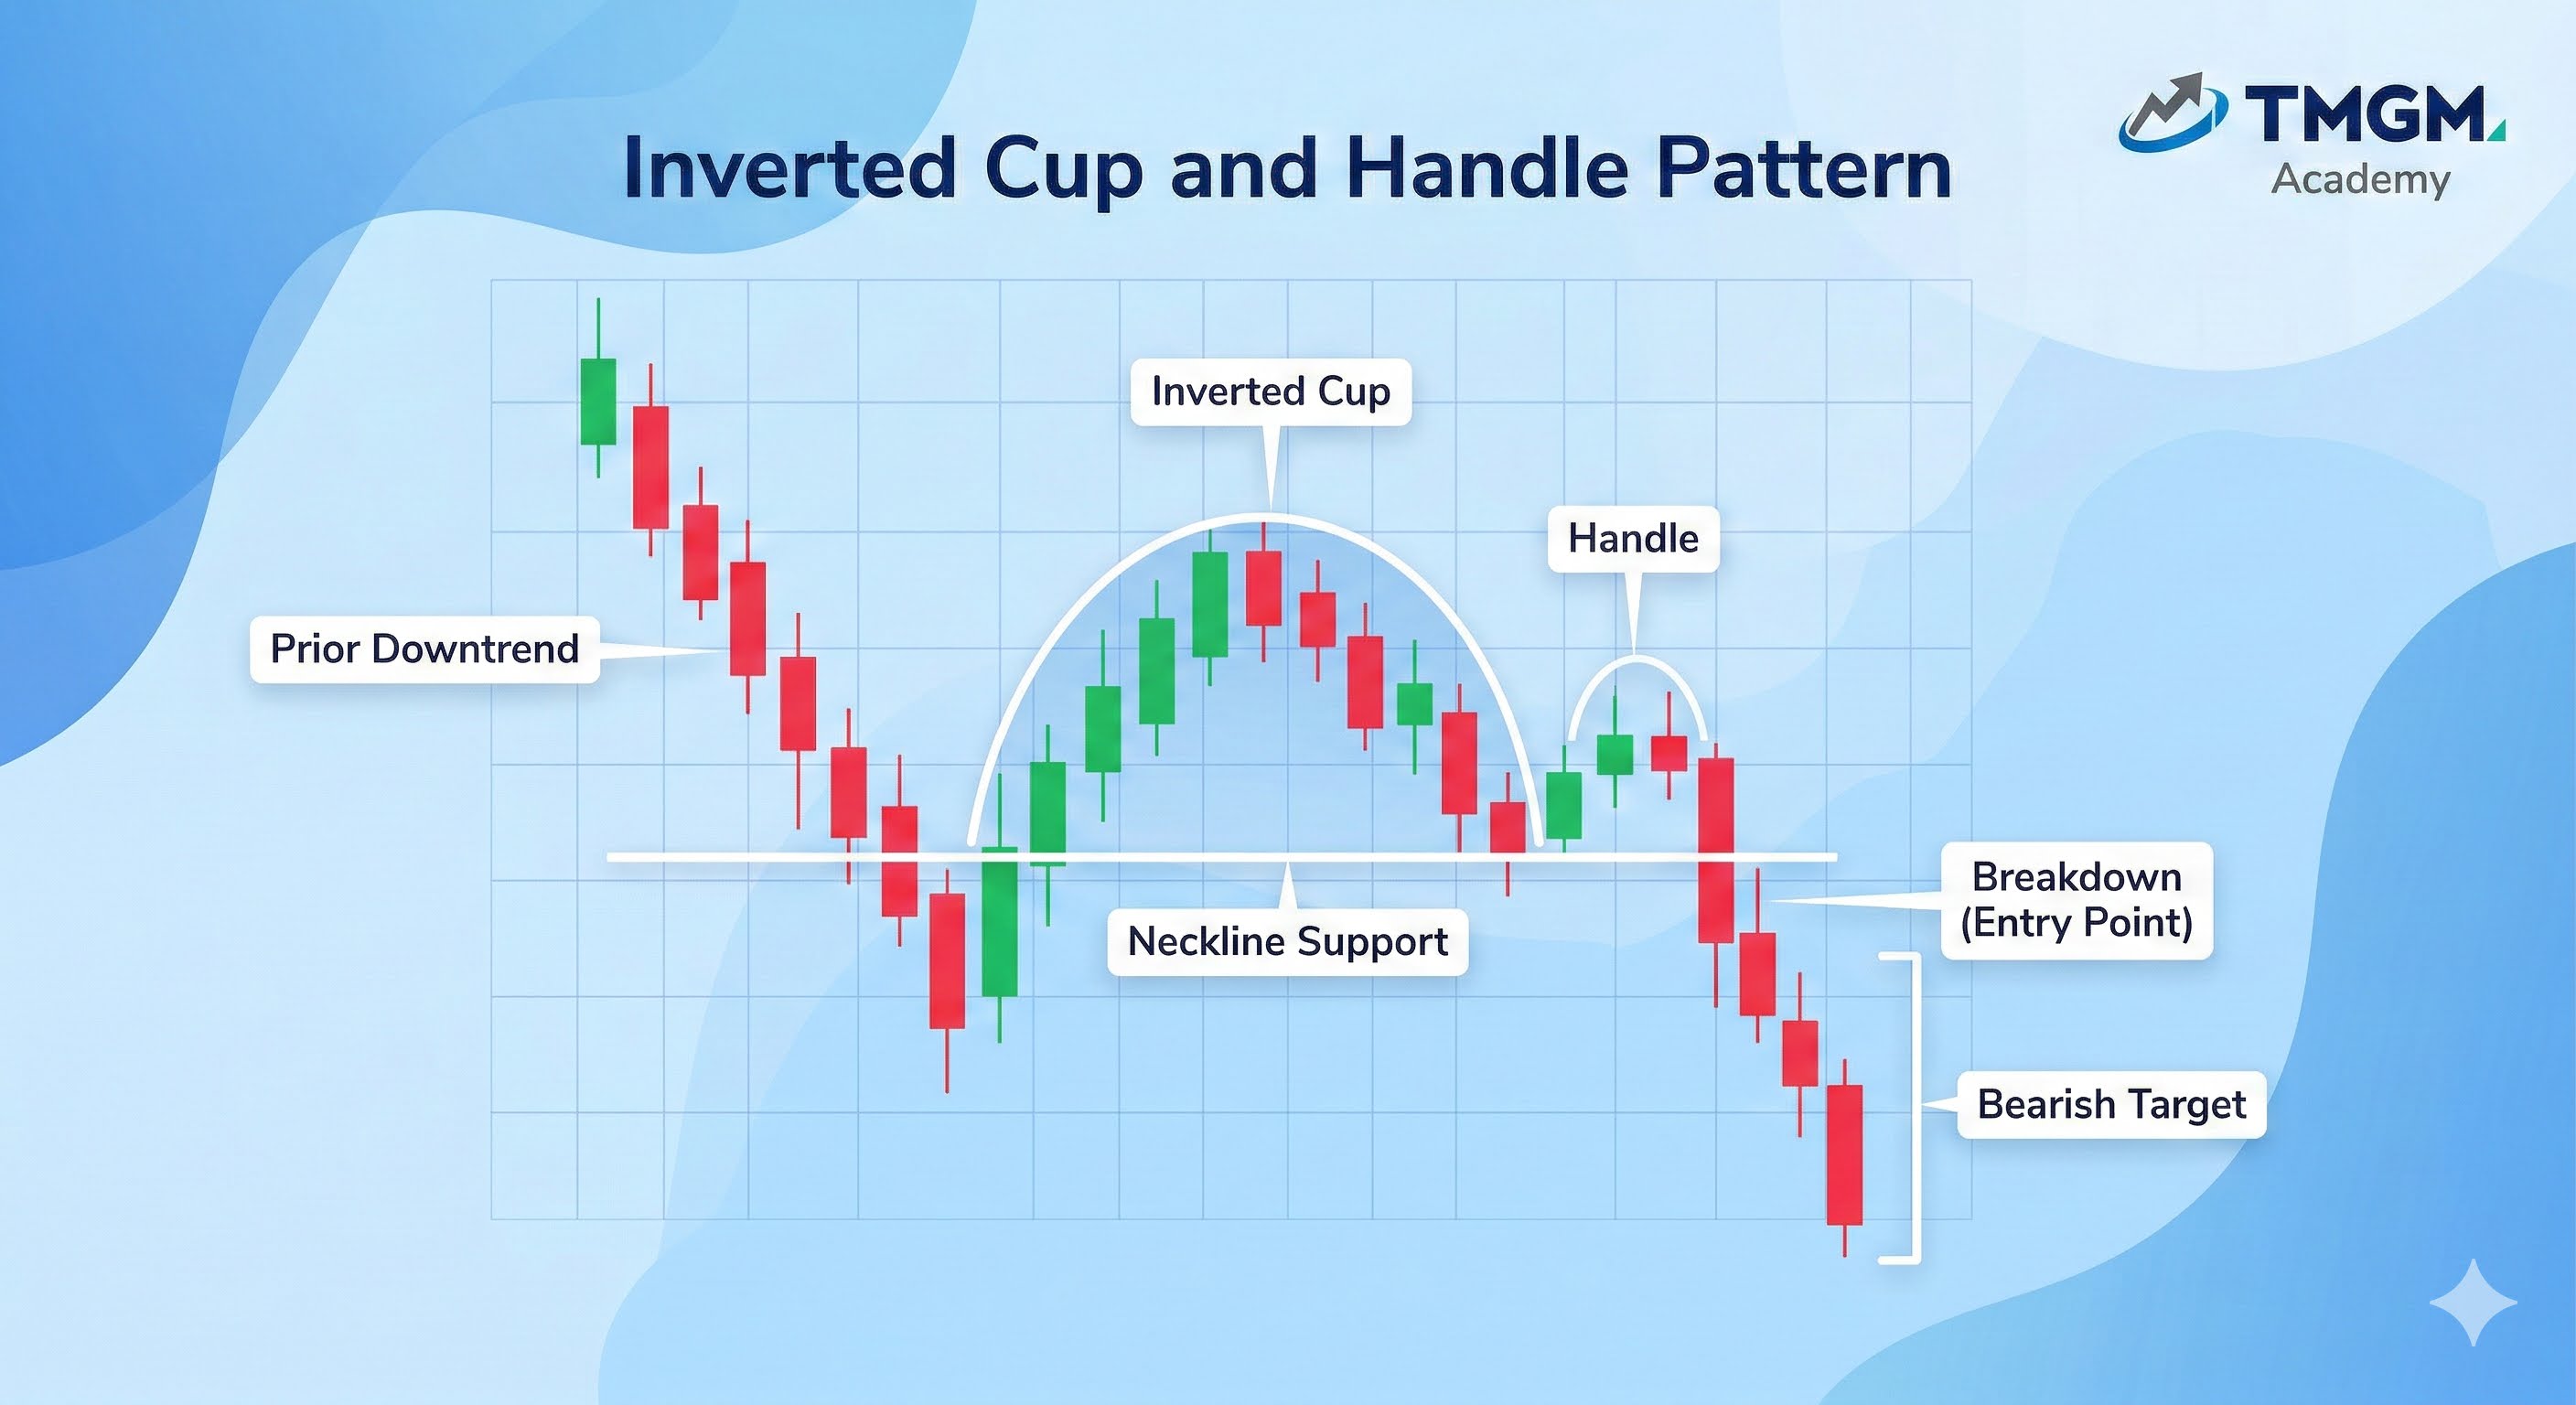
역컵 앤 핸들 패턴:
둥근 천장(역컵) 형성 후 소폭의 상방 되돌림(핸들)이 나타난 뒤 추가 하락이 이어지는 약세 지속형 패턴입니다.
강세 및 약세 플래그 차트 패턴들
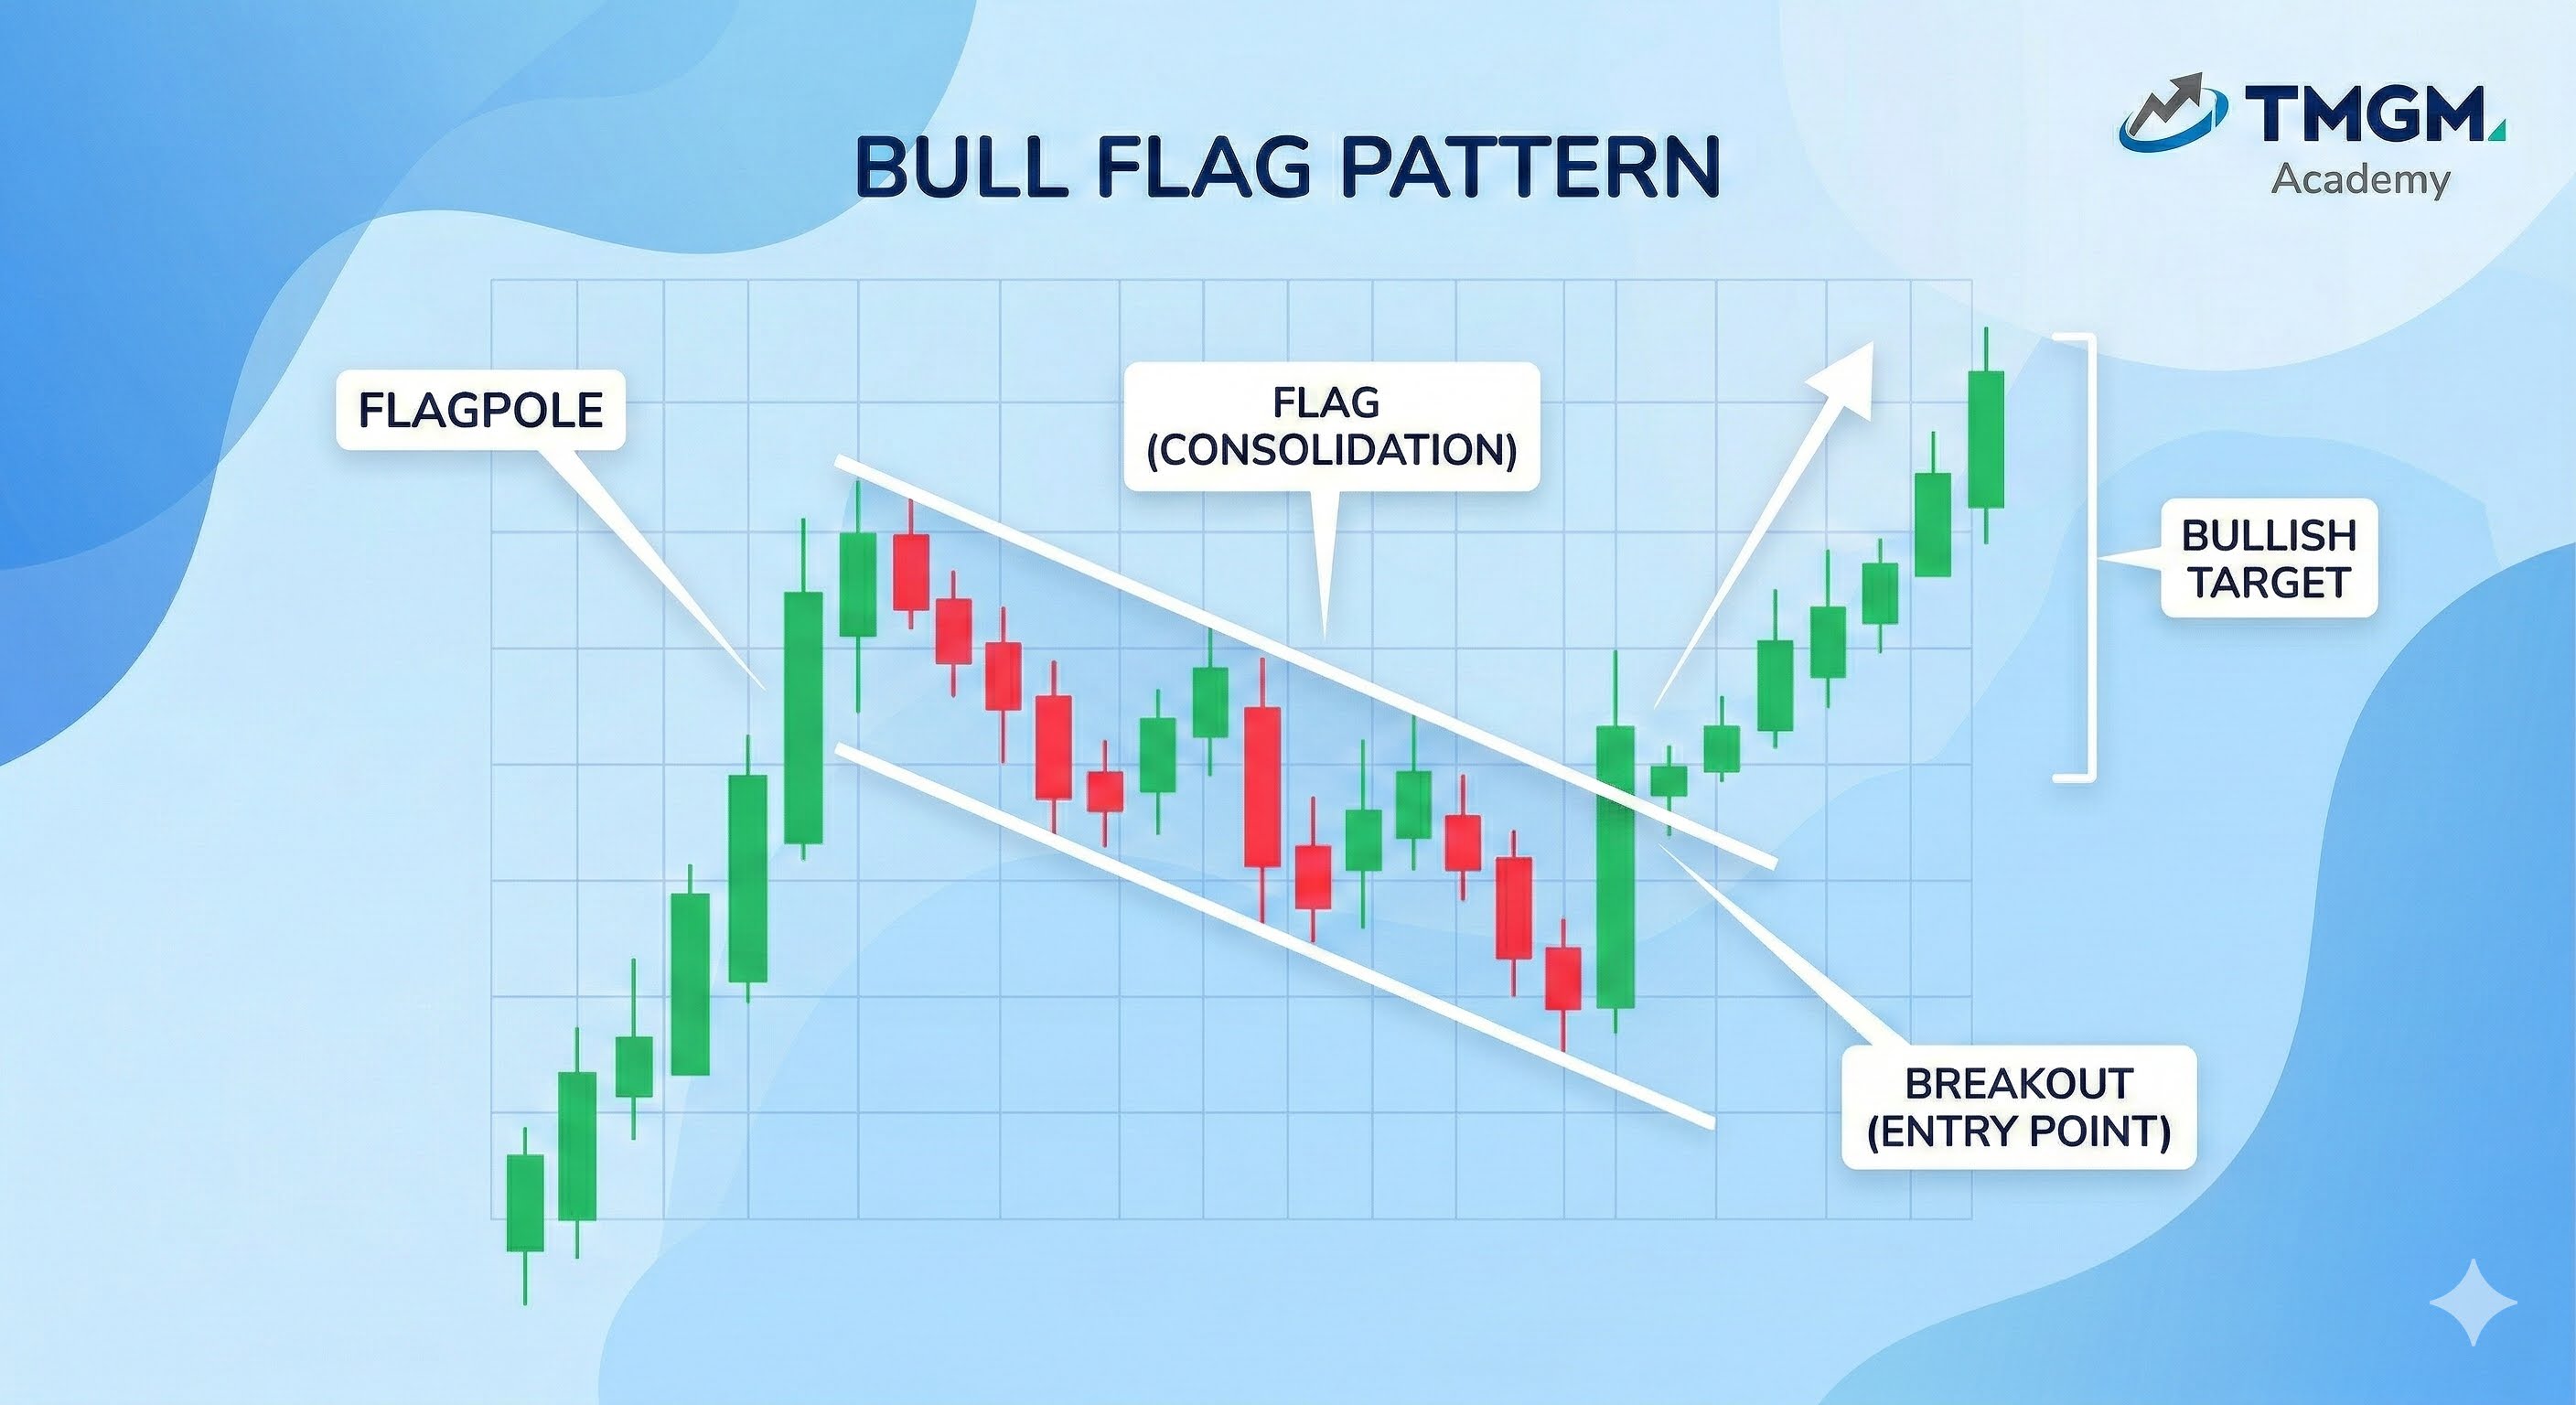
강세 플래그 패턴:
강한 상승 추세 파동(플래그폴) 이후 형성되는 하향 경사 채널(플래그)로, 다음 상승 구간(브레이크아웃) 전 차익 실현을 나타냅니다.
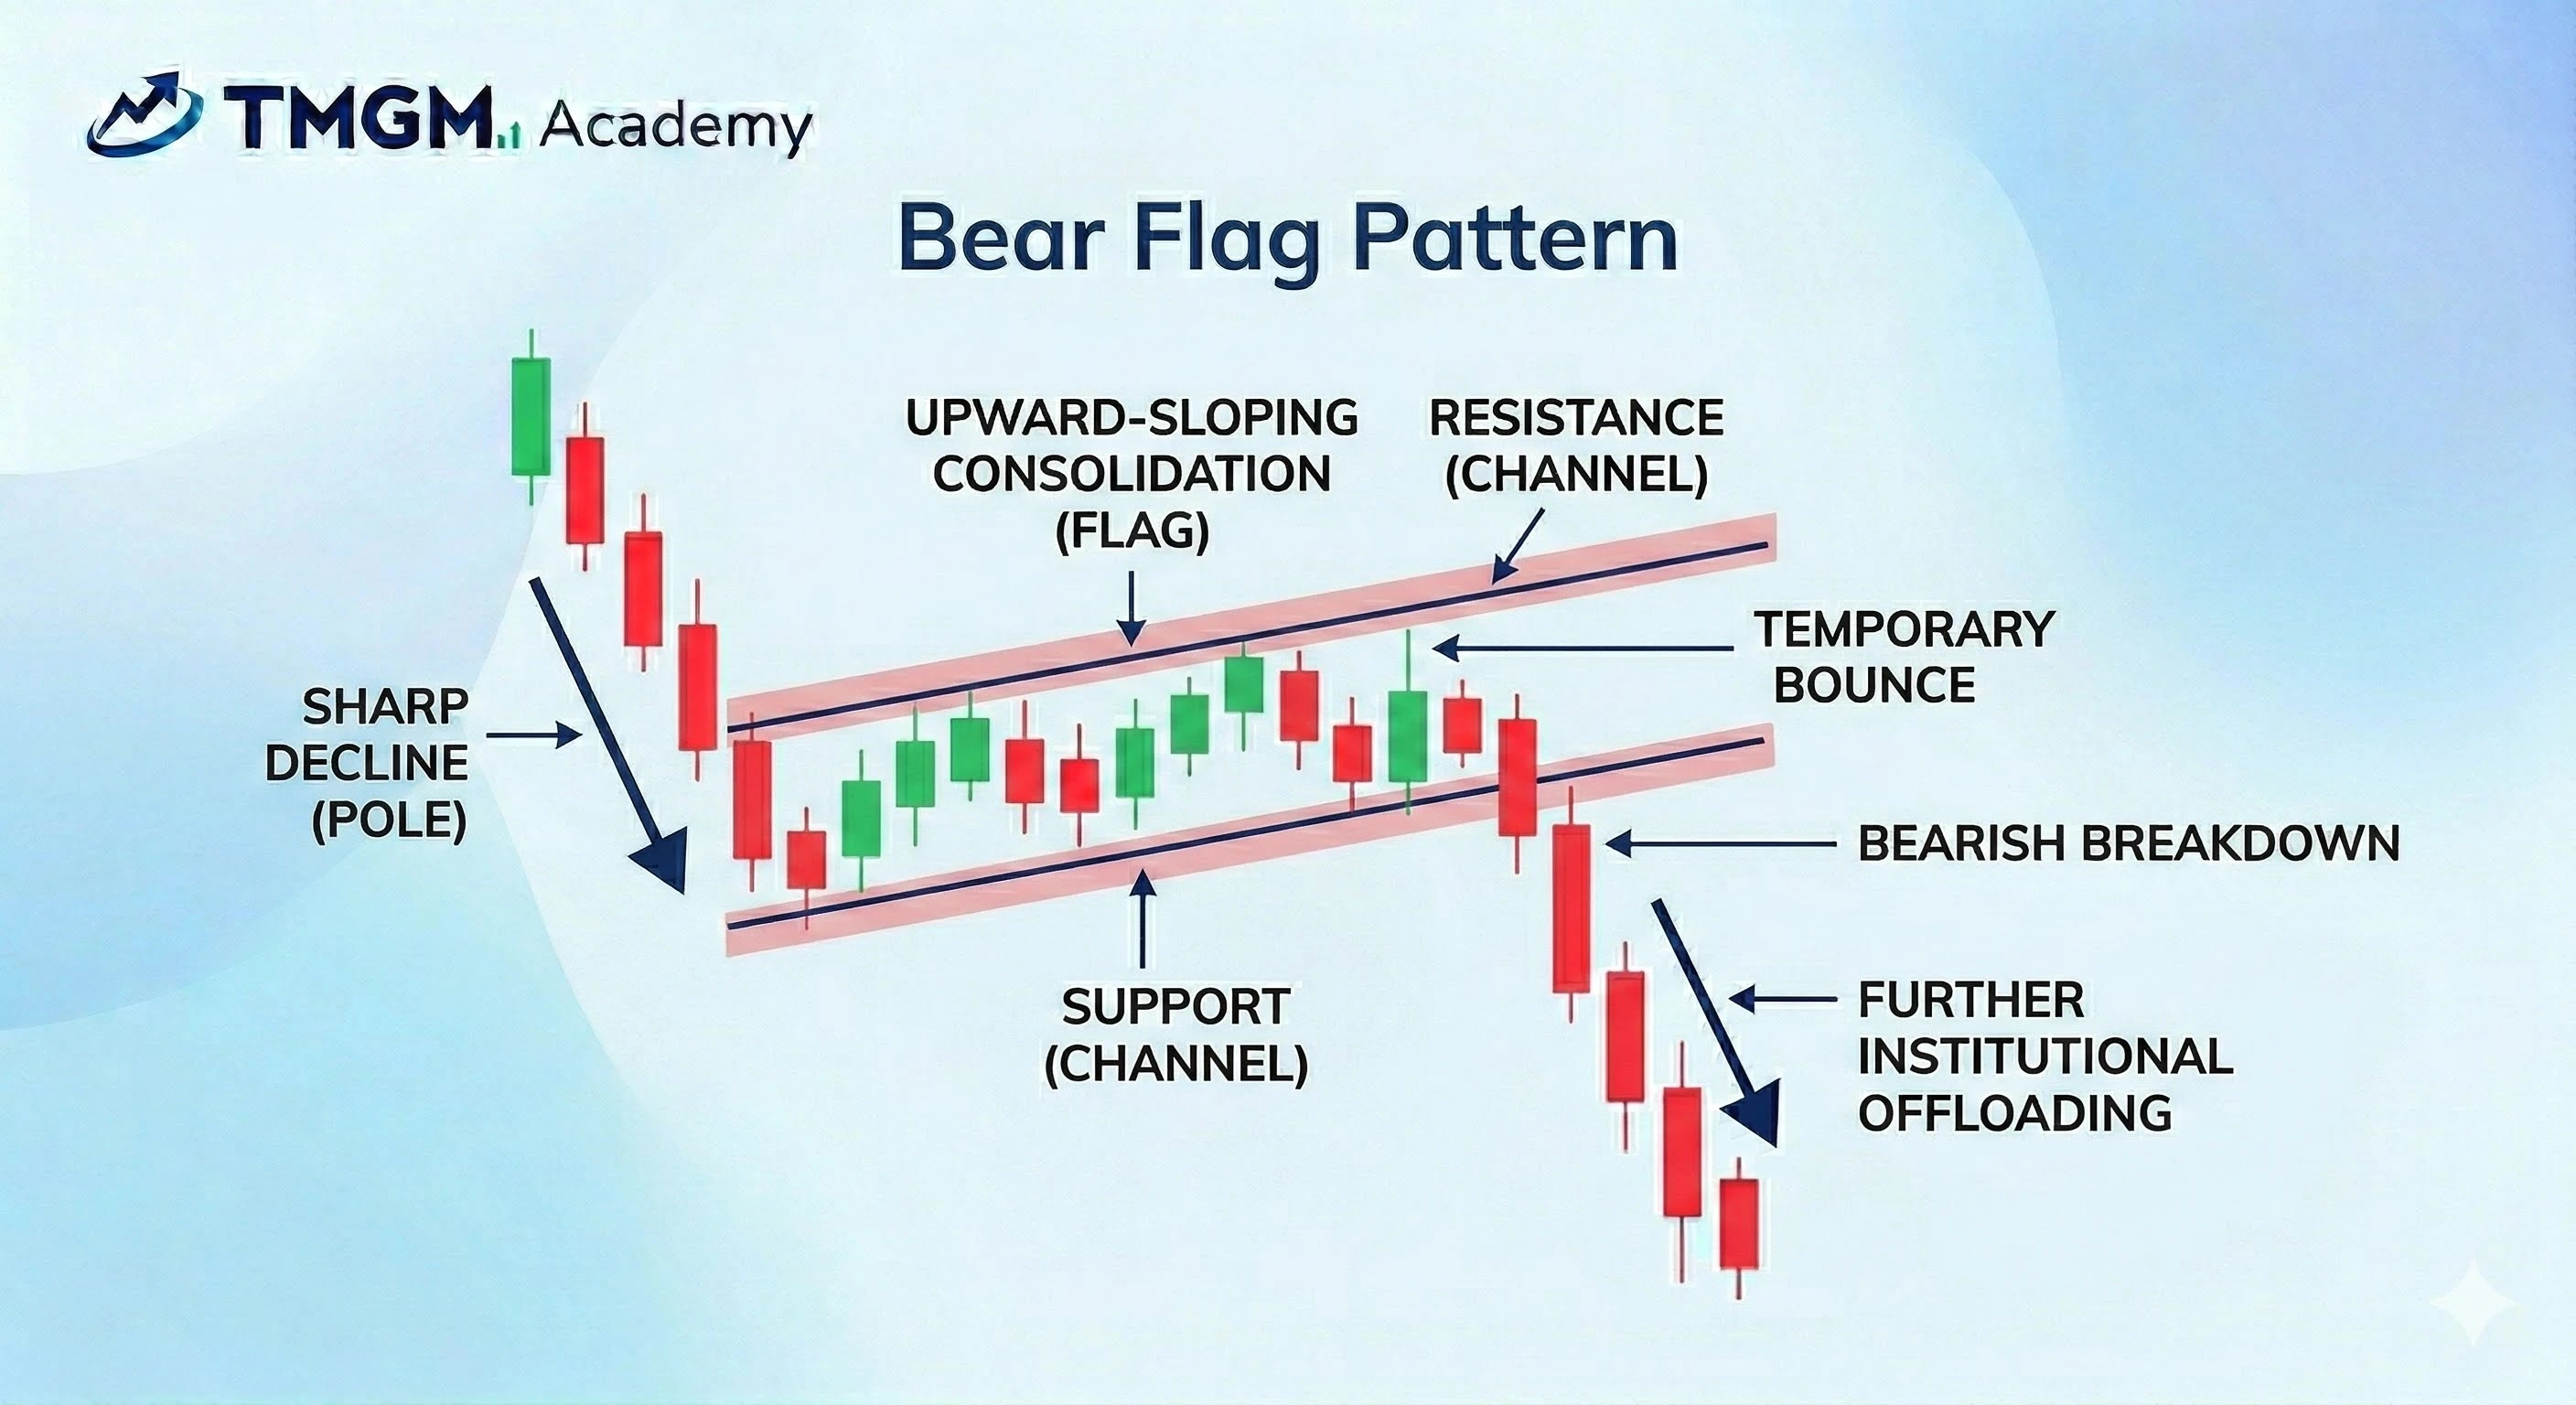
약세 플래그 패턴:
급락(플래그폴) 이후 형성되는 상향 경사 조정 구간(플래그)으로, 추가 매도세(브레이크아웃) 전 일시적 반등을 시사합니다.
강세 페넌트 및 약세 페넌트 차트 패턴:
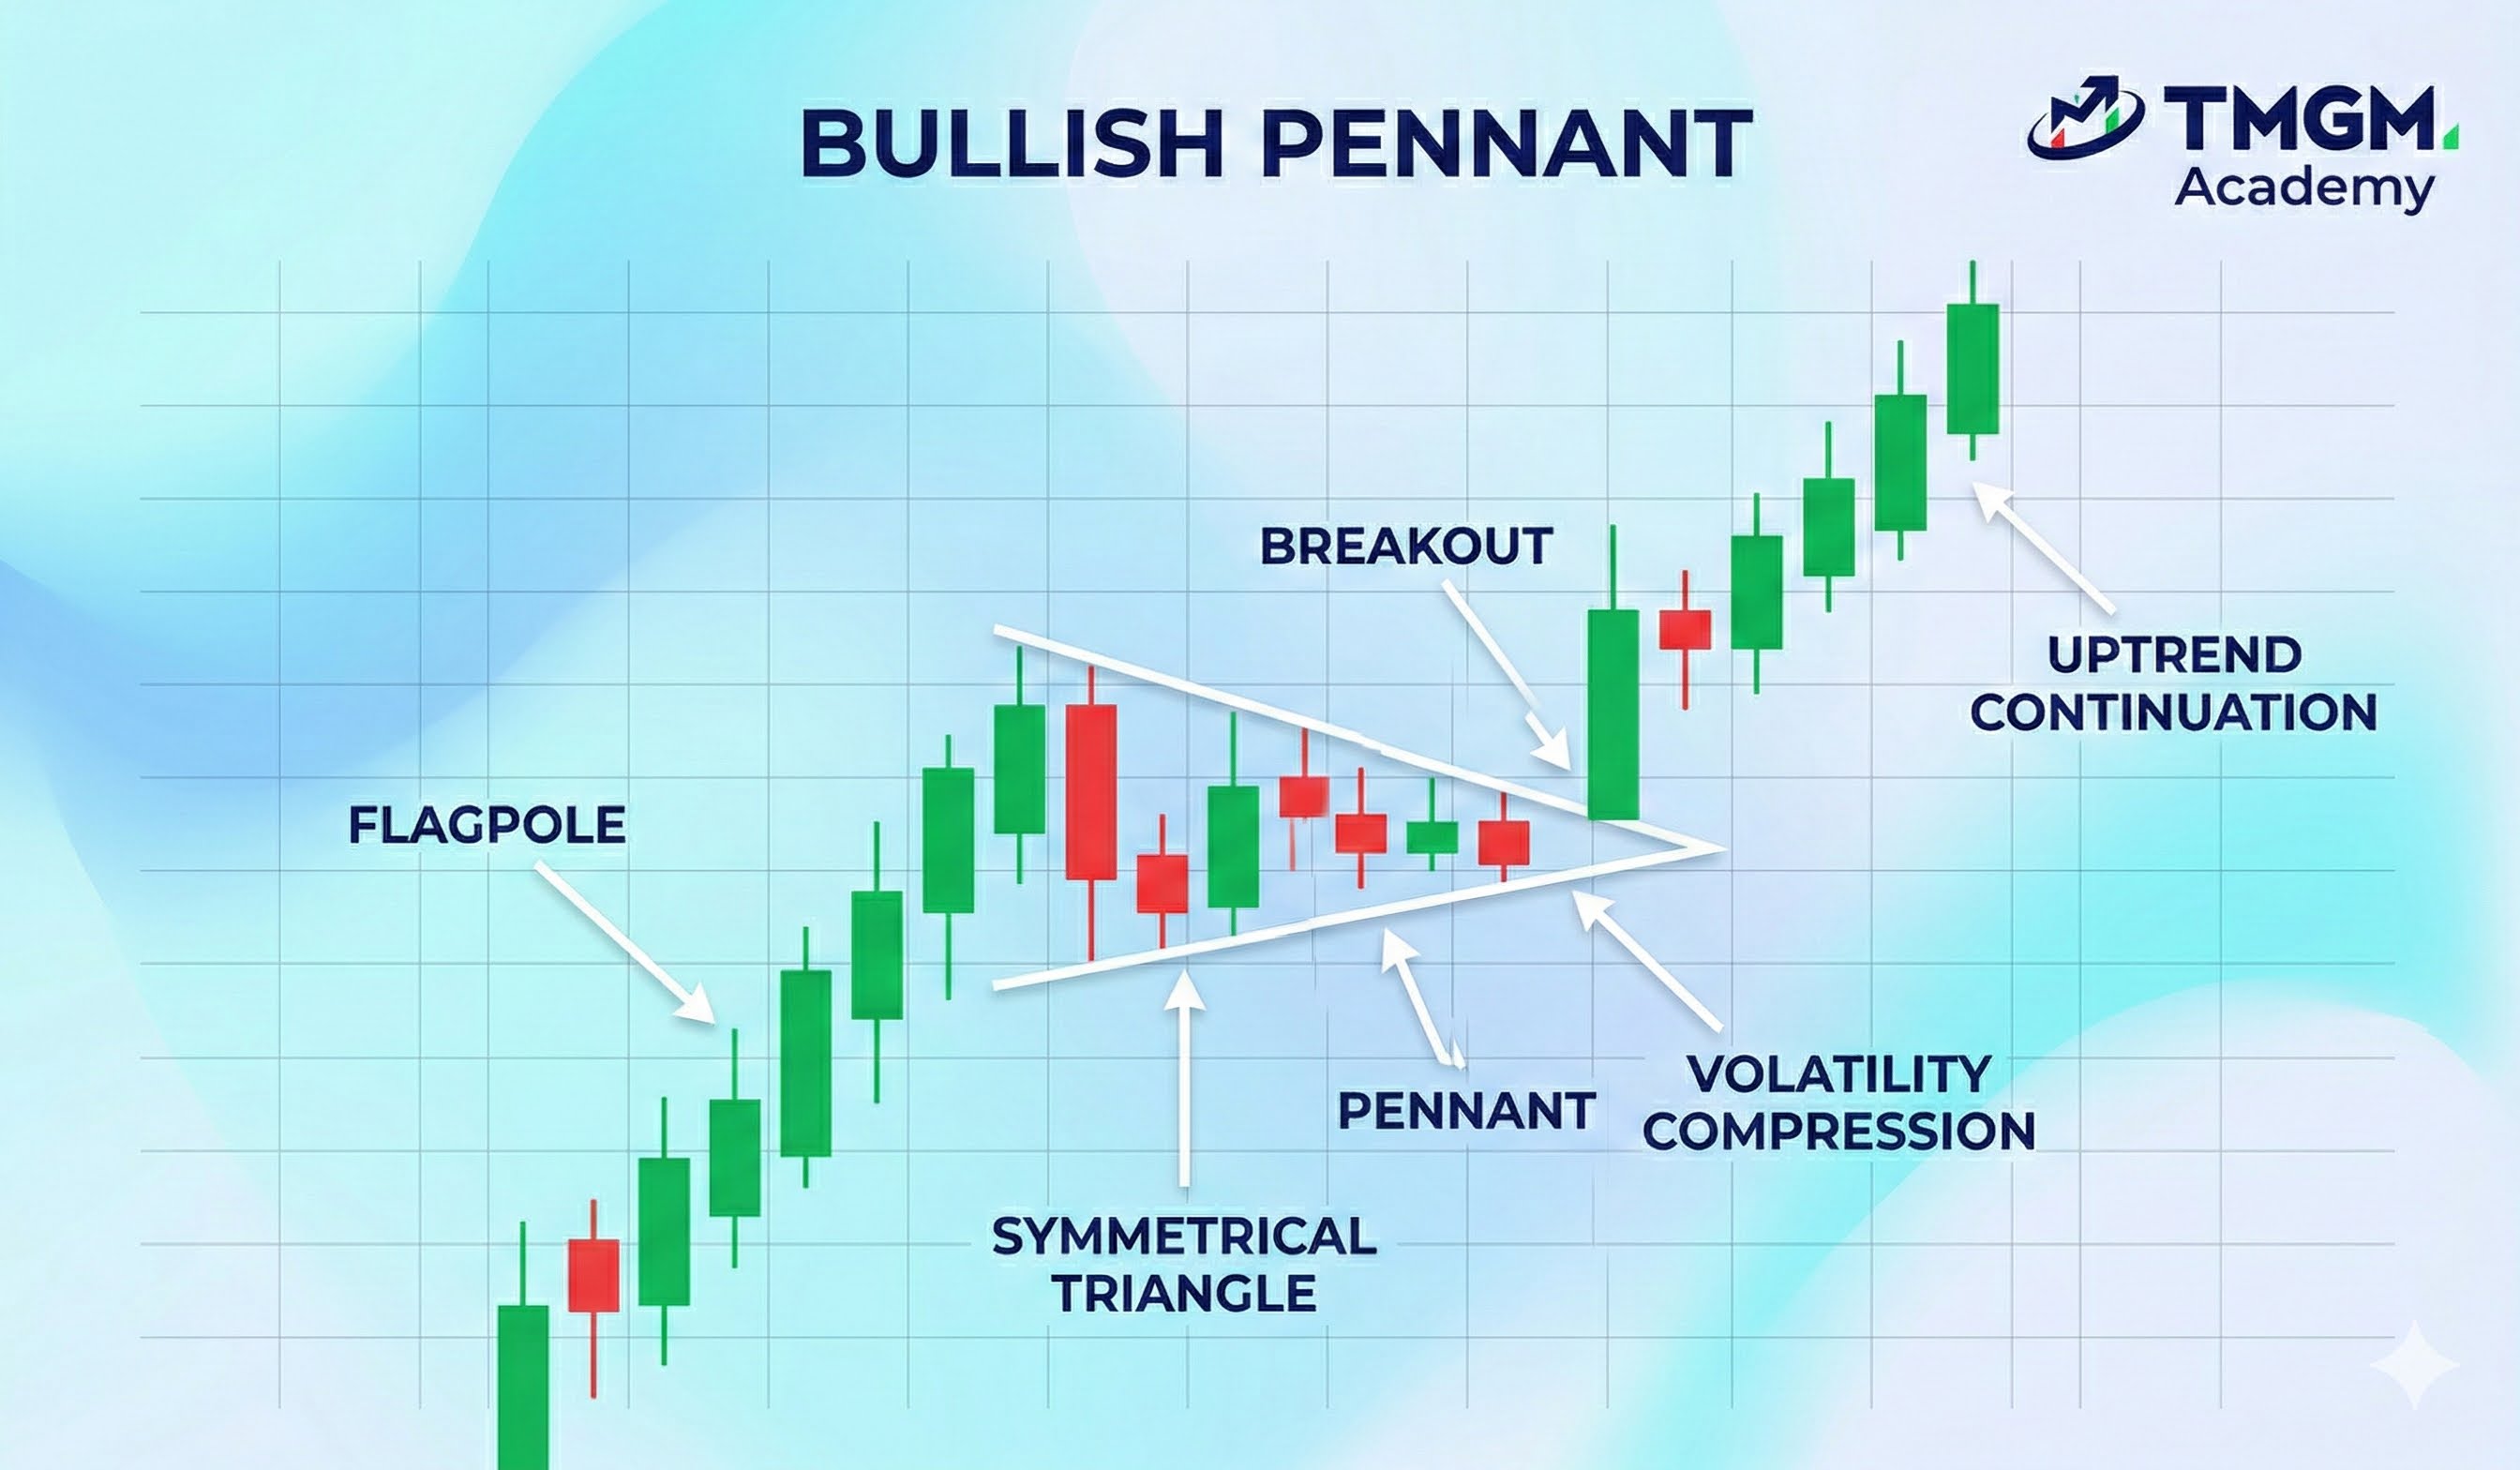
강세 페넌트:
강세 플래그폴 이후 형성되는 작은 대칭 삼각형(페넌트)으로, 극심한 변동성 압축(가격 수렴)이 특징입니다.
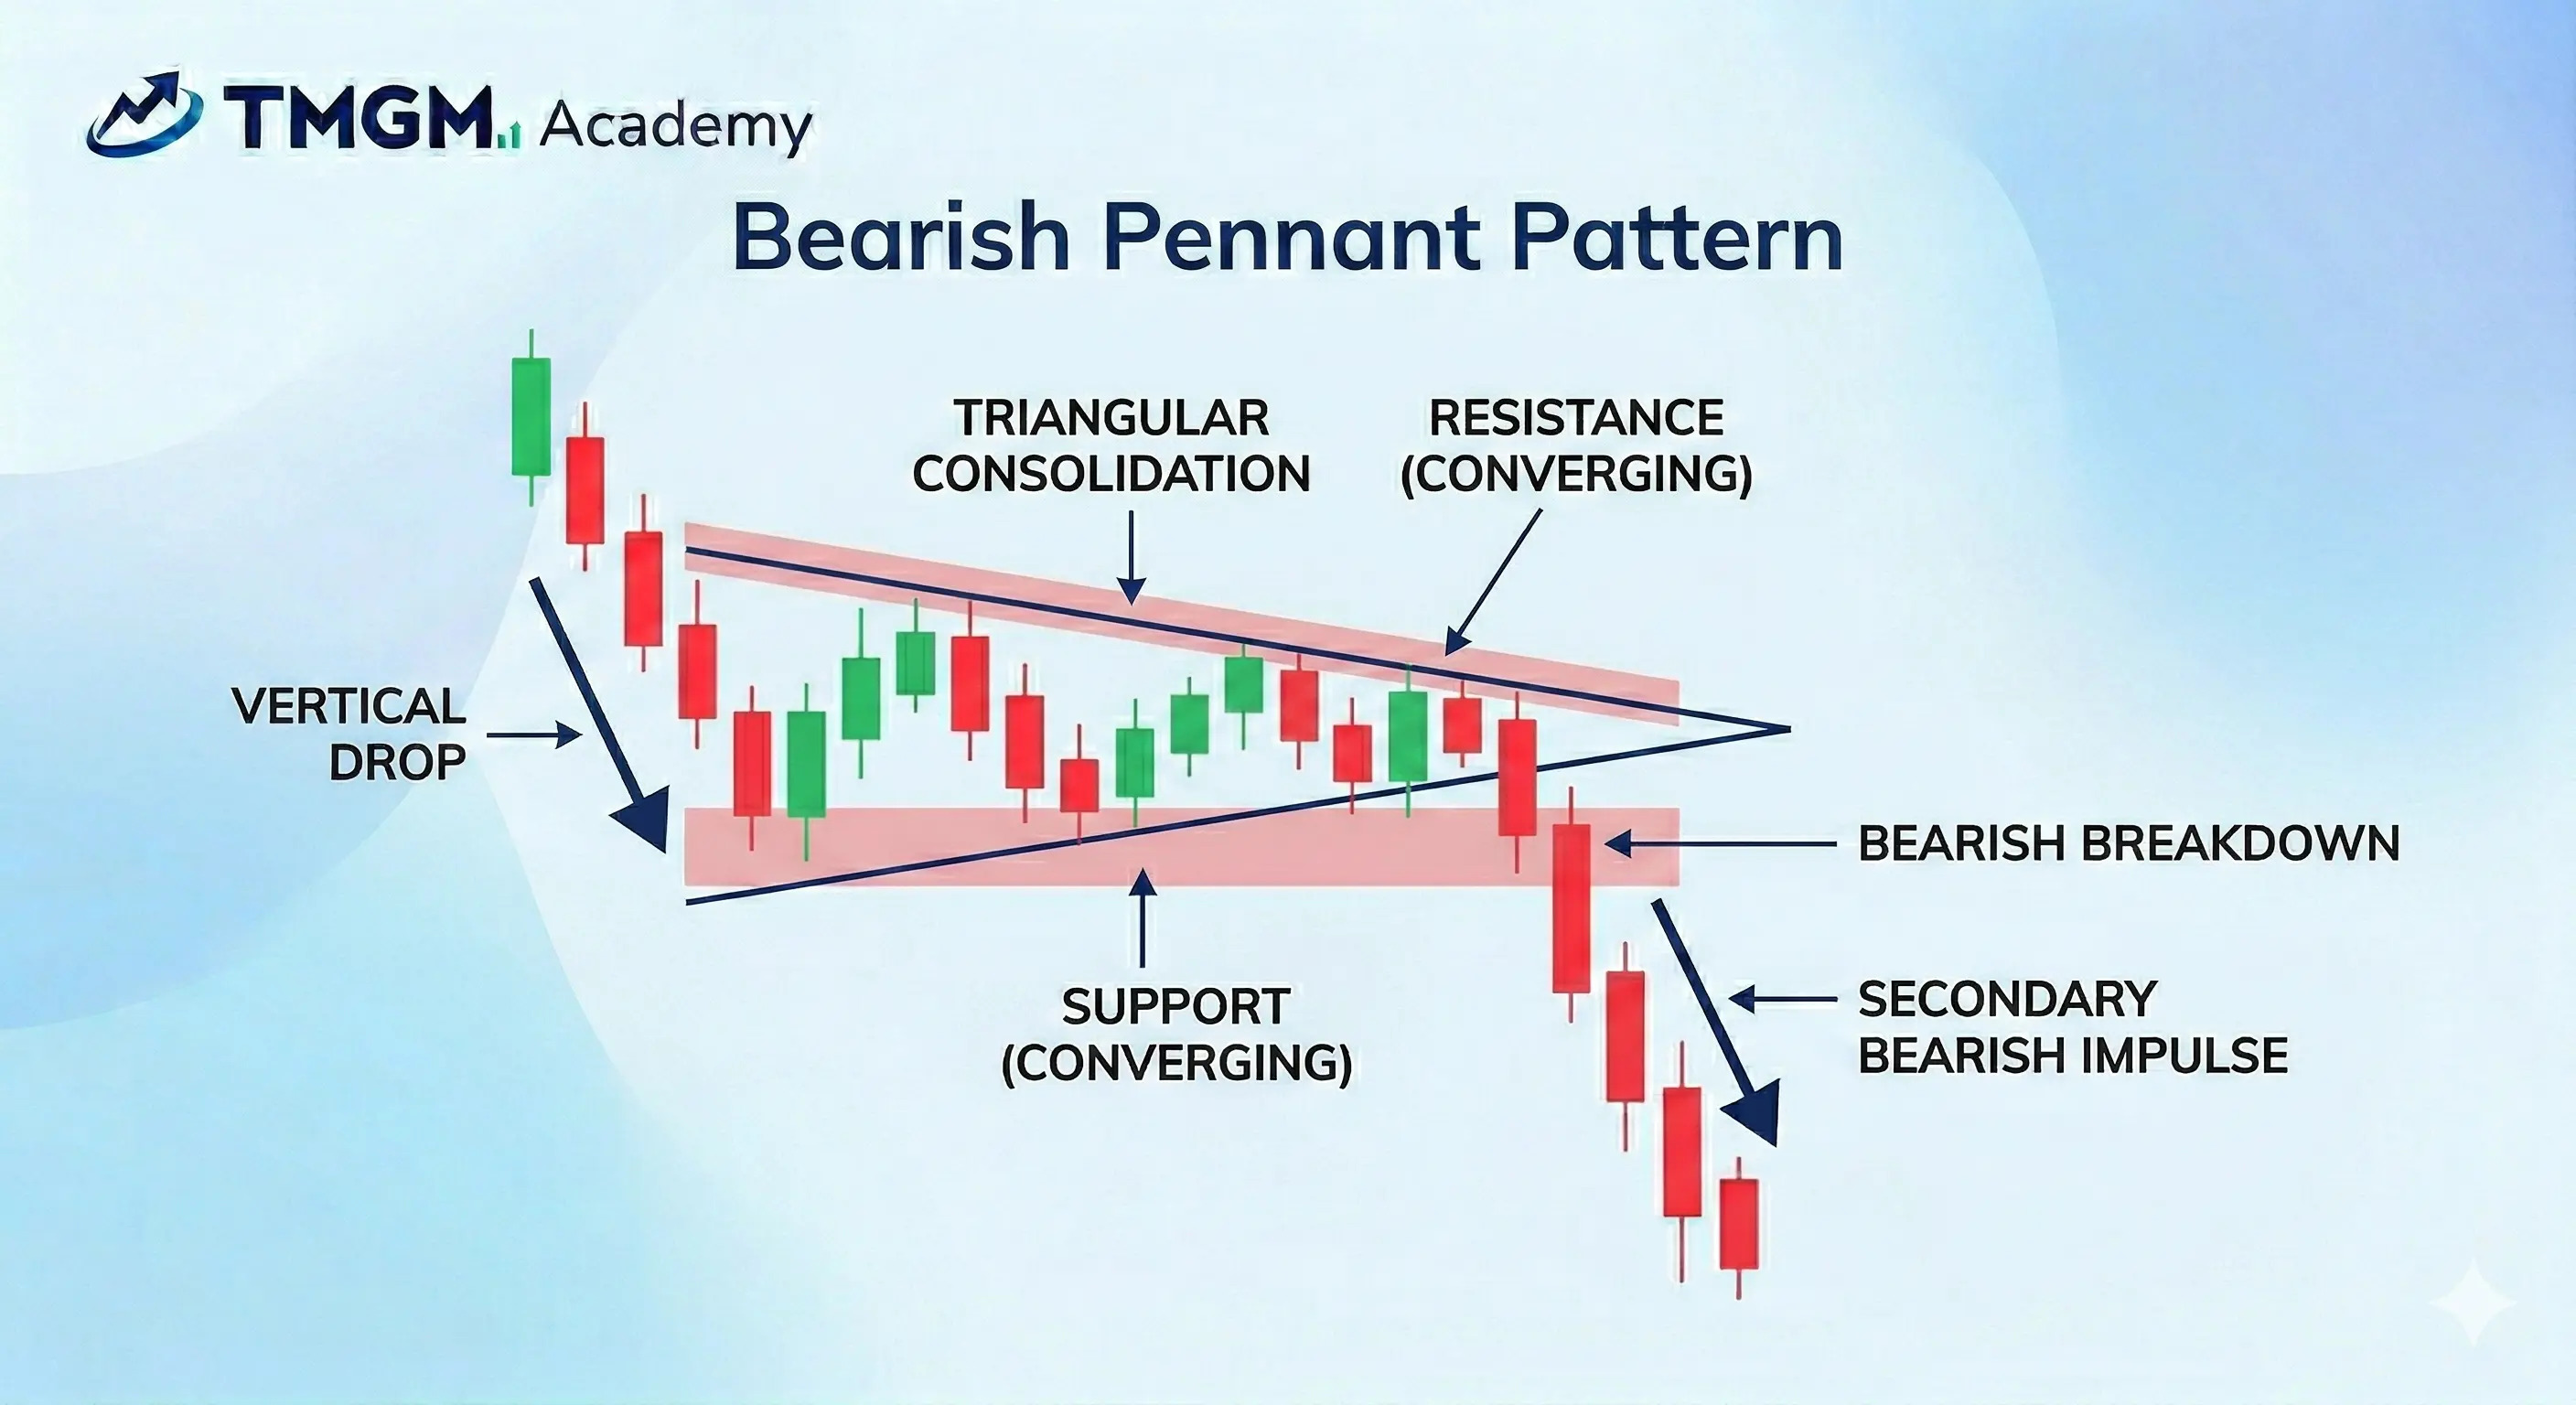
약세 페넌트 패턴:
수직 하락(폴) 이후 형성되는 짧은 삼각형 조정 구간(페넌트)으로, 2차 약세 충동(브레이크아웃)의 기반을 마련합니다.
강세 & 약세 직사각형 차트 패턴
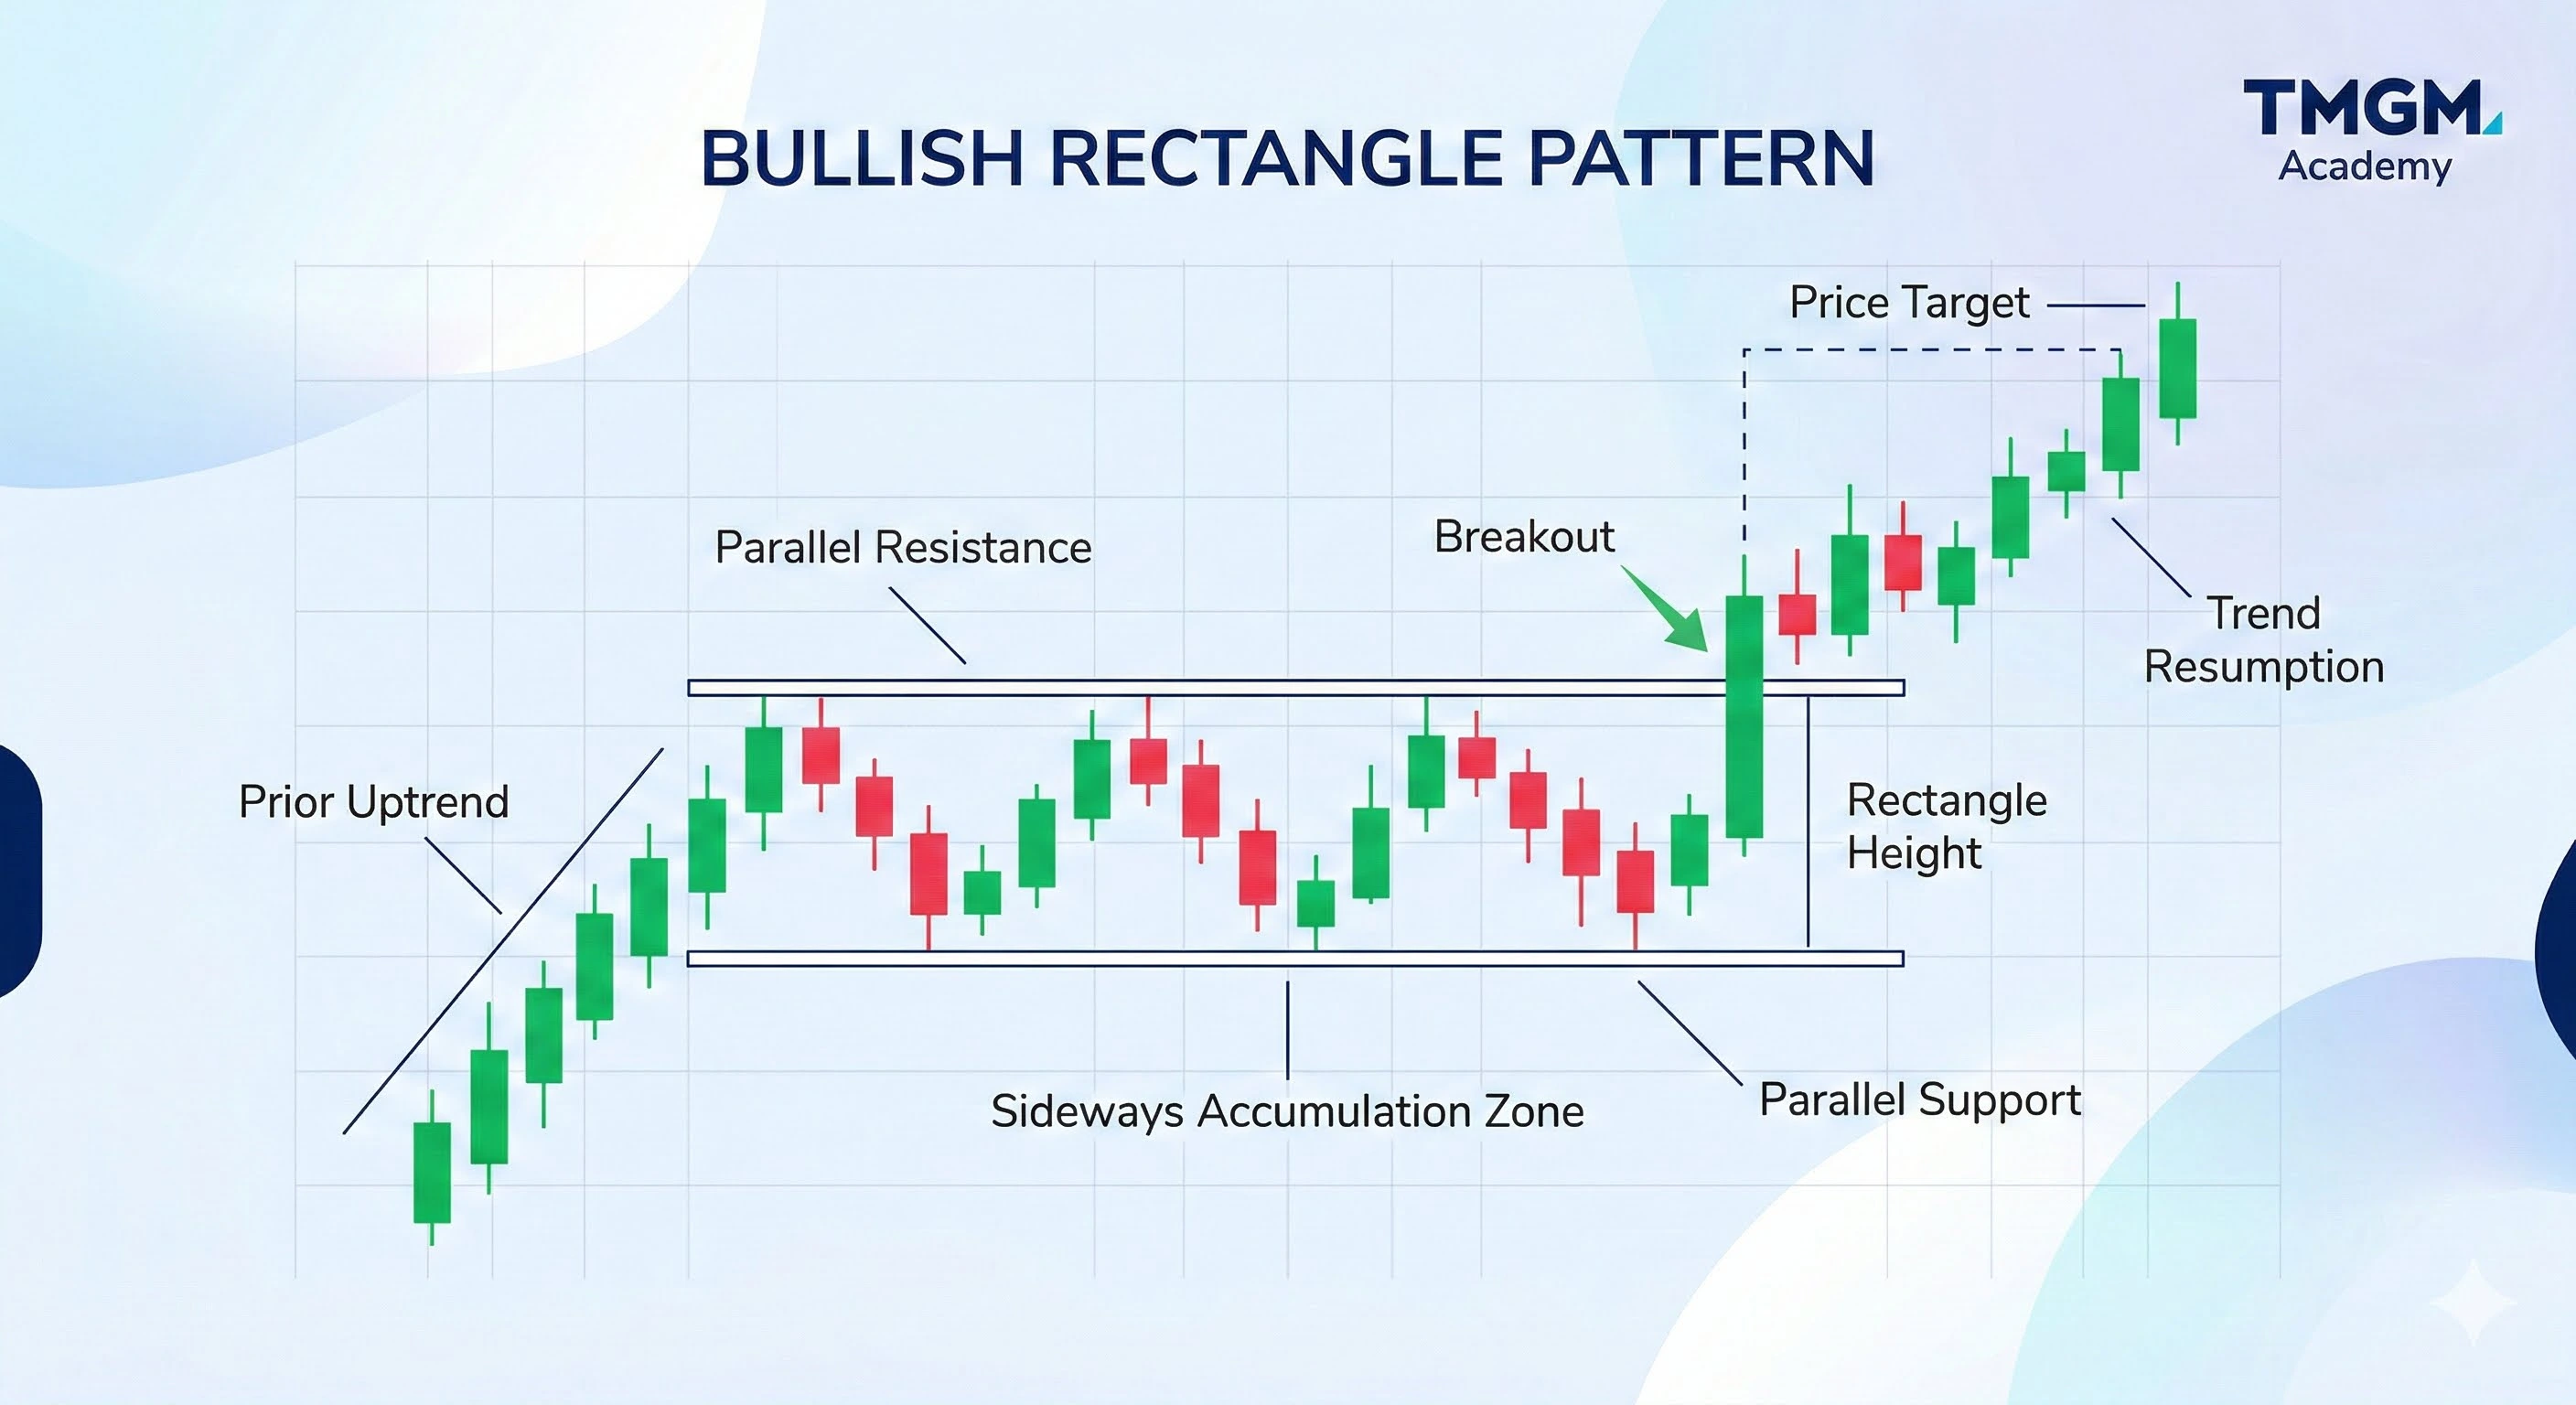
강세 직사각형 패턴:
평행한 지지선과 저항선 사이에서 형성되는 횡보형 매집 구간(직사각형)으로, 이전 상승 추세 방향으로 마무리됩니다.
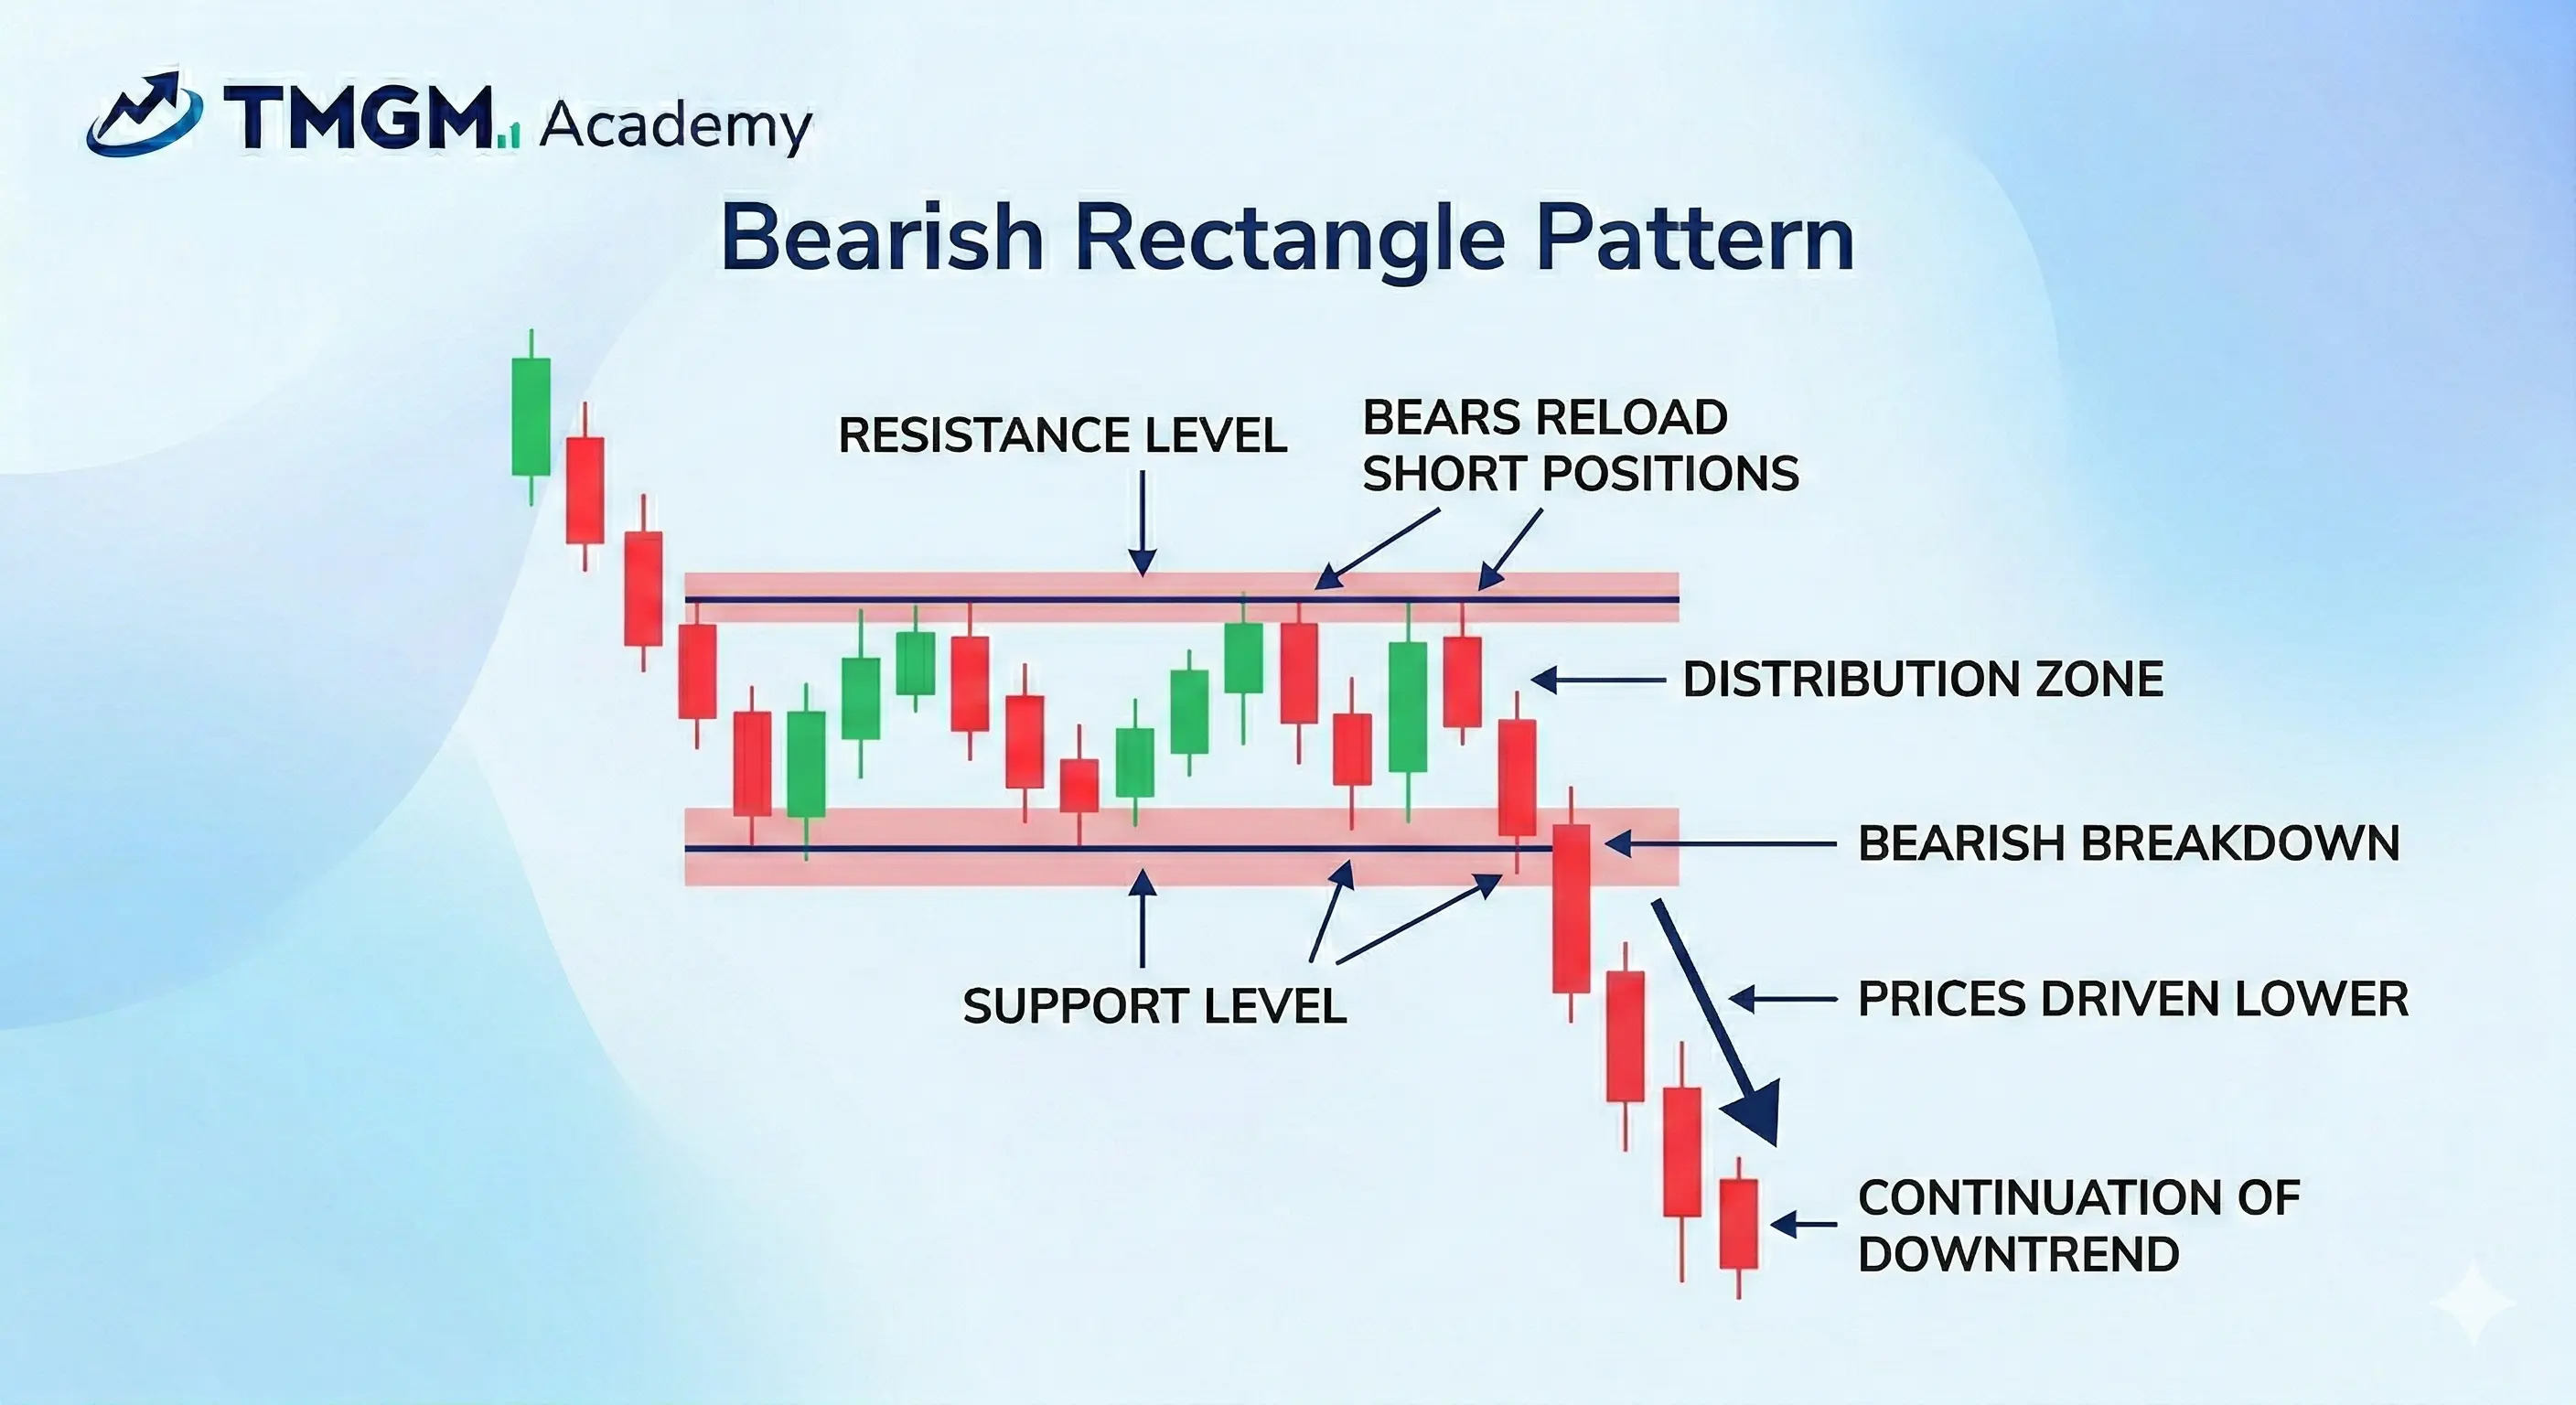
약세 직사각형 패턴:
매도 세력이 가격을 더 낮추기 전에 숏 포지션을 다시 구축하는 횡보형 분산 채널(직사각형)입니다.
반전형 차트 패턴
반전형 패턴은 주요 유동성 구간에서 형성되며, 기관의 방향성 편향이 완전히 전환되고 있음을 나타냅니다. 이는 매집에서 상승 국면으로, 또는 분산에서 하락 국면으로의 전환을 의미합니다.
헤드 앤 숄더 차트 패턴들
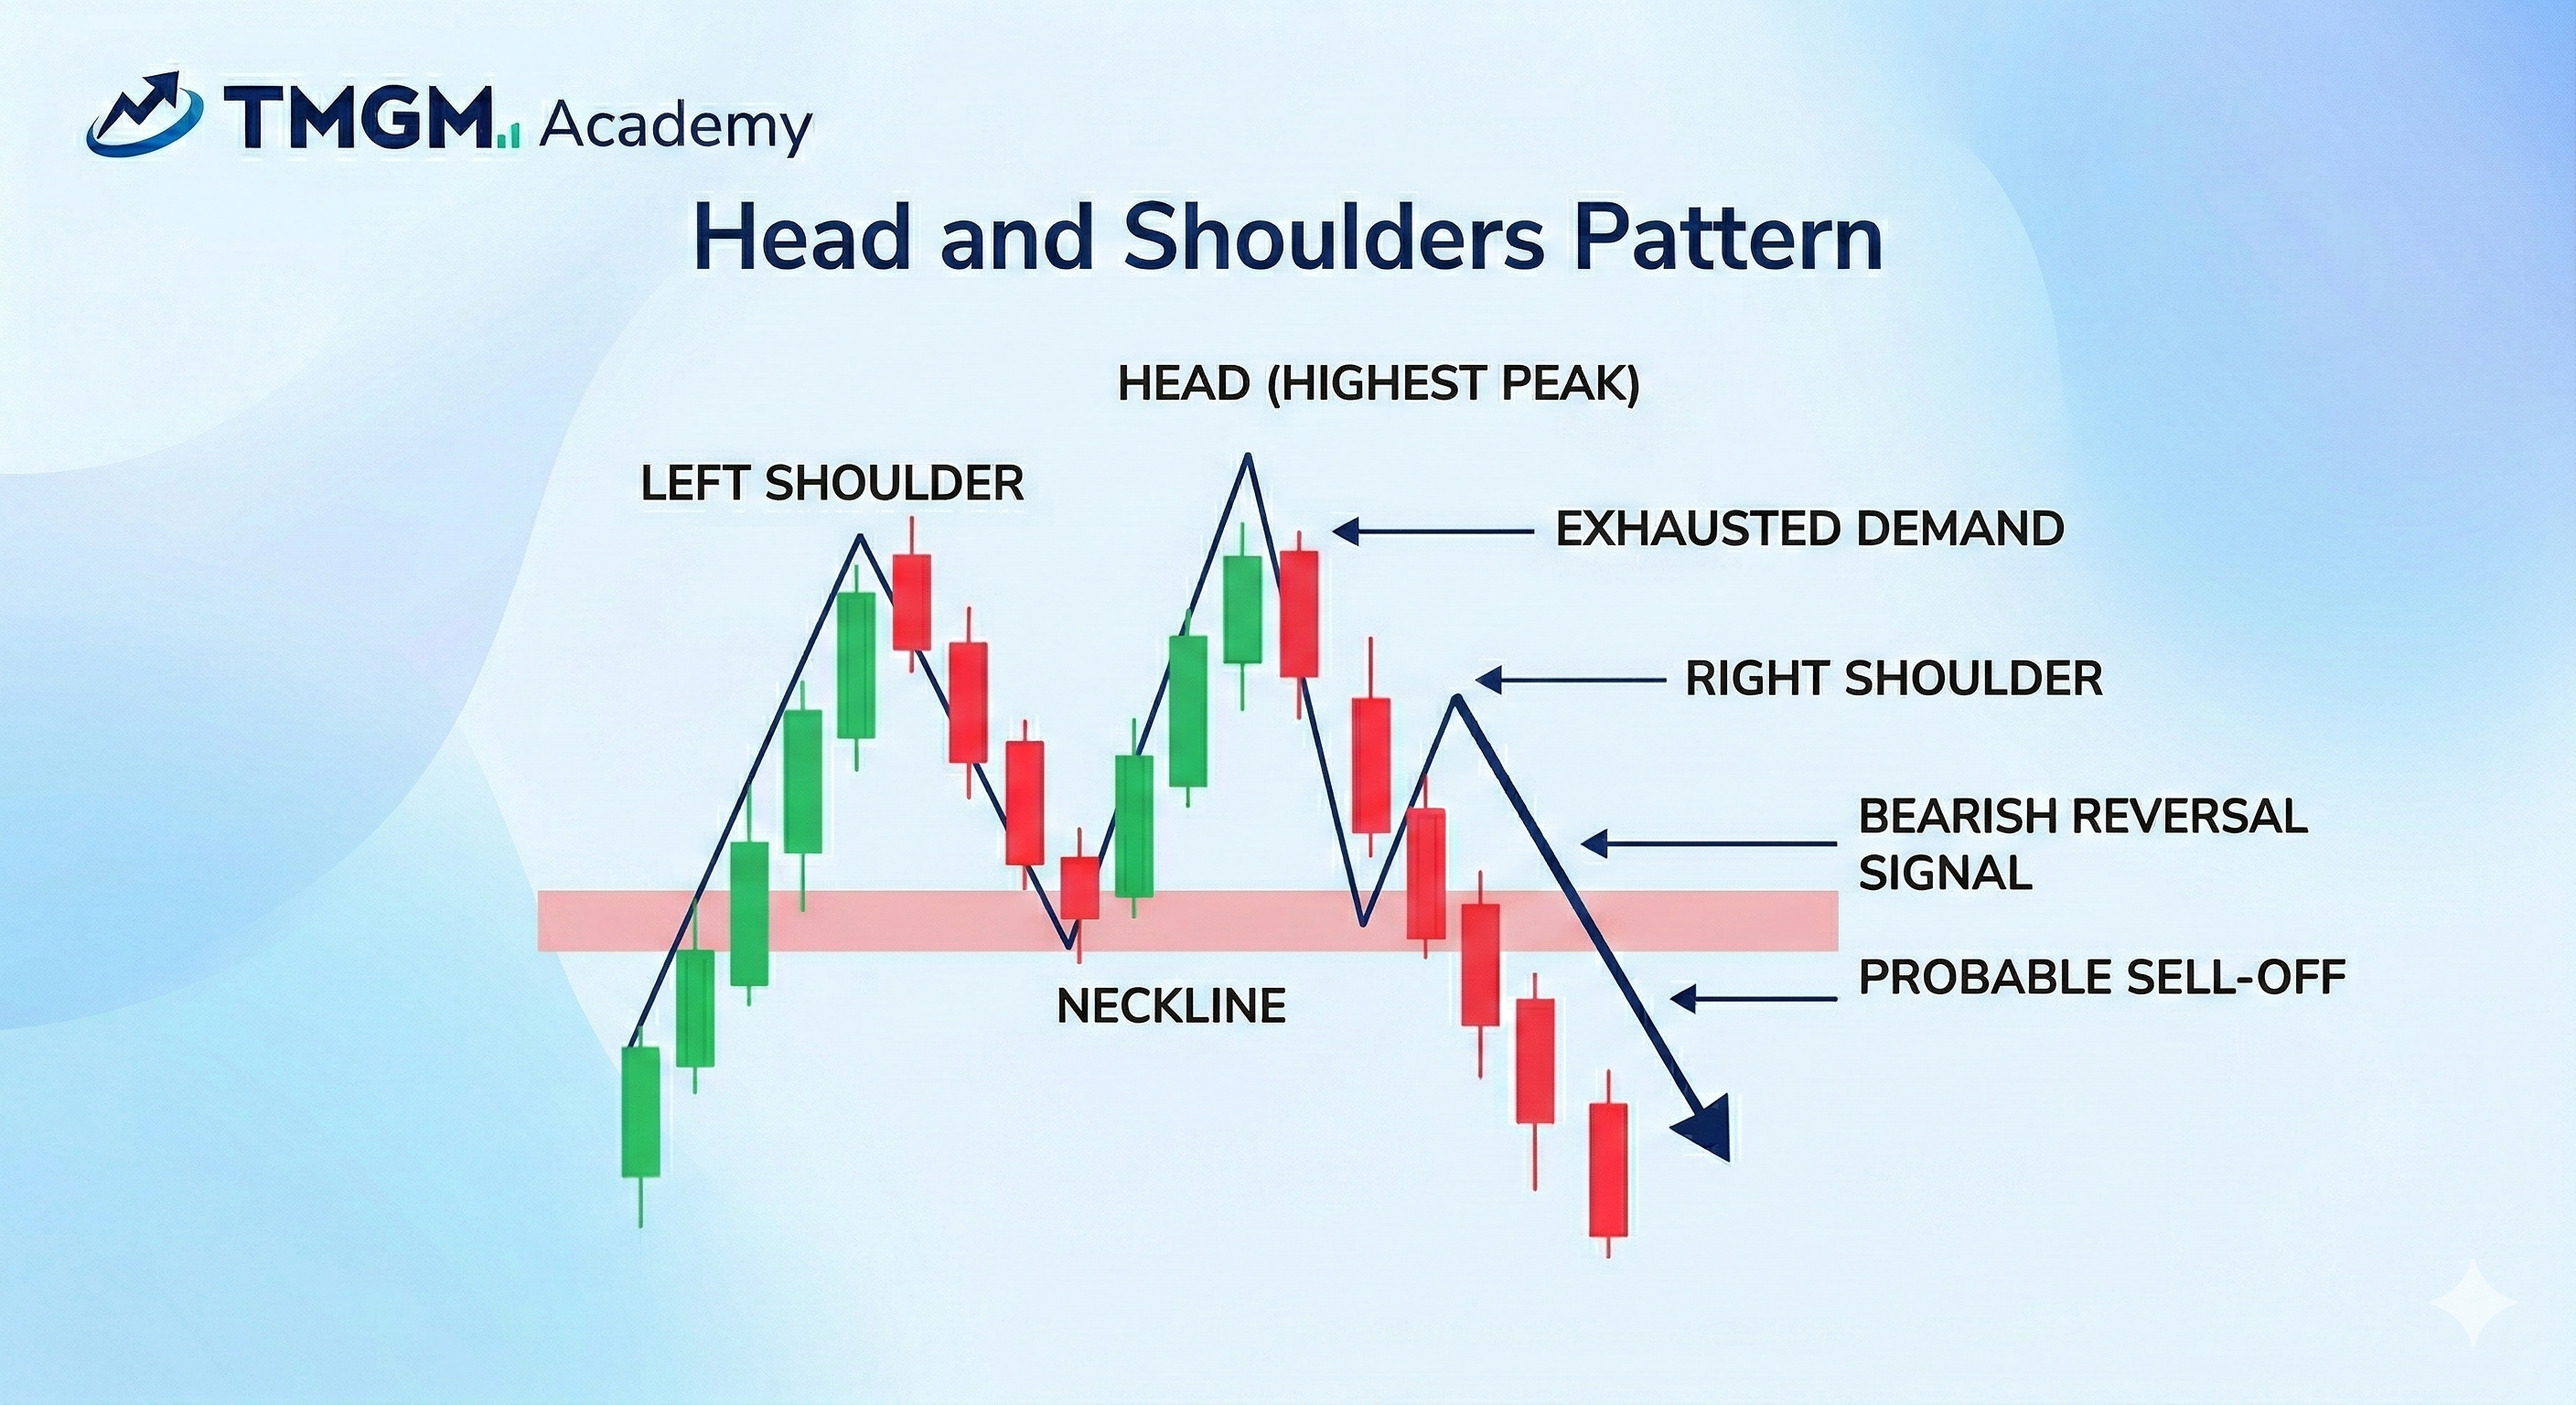
헤드 앤 숄더 패턴:
세 개의 고점(헤드 앤 숄더)으로 구성된 약세 반전 패턴으로, 중앙 고점(헤드)이 가장 높으며 매수세 소진을 시사합니다.
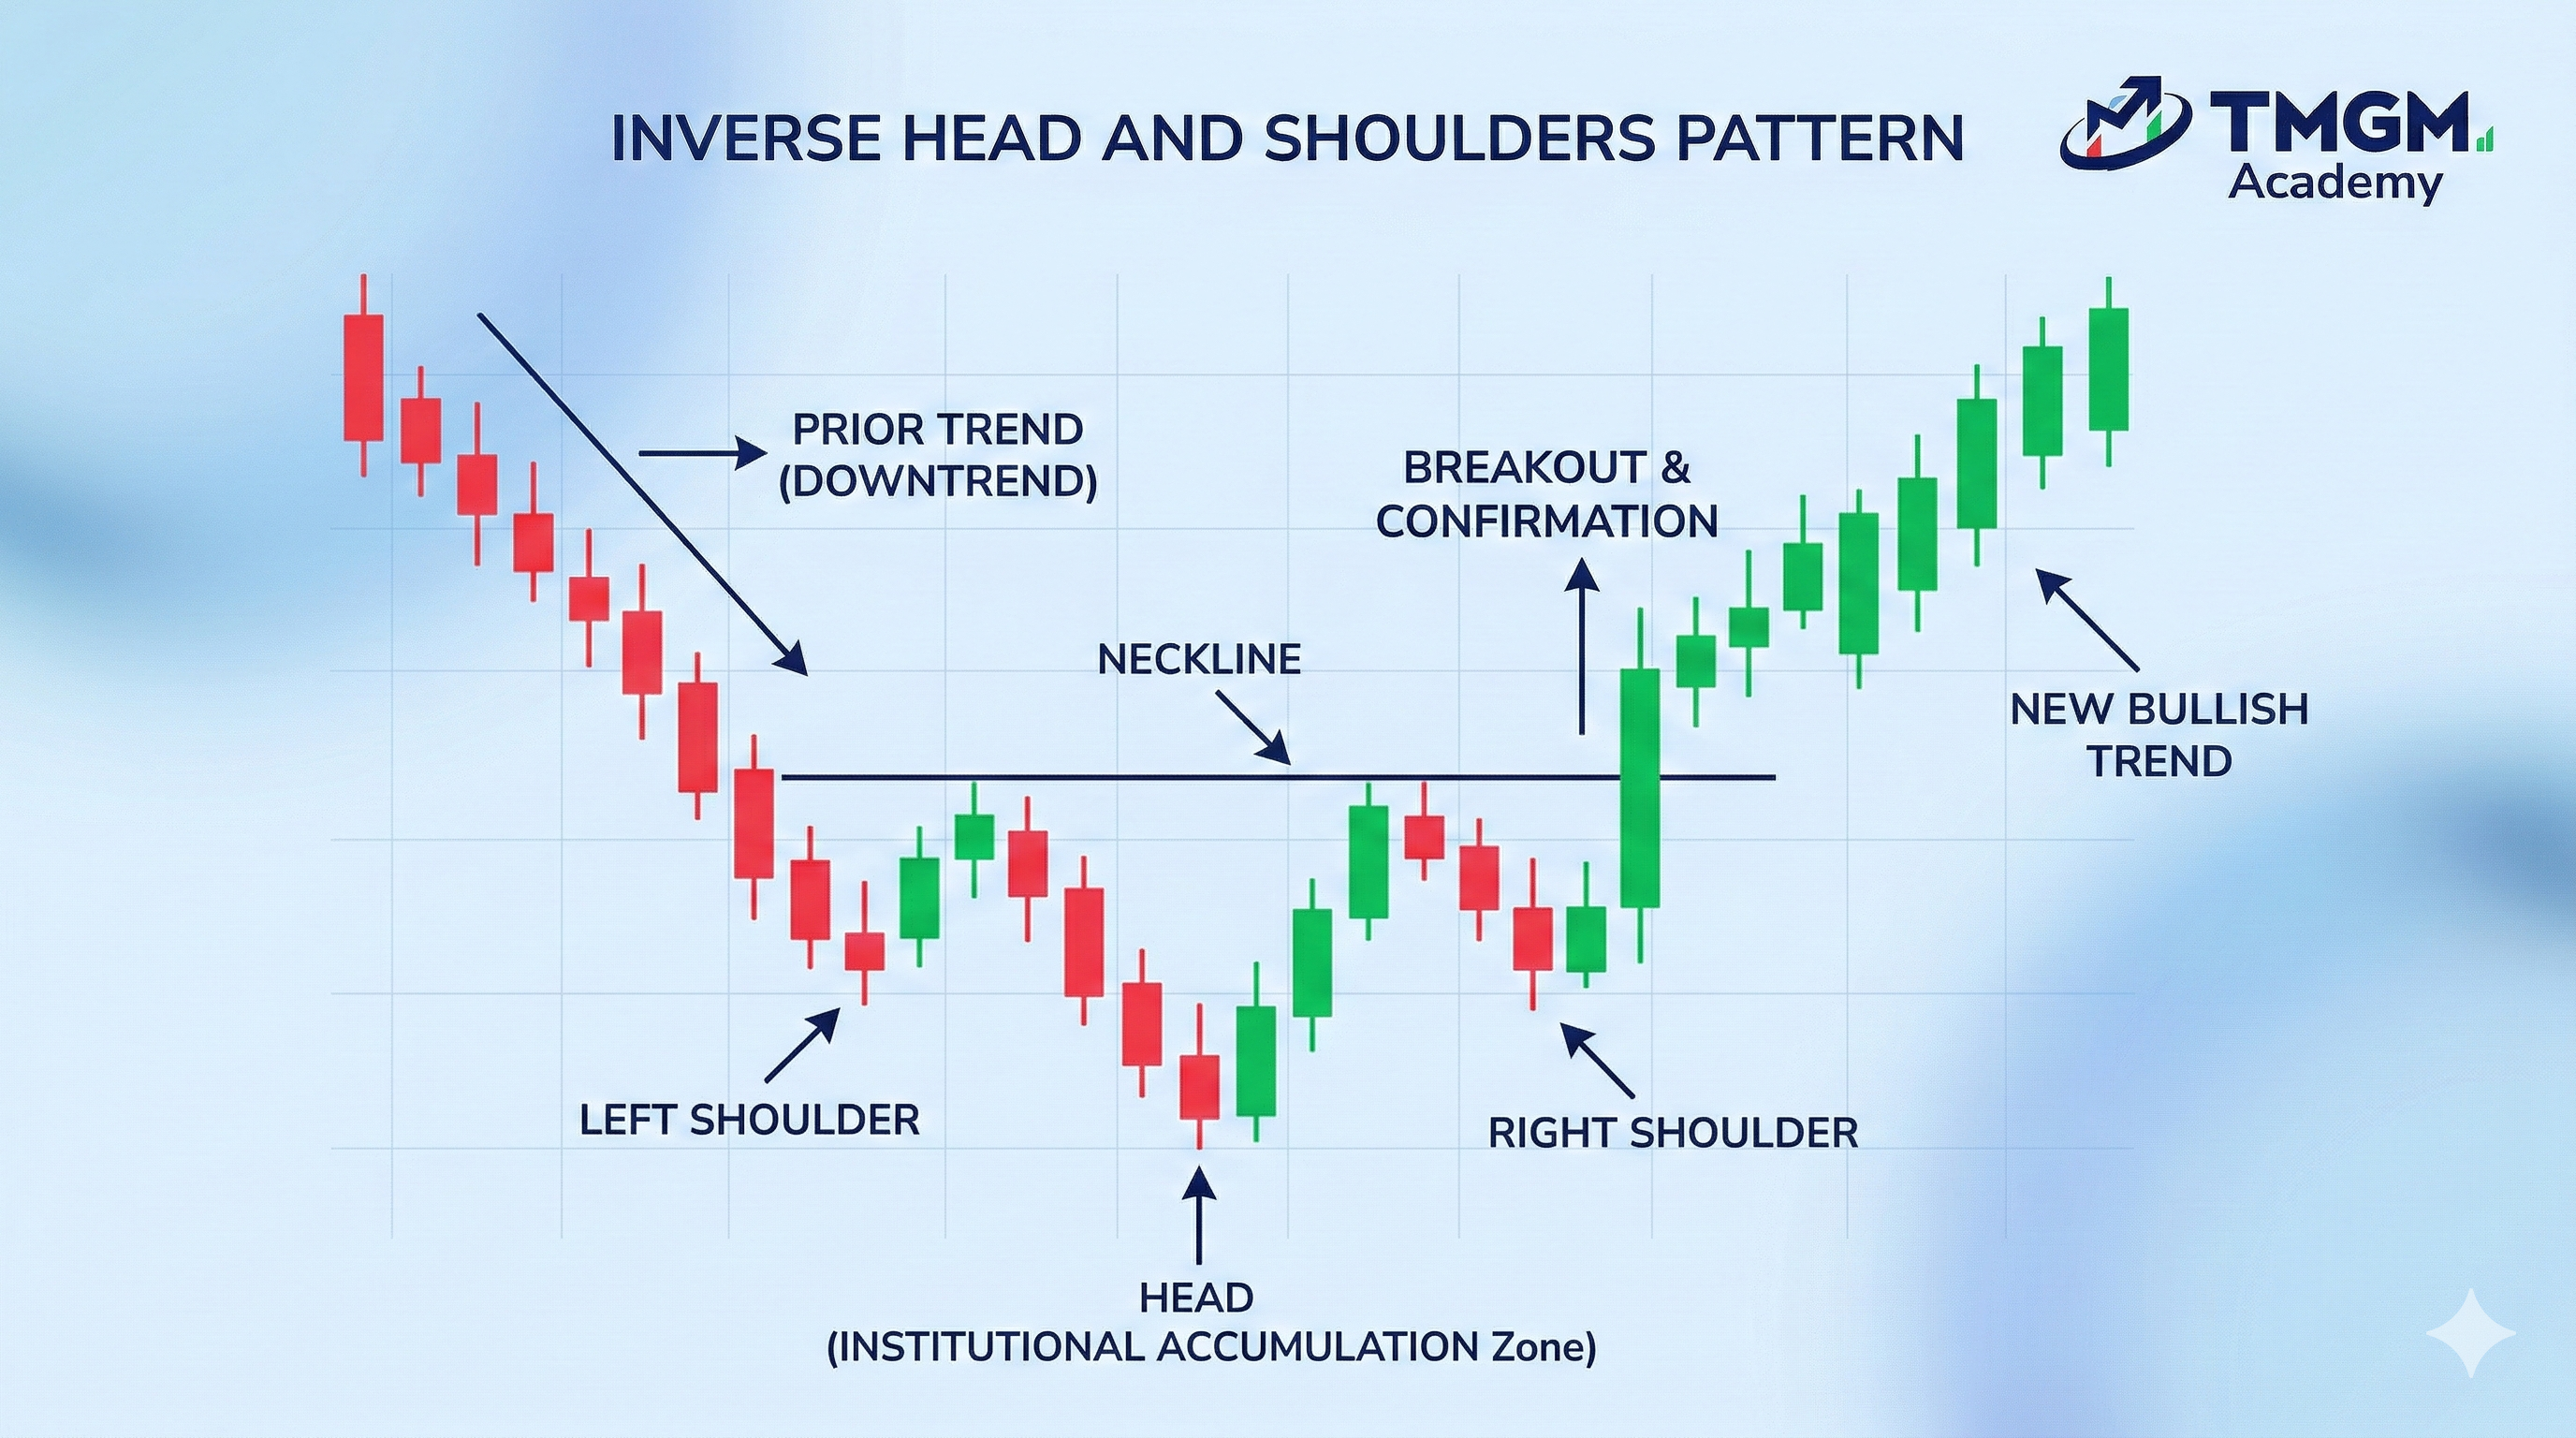
역헤드 앤 숄더 패턴:
세 개의 저점(역헤드 앤 숄더)으로 구성된 강세 반전 패턴으로, 넥라인 아래에서 기관의 공격적인 매집(숄더)을 시사합니다.
더블 탑 및 더블 바텀 패턴:
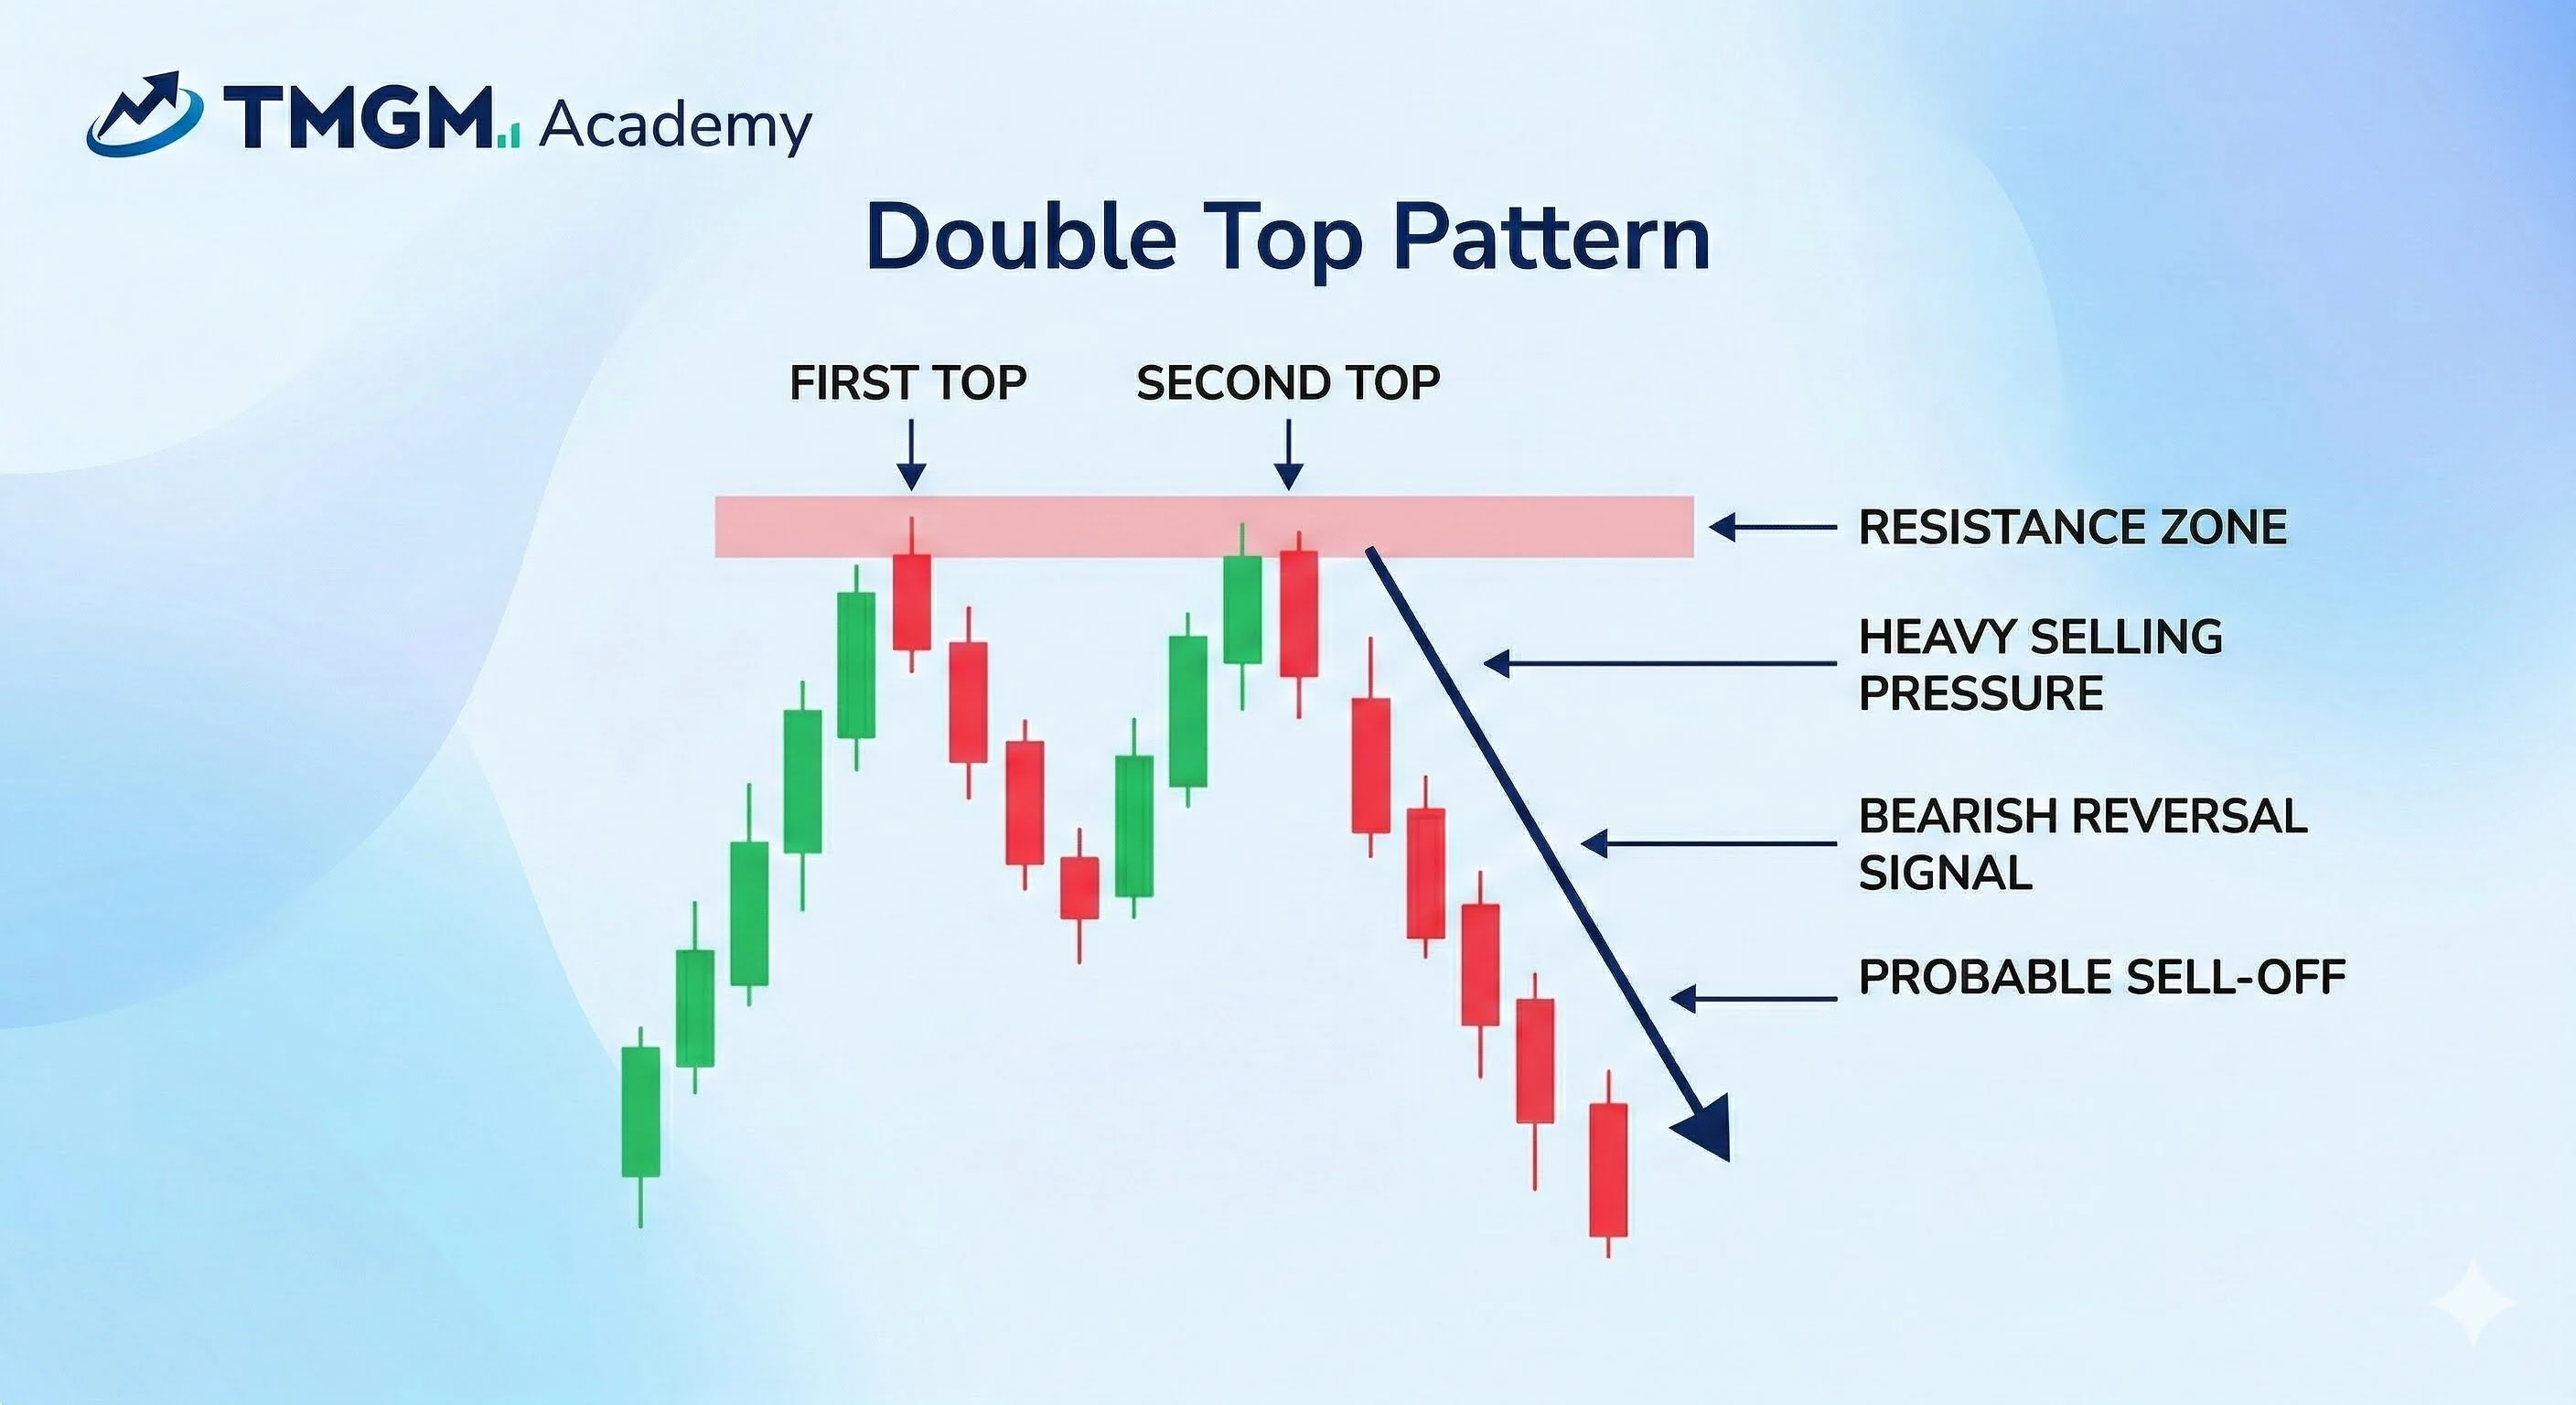
더블 탑 패턴:
저항선을 돌파하려는 두 차례 연속 실패(더블 탑)로 형성되는 "M"자 형태의 패턴으로, 이후 약세 매도세가 뒤따릅니다.
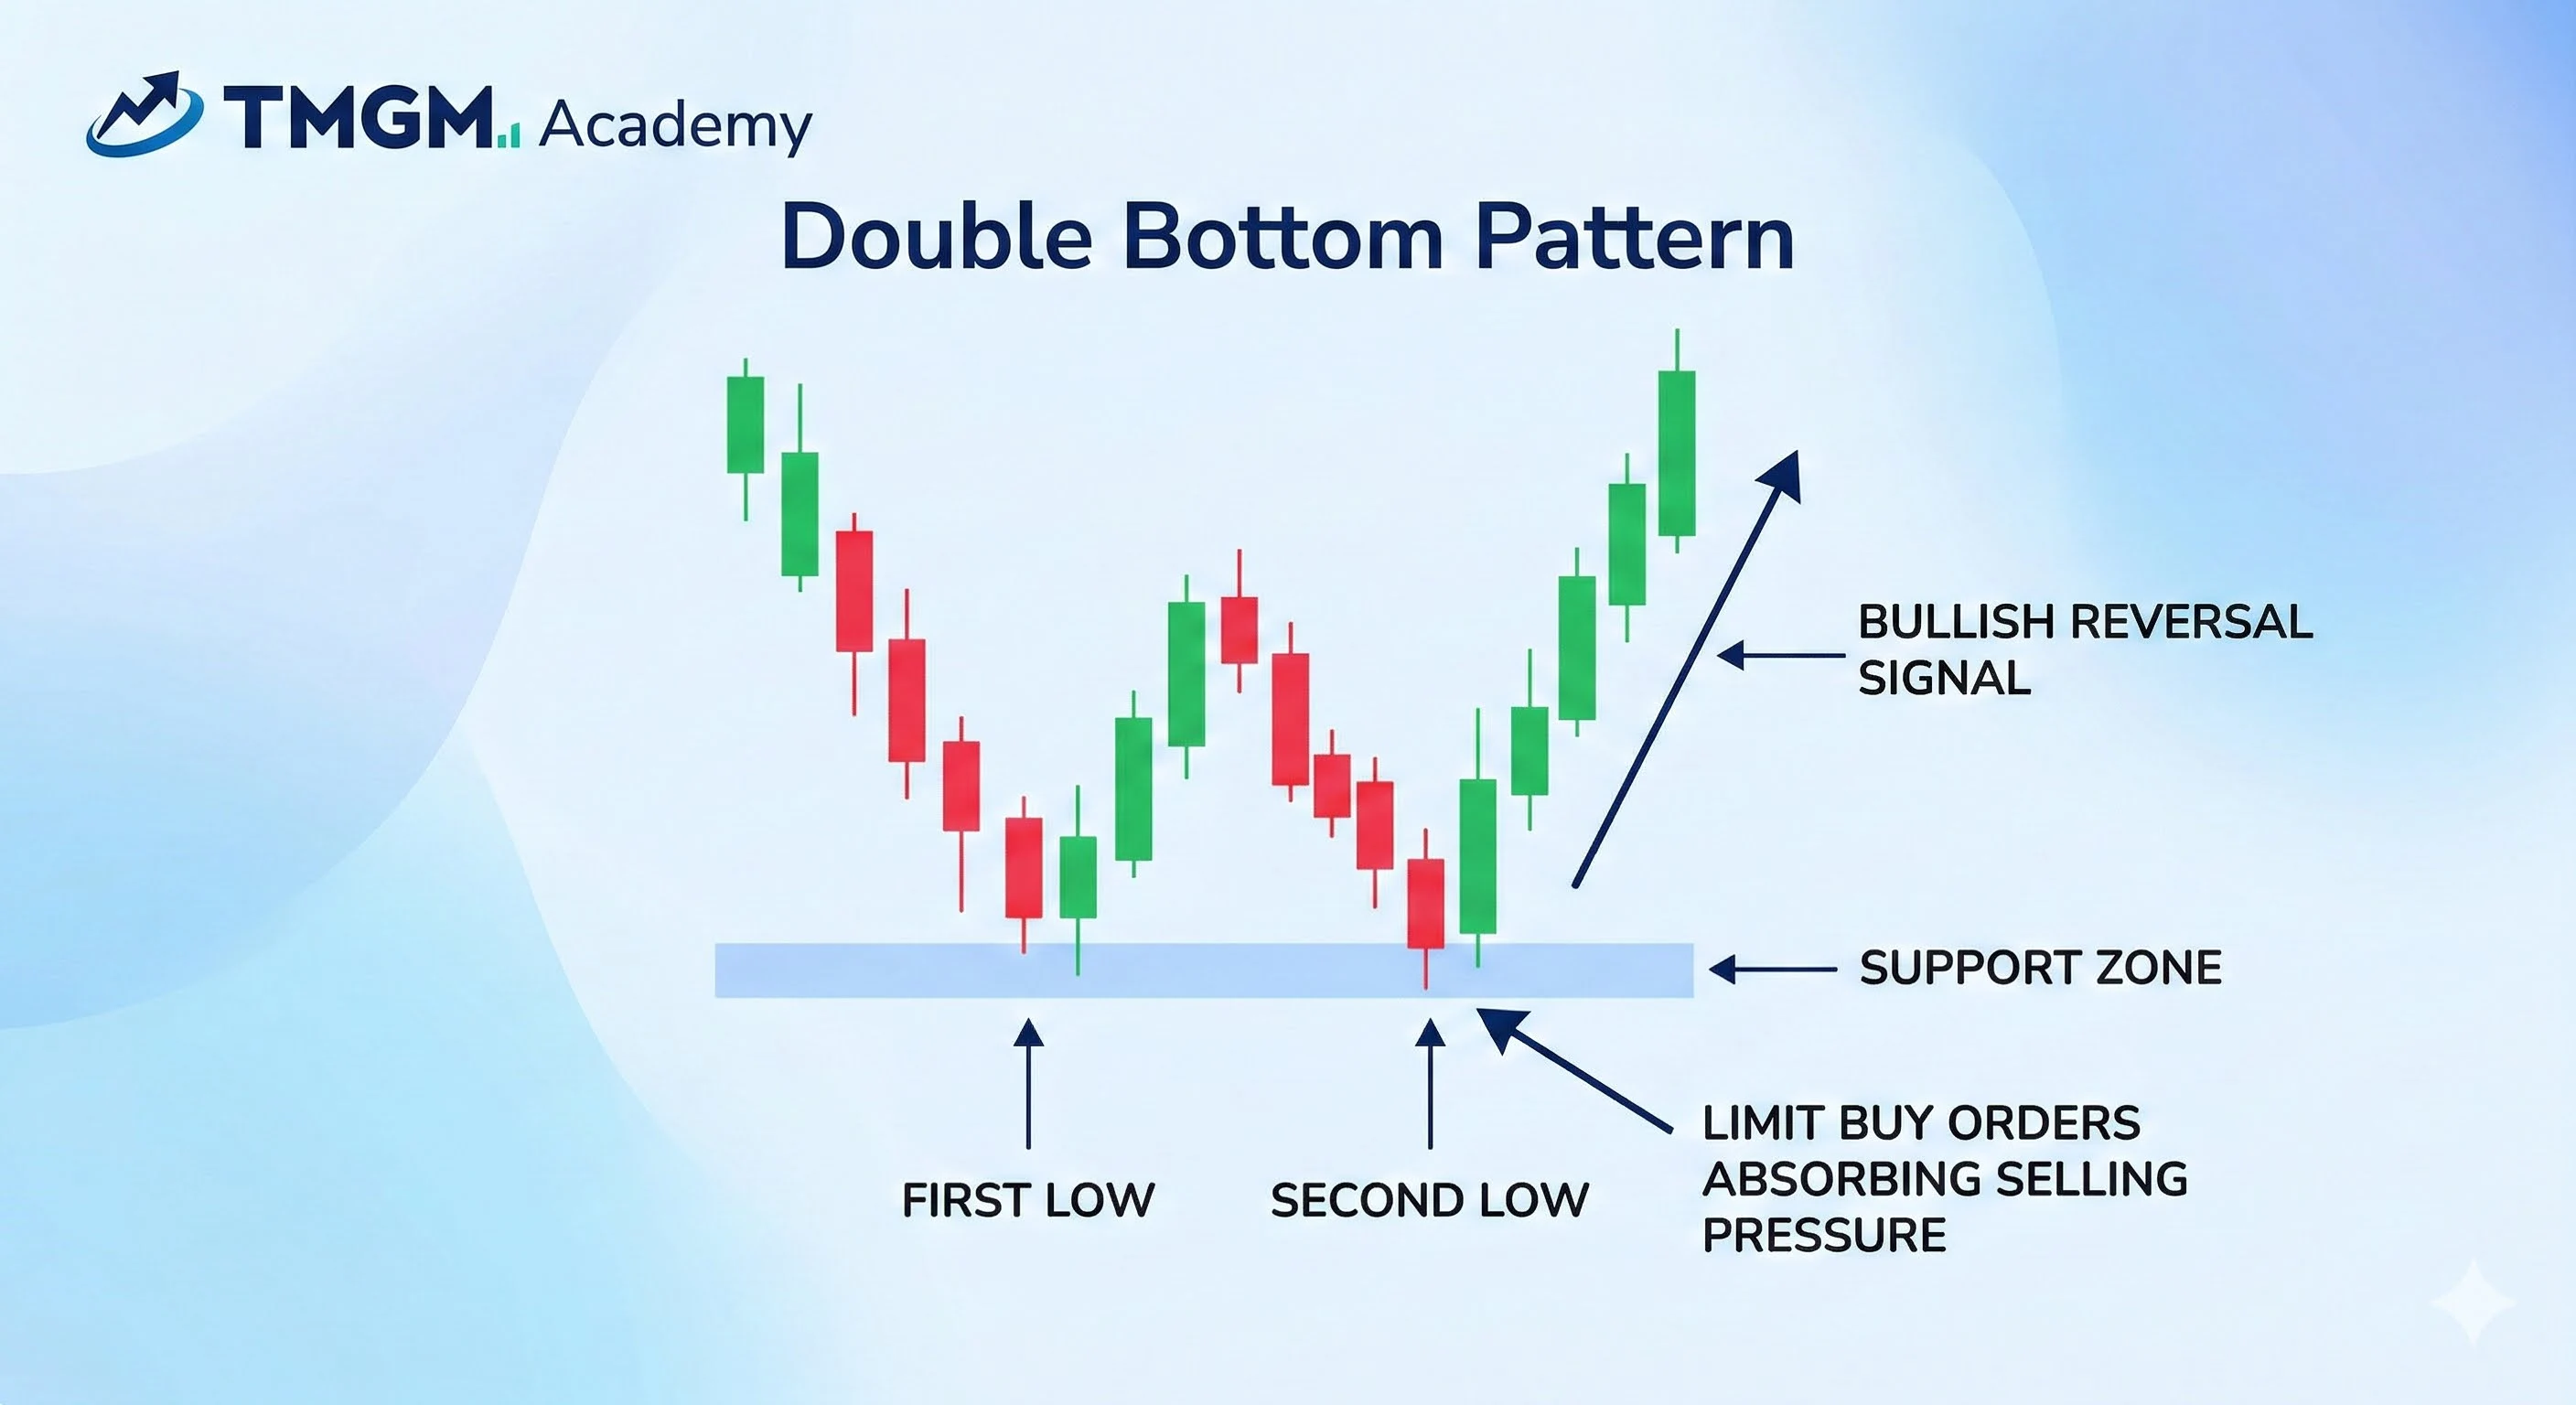
더블 바텀 패턴:
가격이 지지 구간에서 두 차례 반등 거부를 보이며(더블 바텀), 강한 지정가 매수 주문이 매도 압력을 흡수하고 있음을 확인하는 "W"자 형태입니다.
트리플 탑 및 트리플 바텀 차트 패턴:
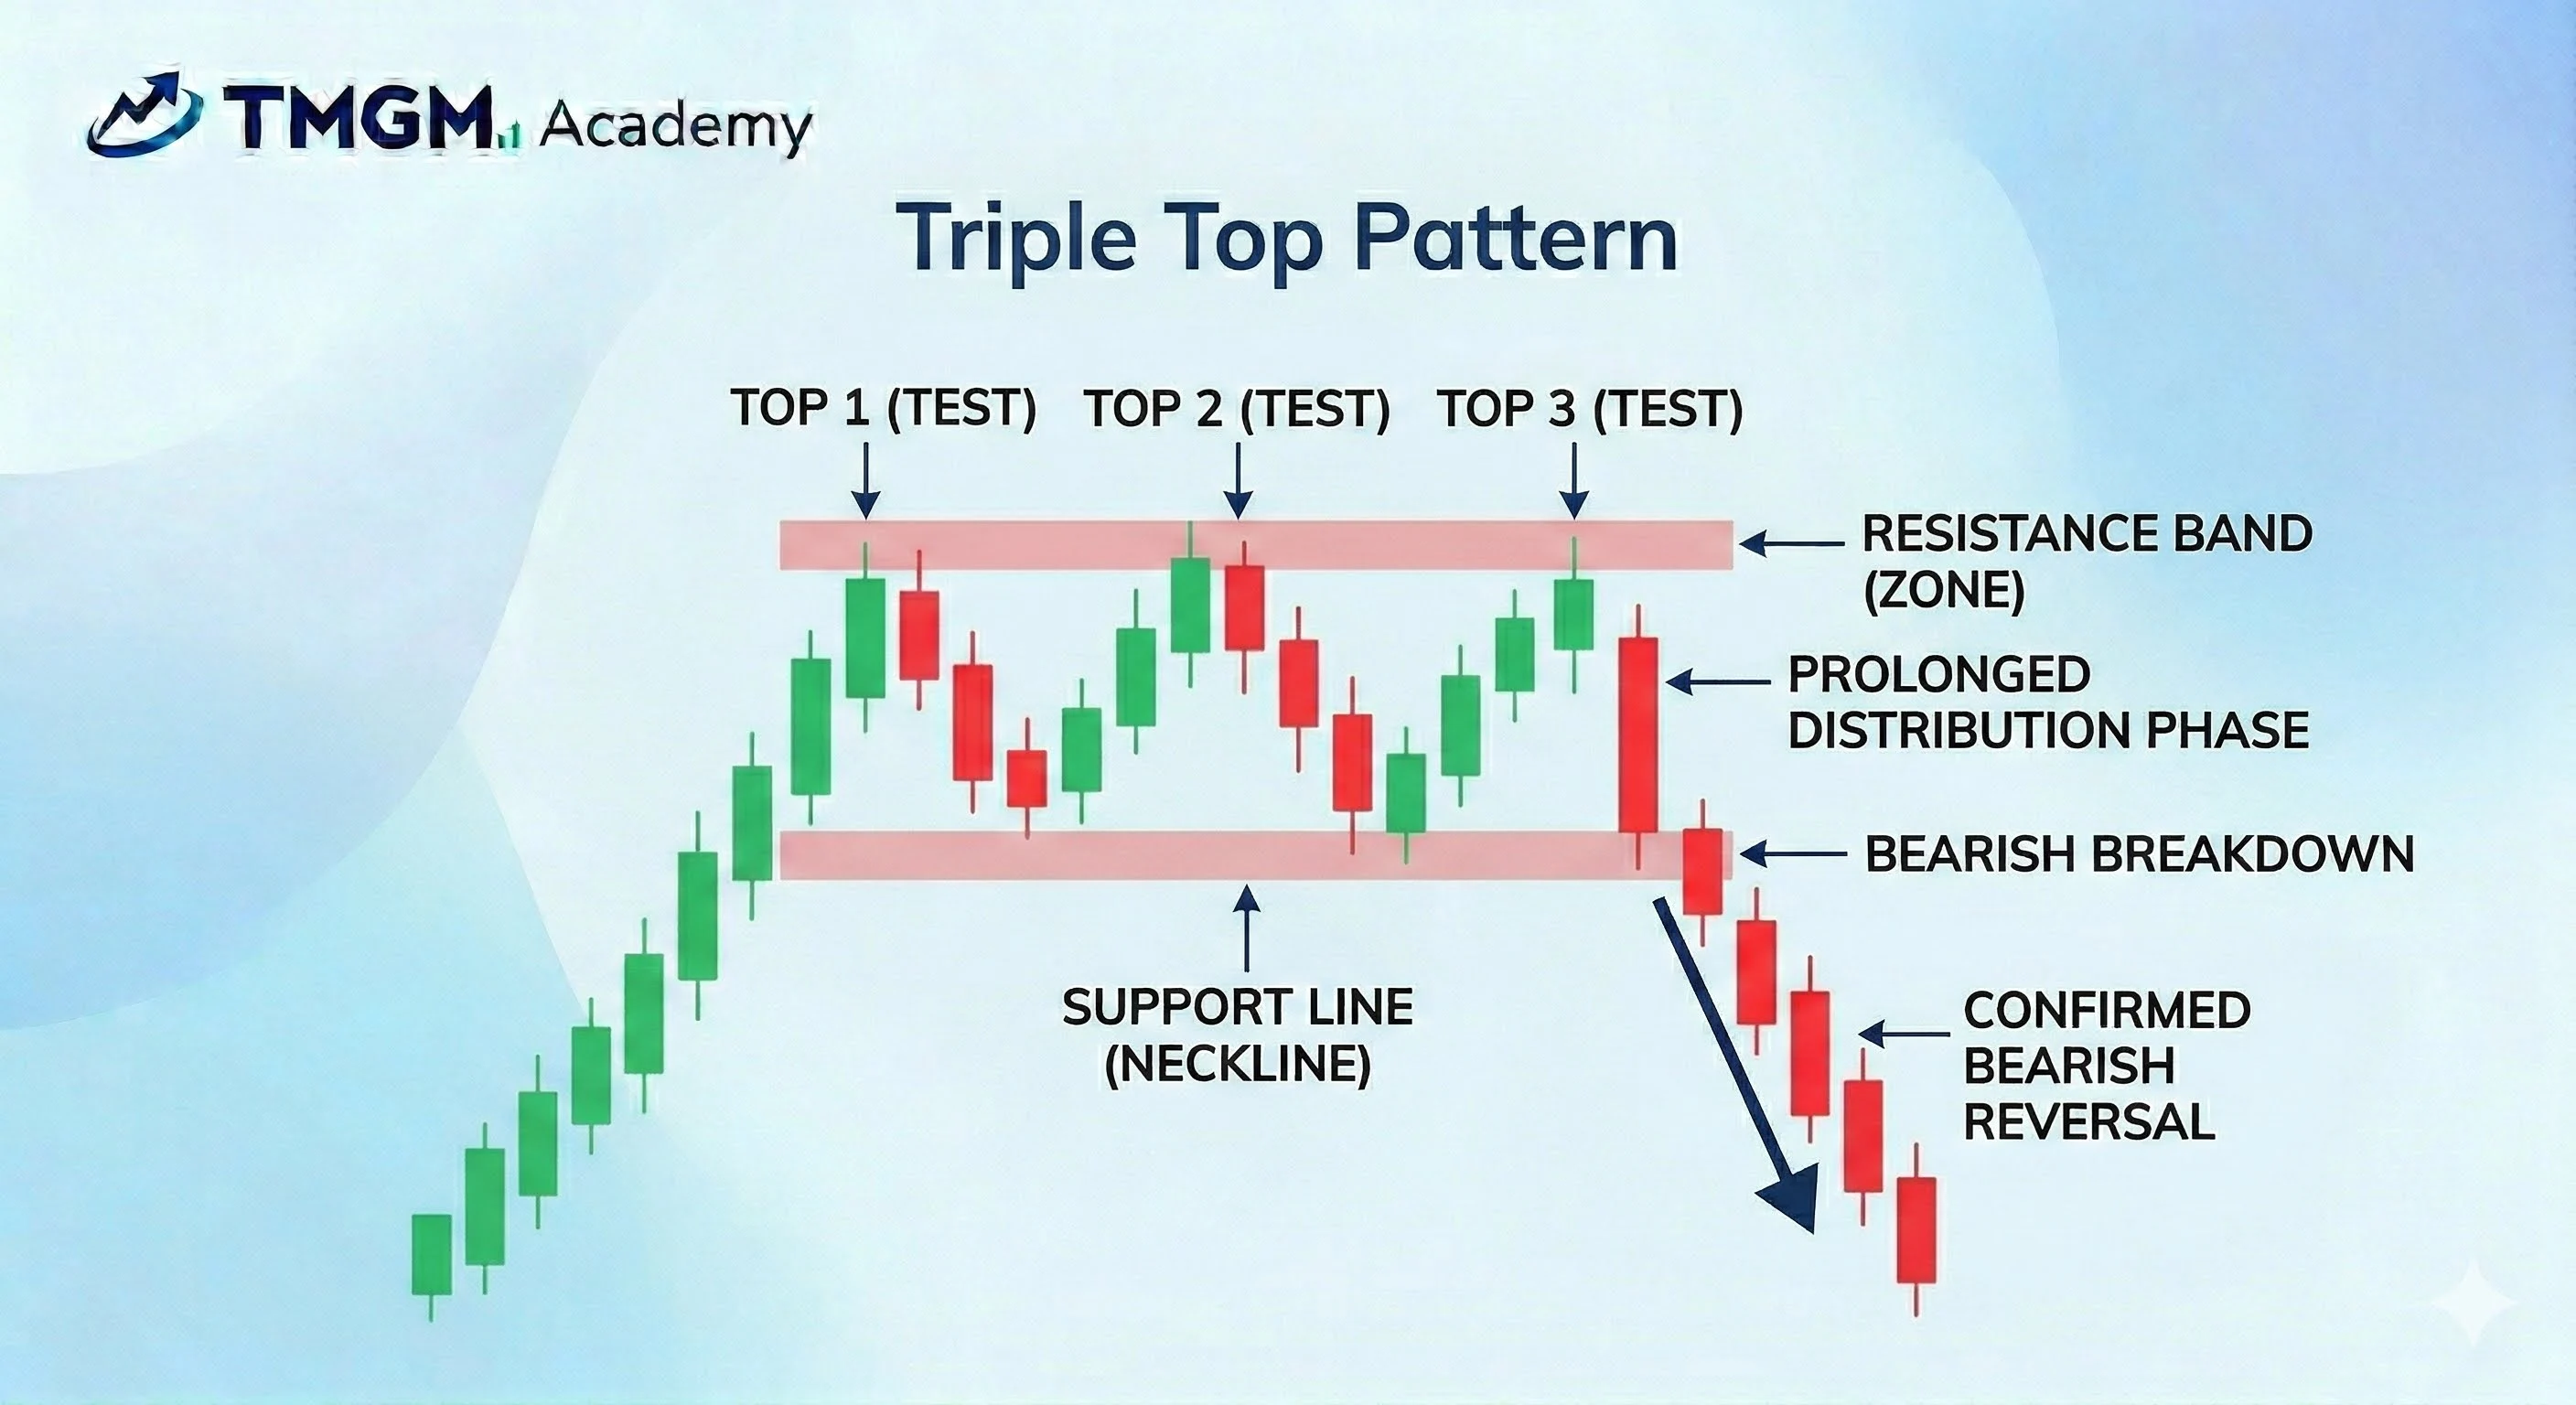
트리플 탑 패턴:
세 차례의 뚜렷한 테스트 동안 저항선이 유지되는 장기 분산 구간(트리플 탑)입니다.
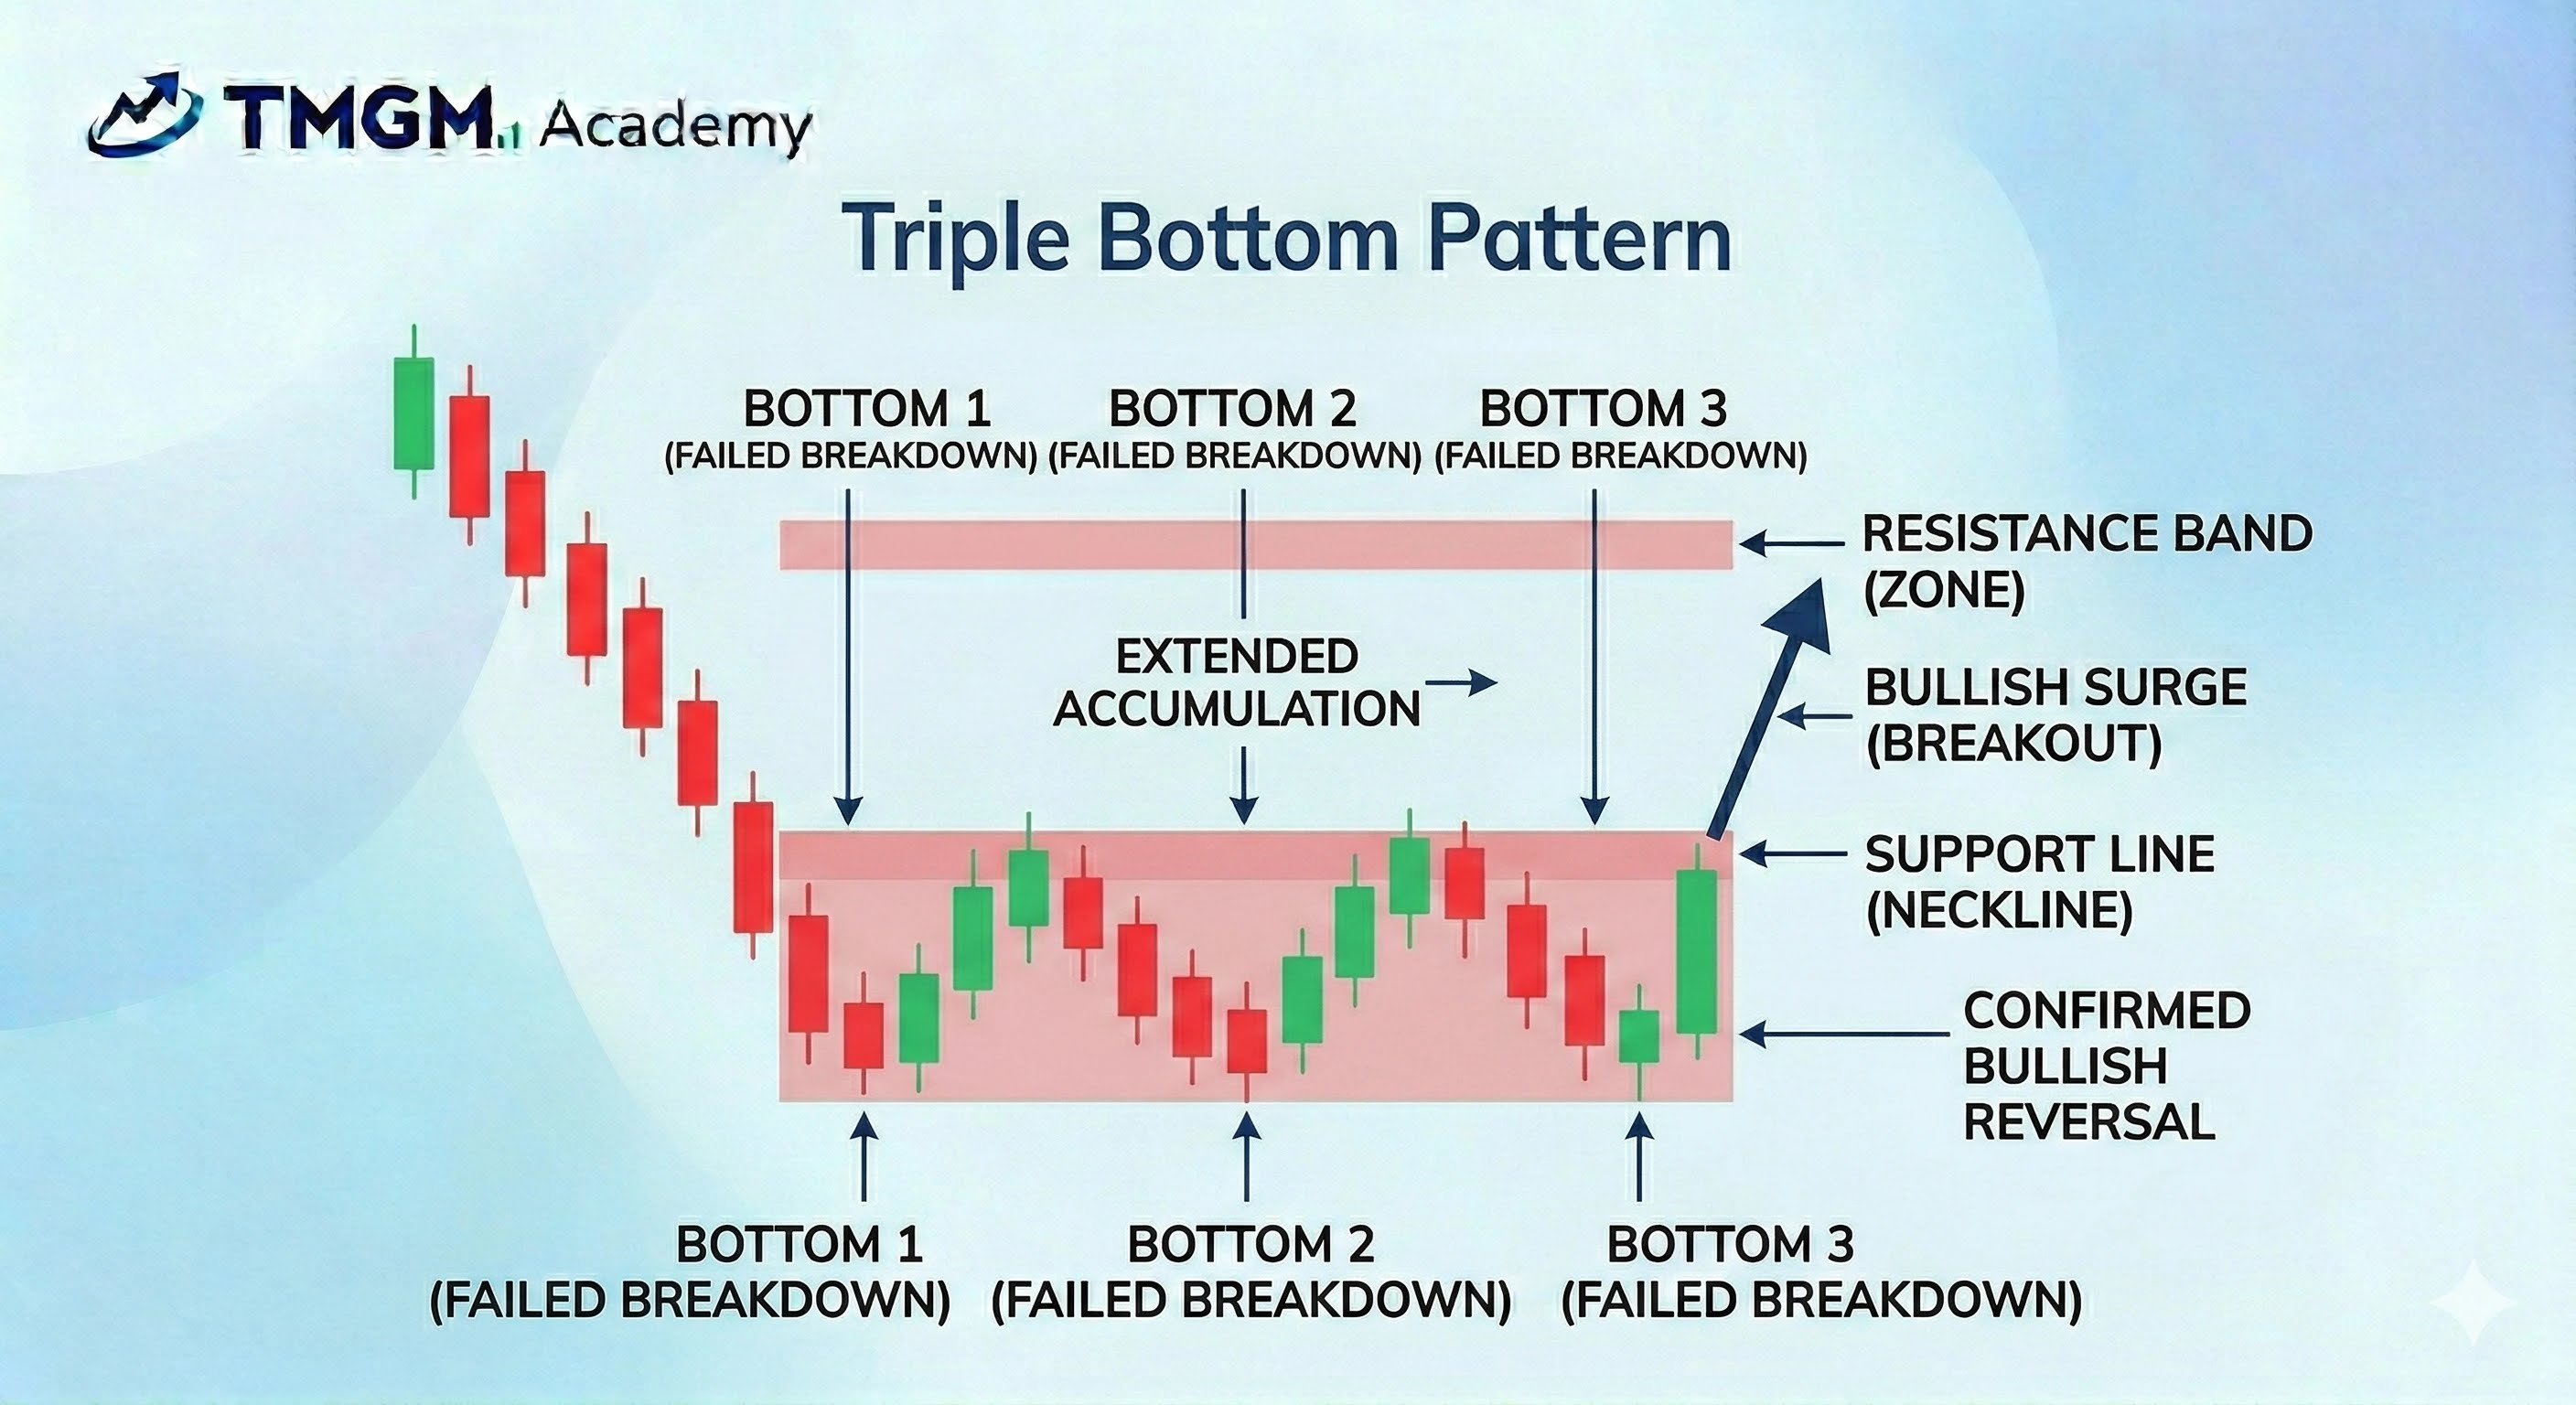
트리플 바텀 패턴:
세 차례의 하향 이탈 실패(트리플 바텀) 이후 강세 급등이 나타나기 전의 확장된 매집 구간입니다.
상승 웨지 및 하락 웨지 패턴:
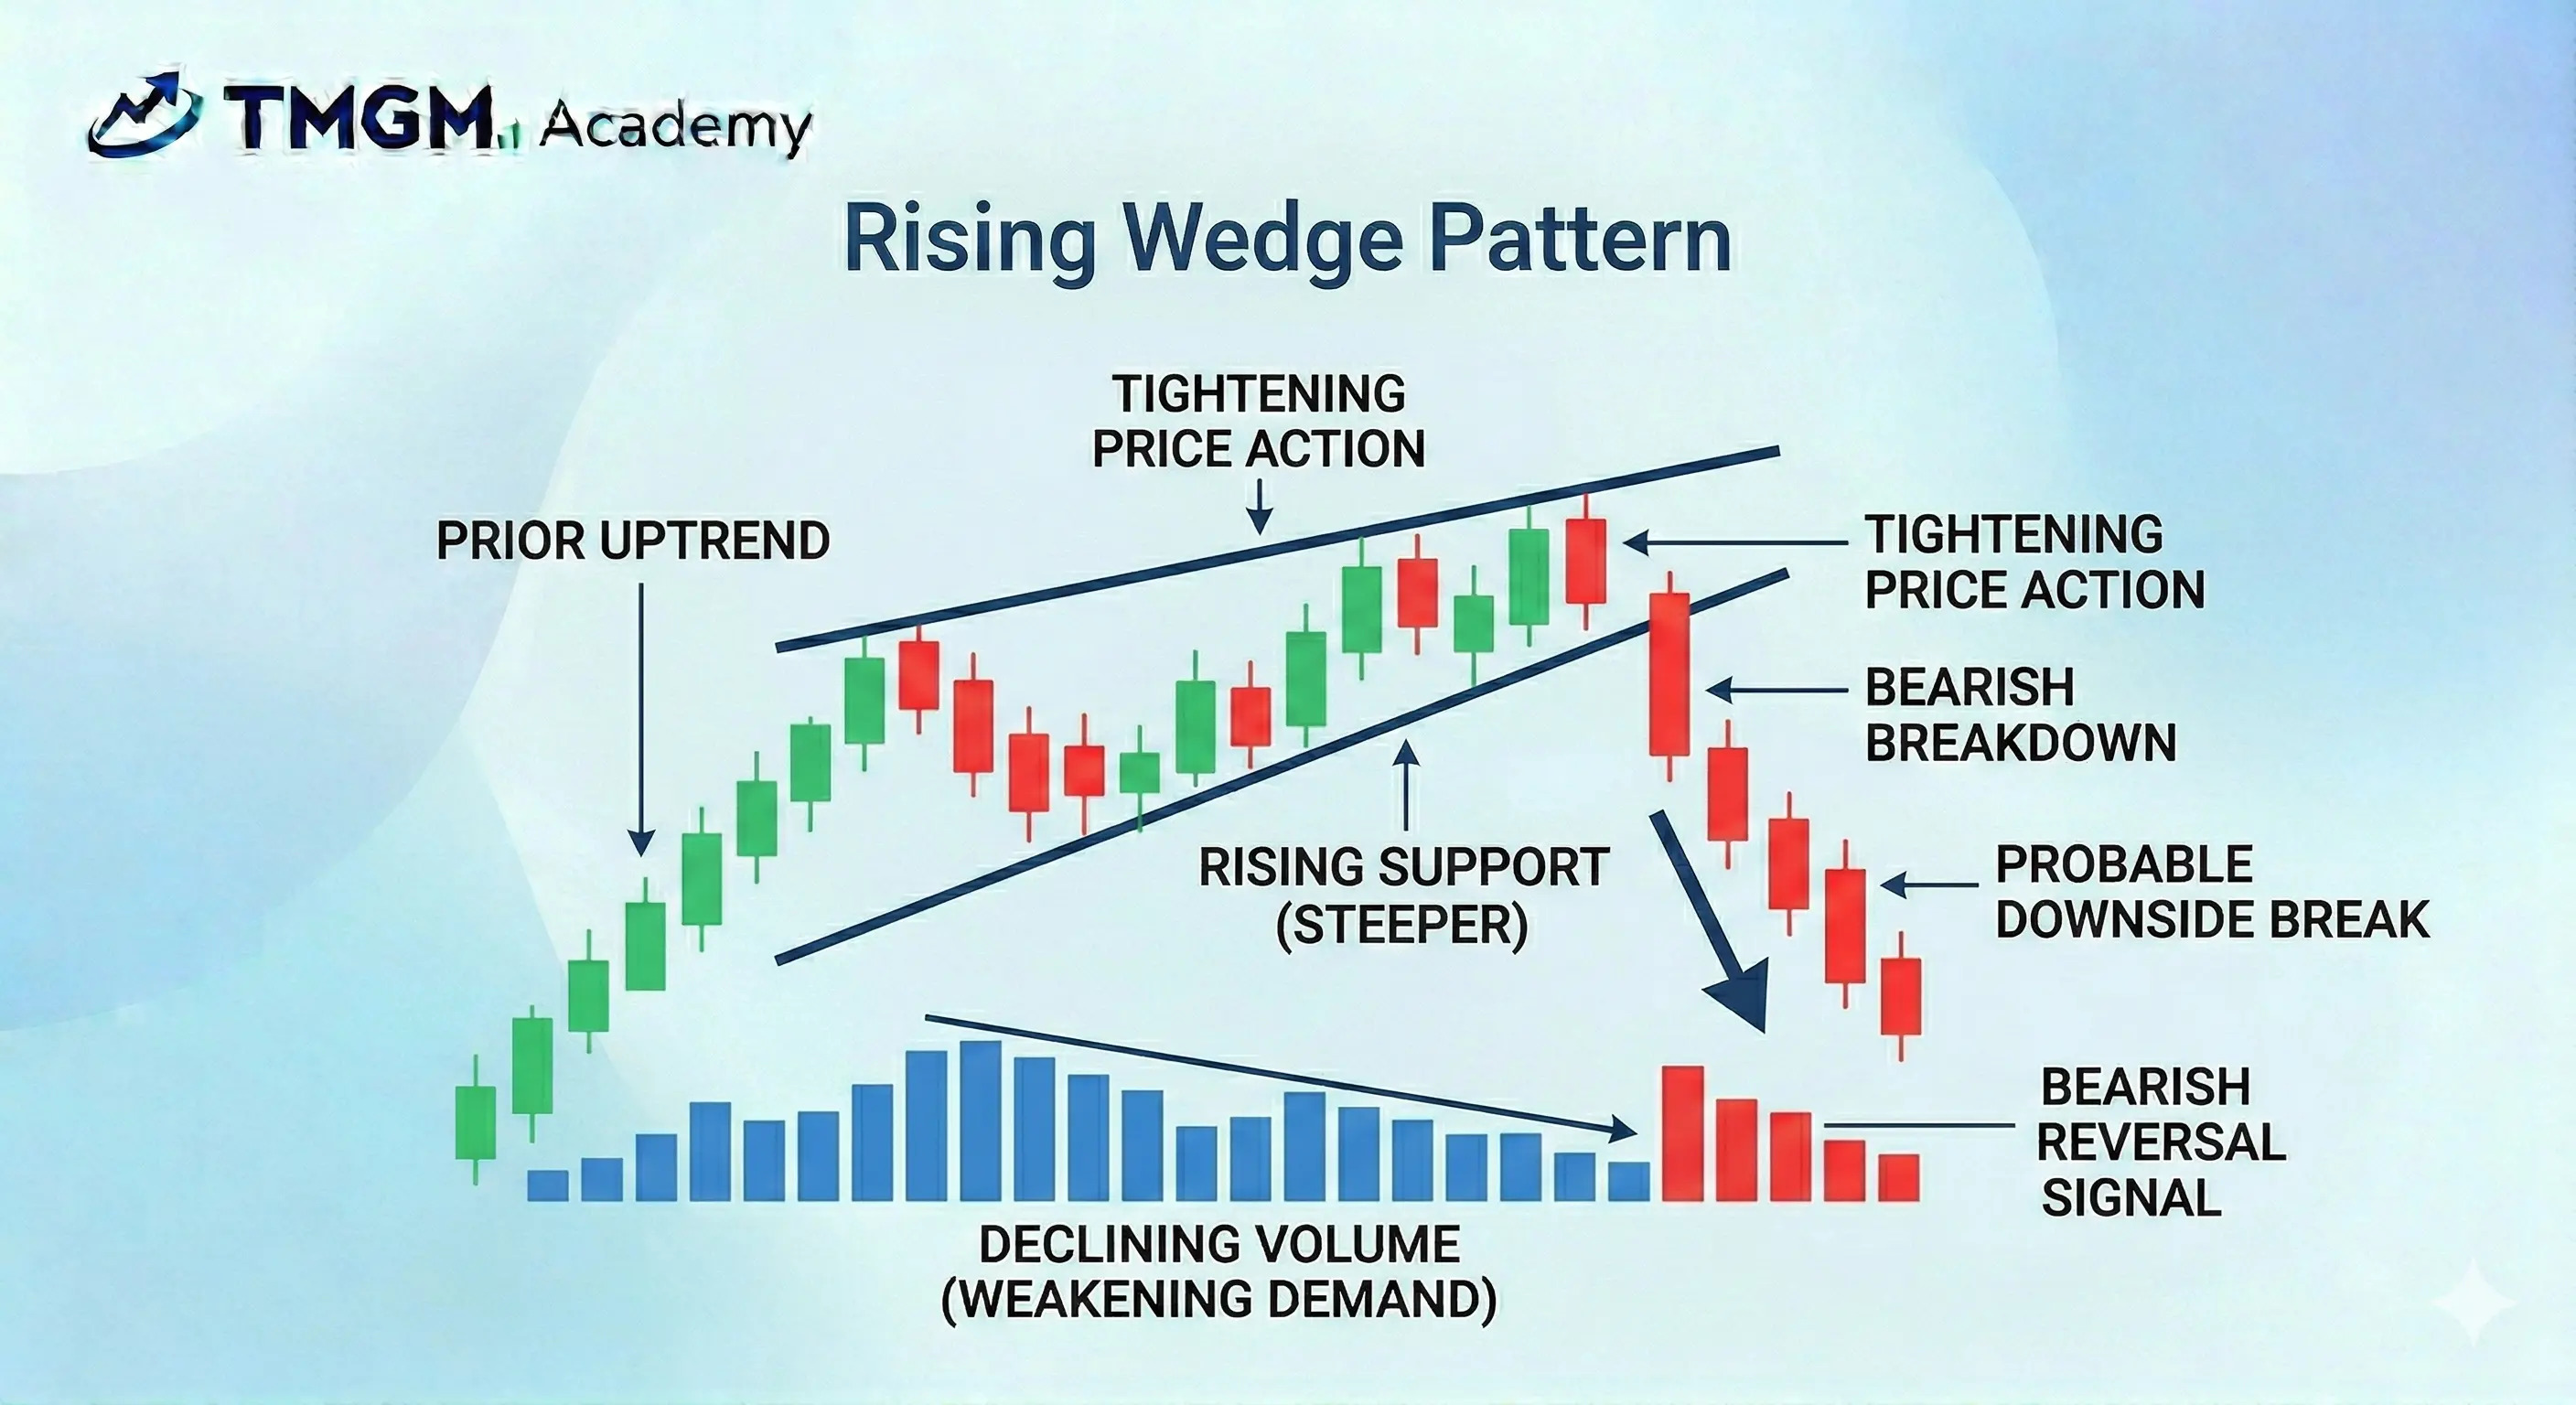
상승 웨지:
상승 추세 중 가격 움직임이 수렴하고(웨지), 거래량이 감소하는 약세 반전 패턴으로, 하방 이탈을 경고합니다.
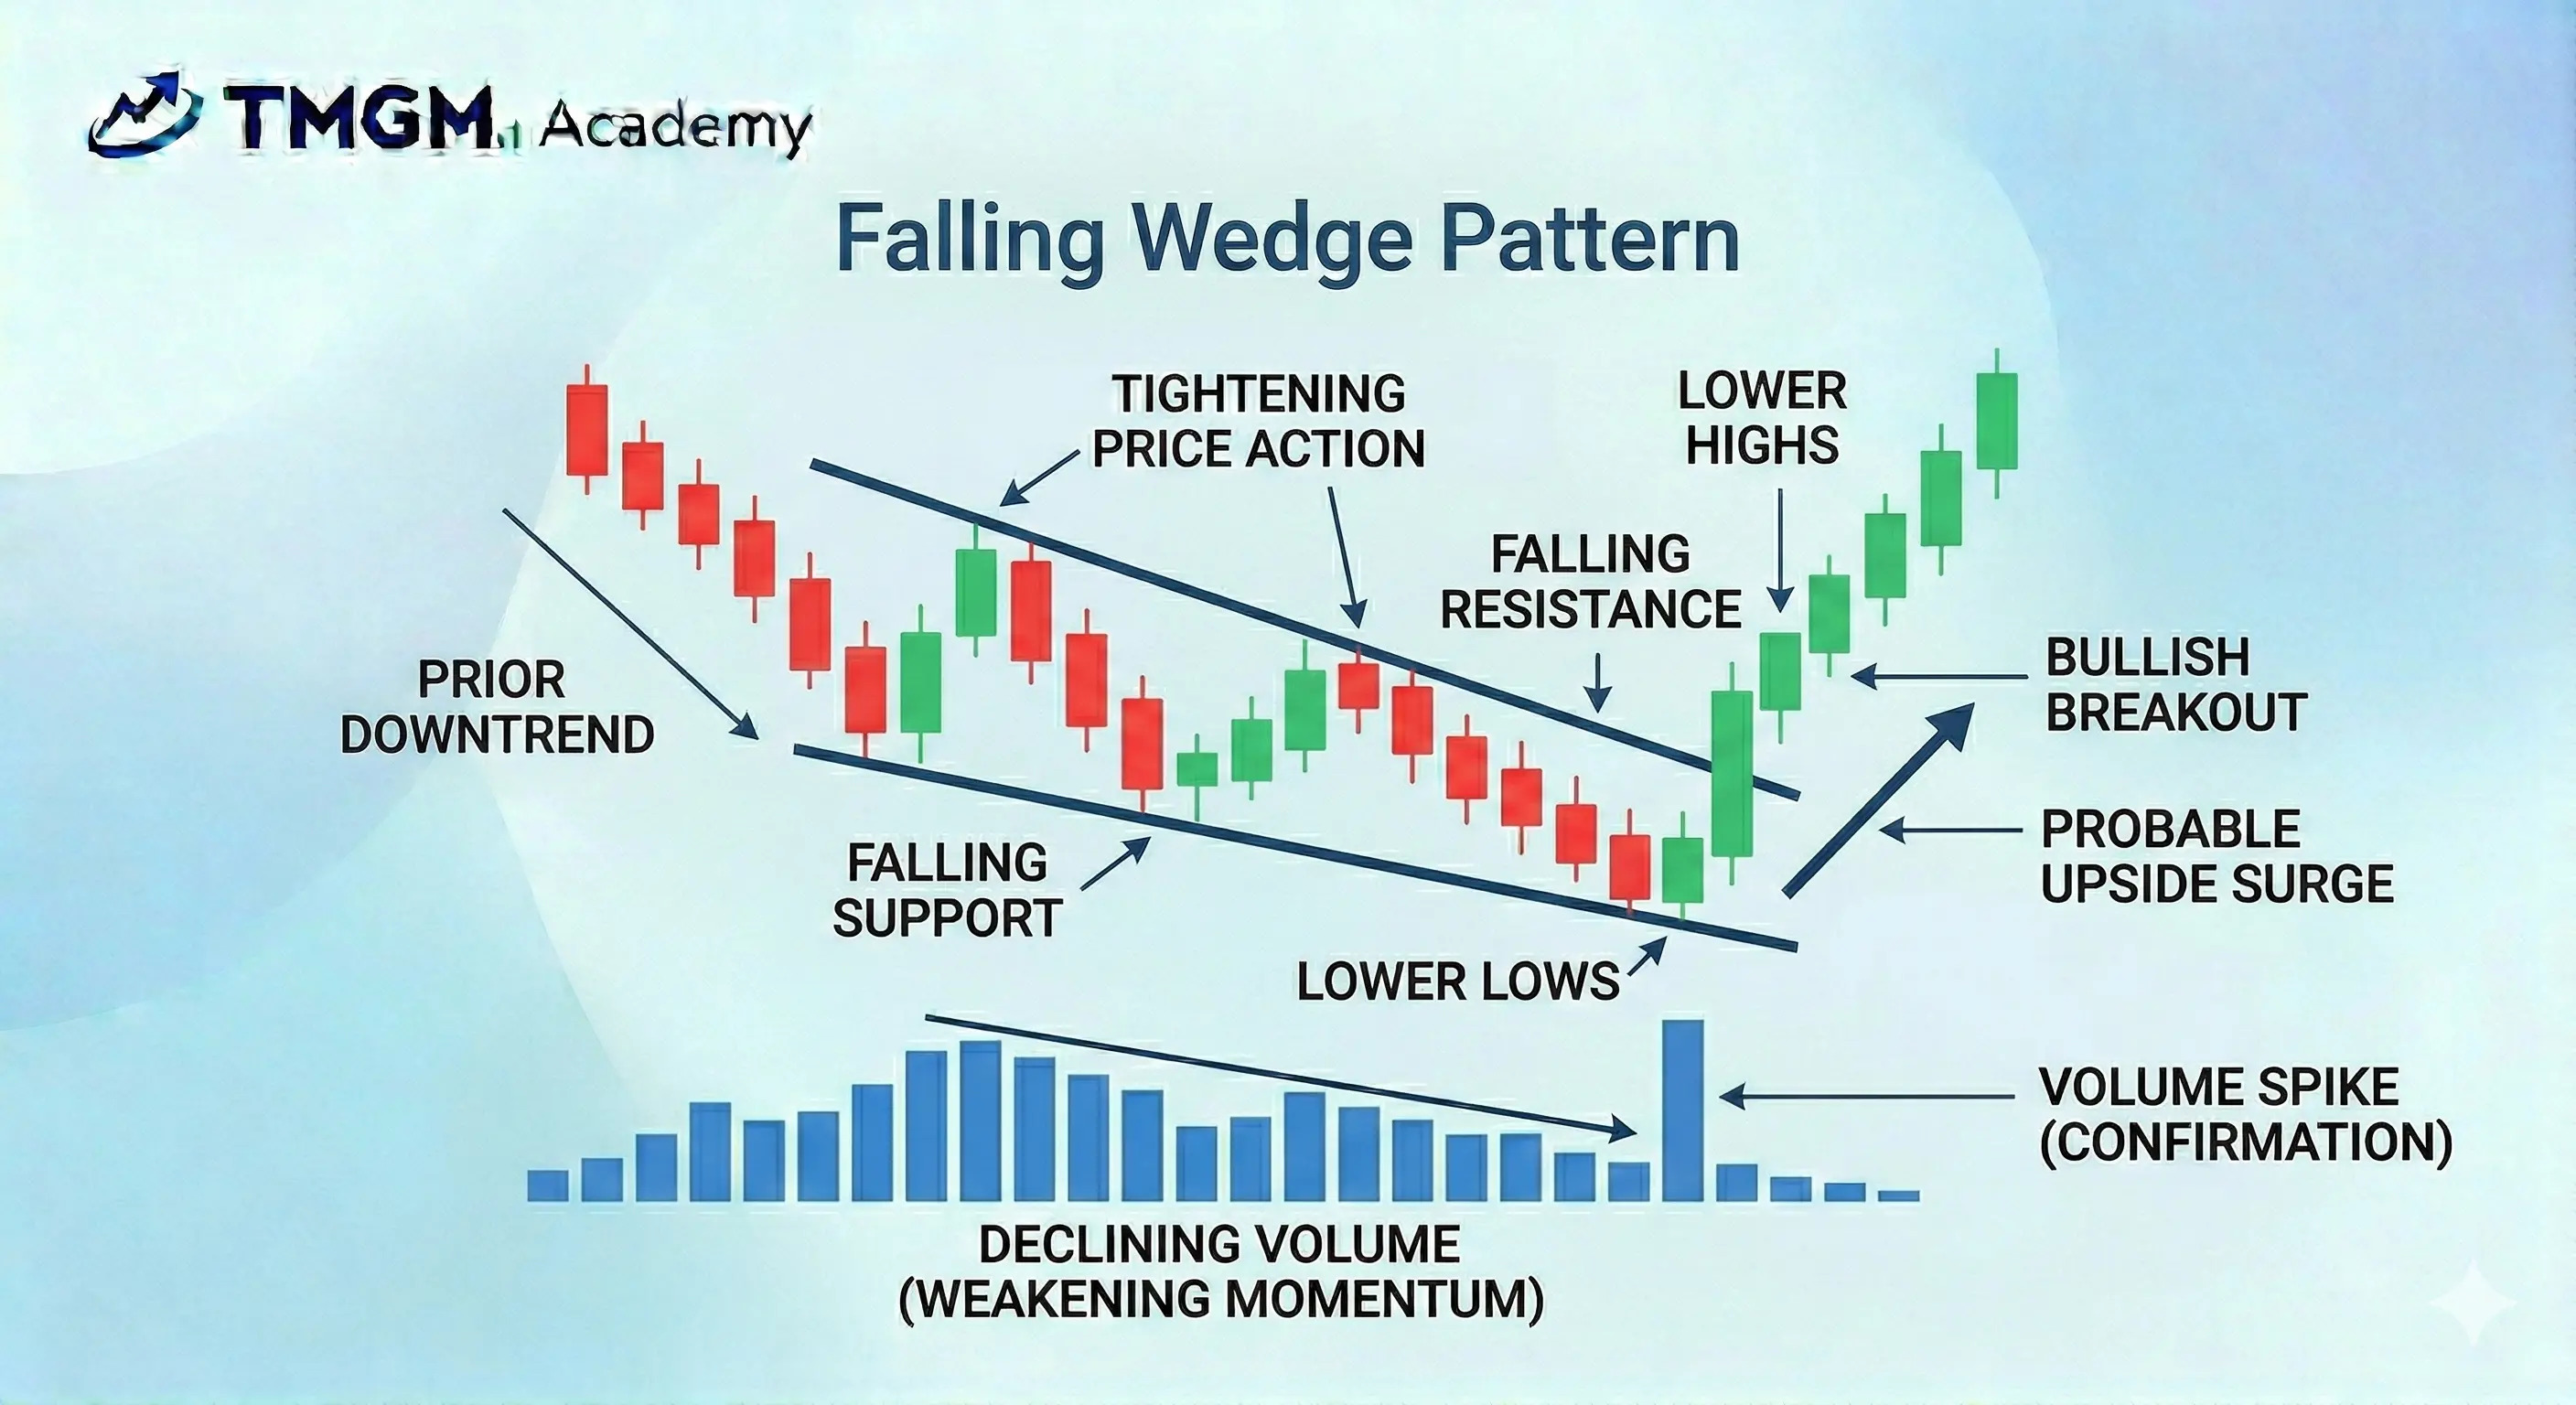
하락 웨지:
하락 모멘텀이 점차 수렴하는(웨지) 강세 반전 구조로, 궁극적으로 높은 확률의 상방 브레이크아웃을 유발합니다.
양방향 차트 패턴
양방향 구조는 어느 방향으로든 브레이크아웃이 발생할 수 있는 시장 균형 상태를 나타내므로, 자금 투입 전 엄격한 확인이 필요합니다.
삼각형 차트 패턴
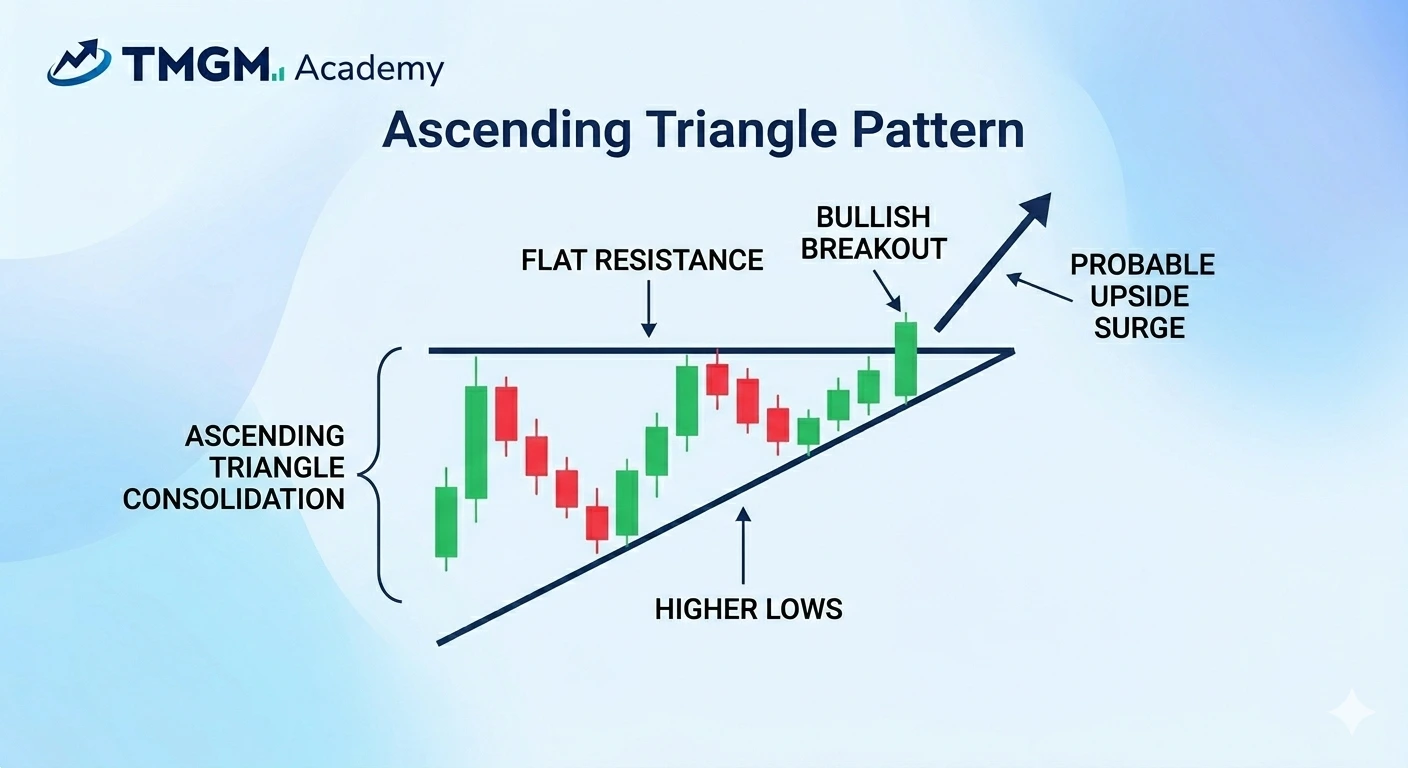
상승 삼각형 패턴:
평평한 상단 저항선과 점점 높아지는 저점(삼각형)이 결합된 형태로, 매수세가 공급 물량을 공격적으로 흡수하고 있음을 시사합니다
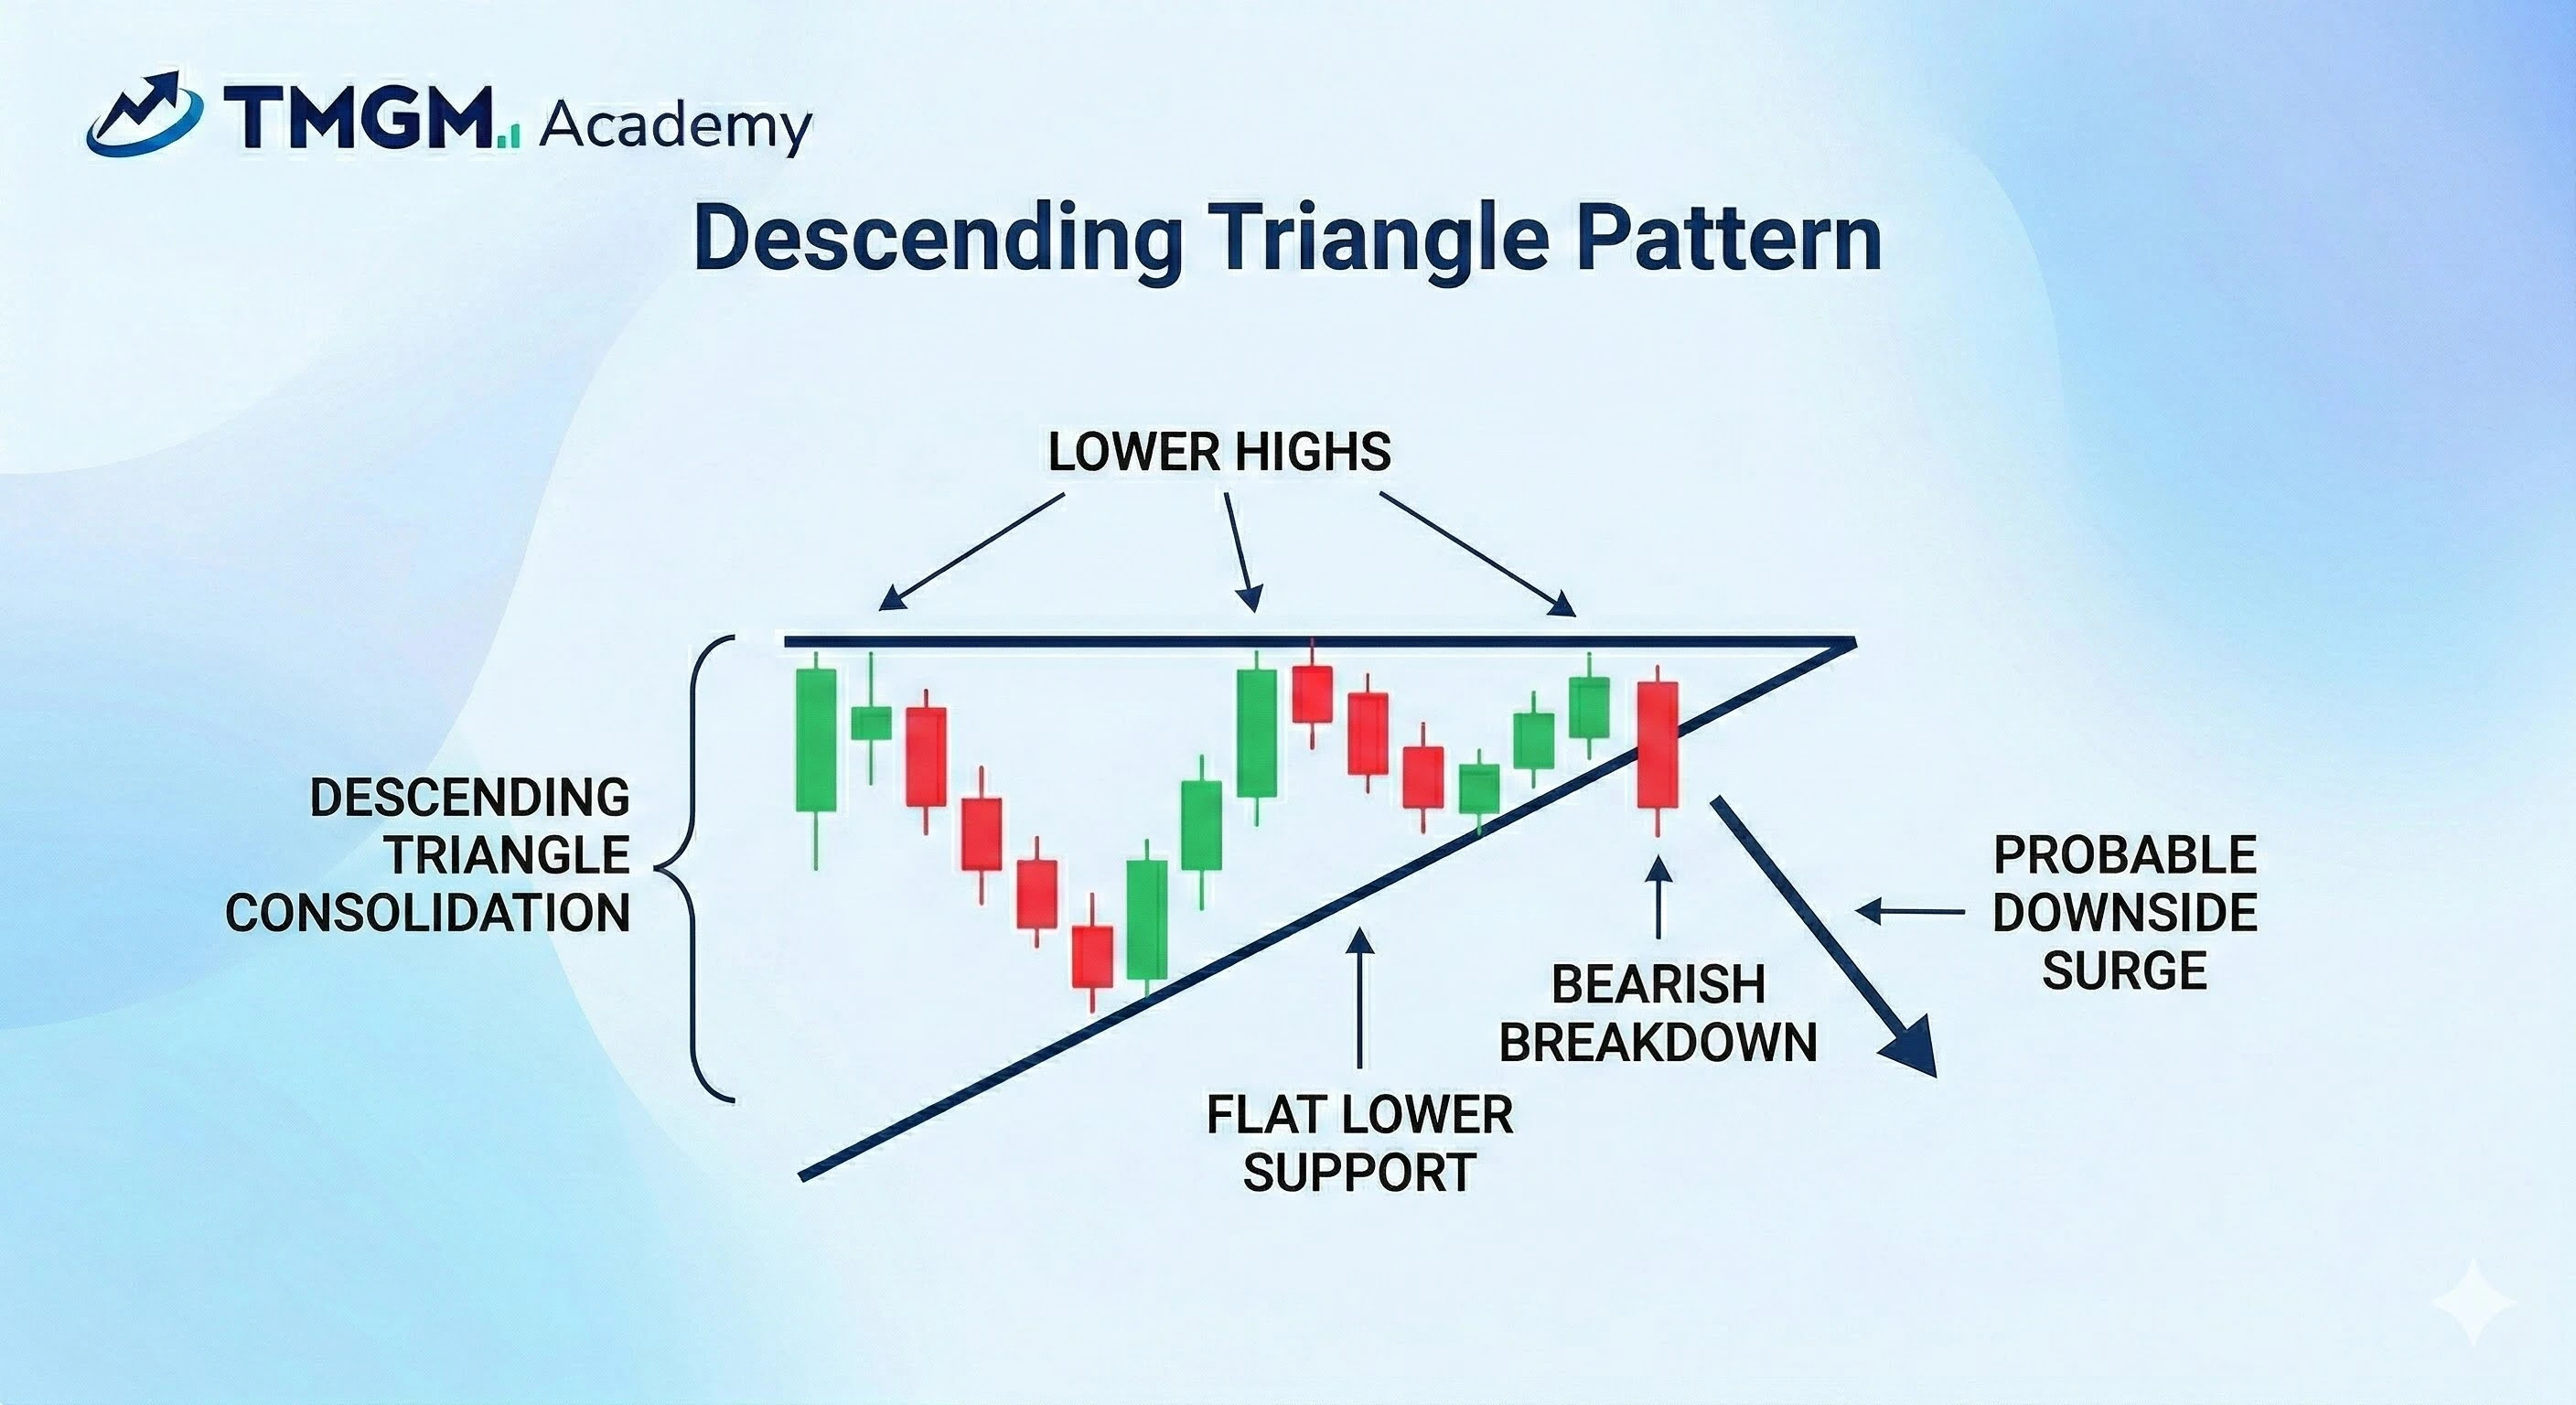
하락 삼각형 패턴:
평평한 하단 지지선과 점점 낮아지는 고점(삼각형)이 결합된 형태로, 매도세가 더 낮은 가격대에서 지속적으로 유입되고 있음을 나타냅니다.
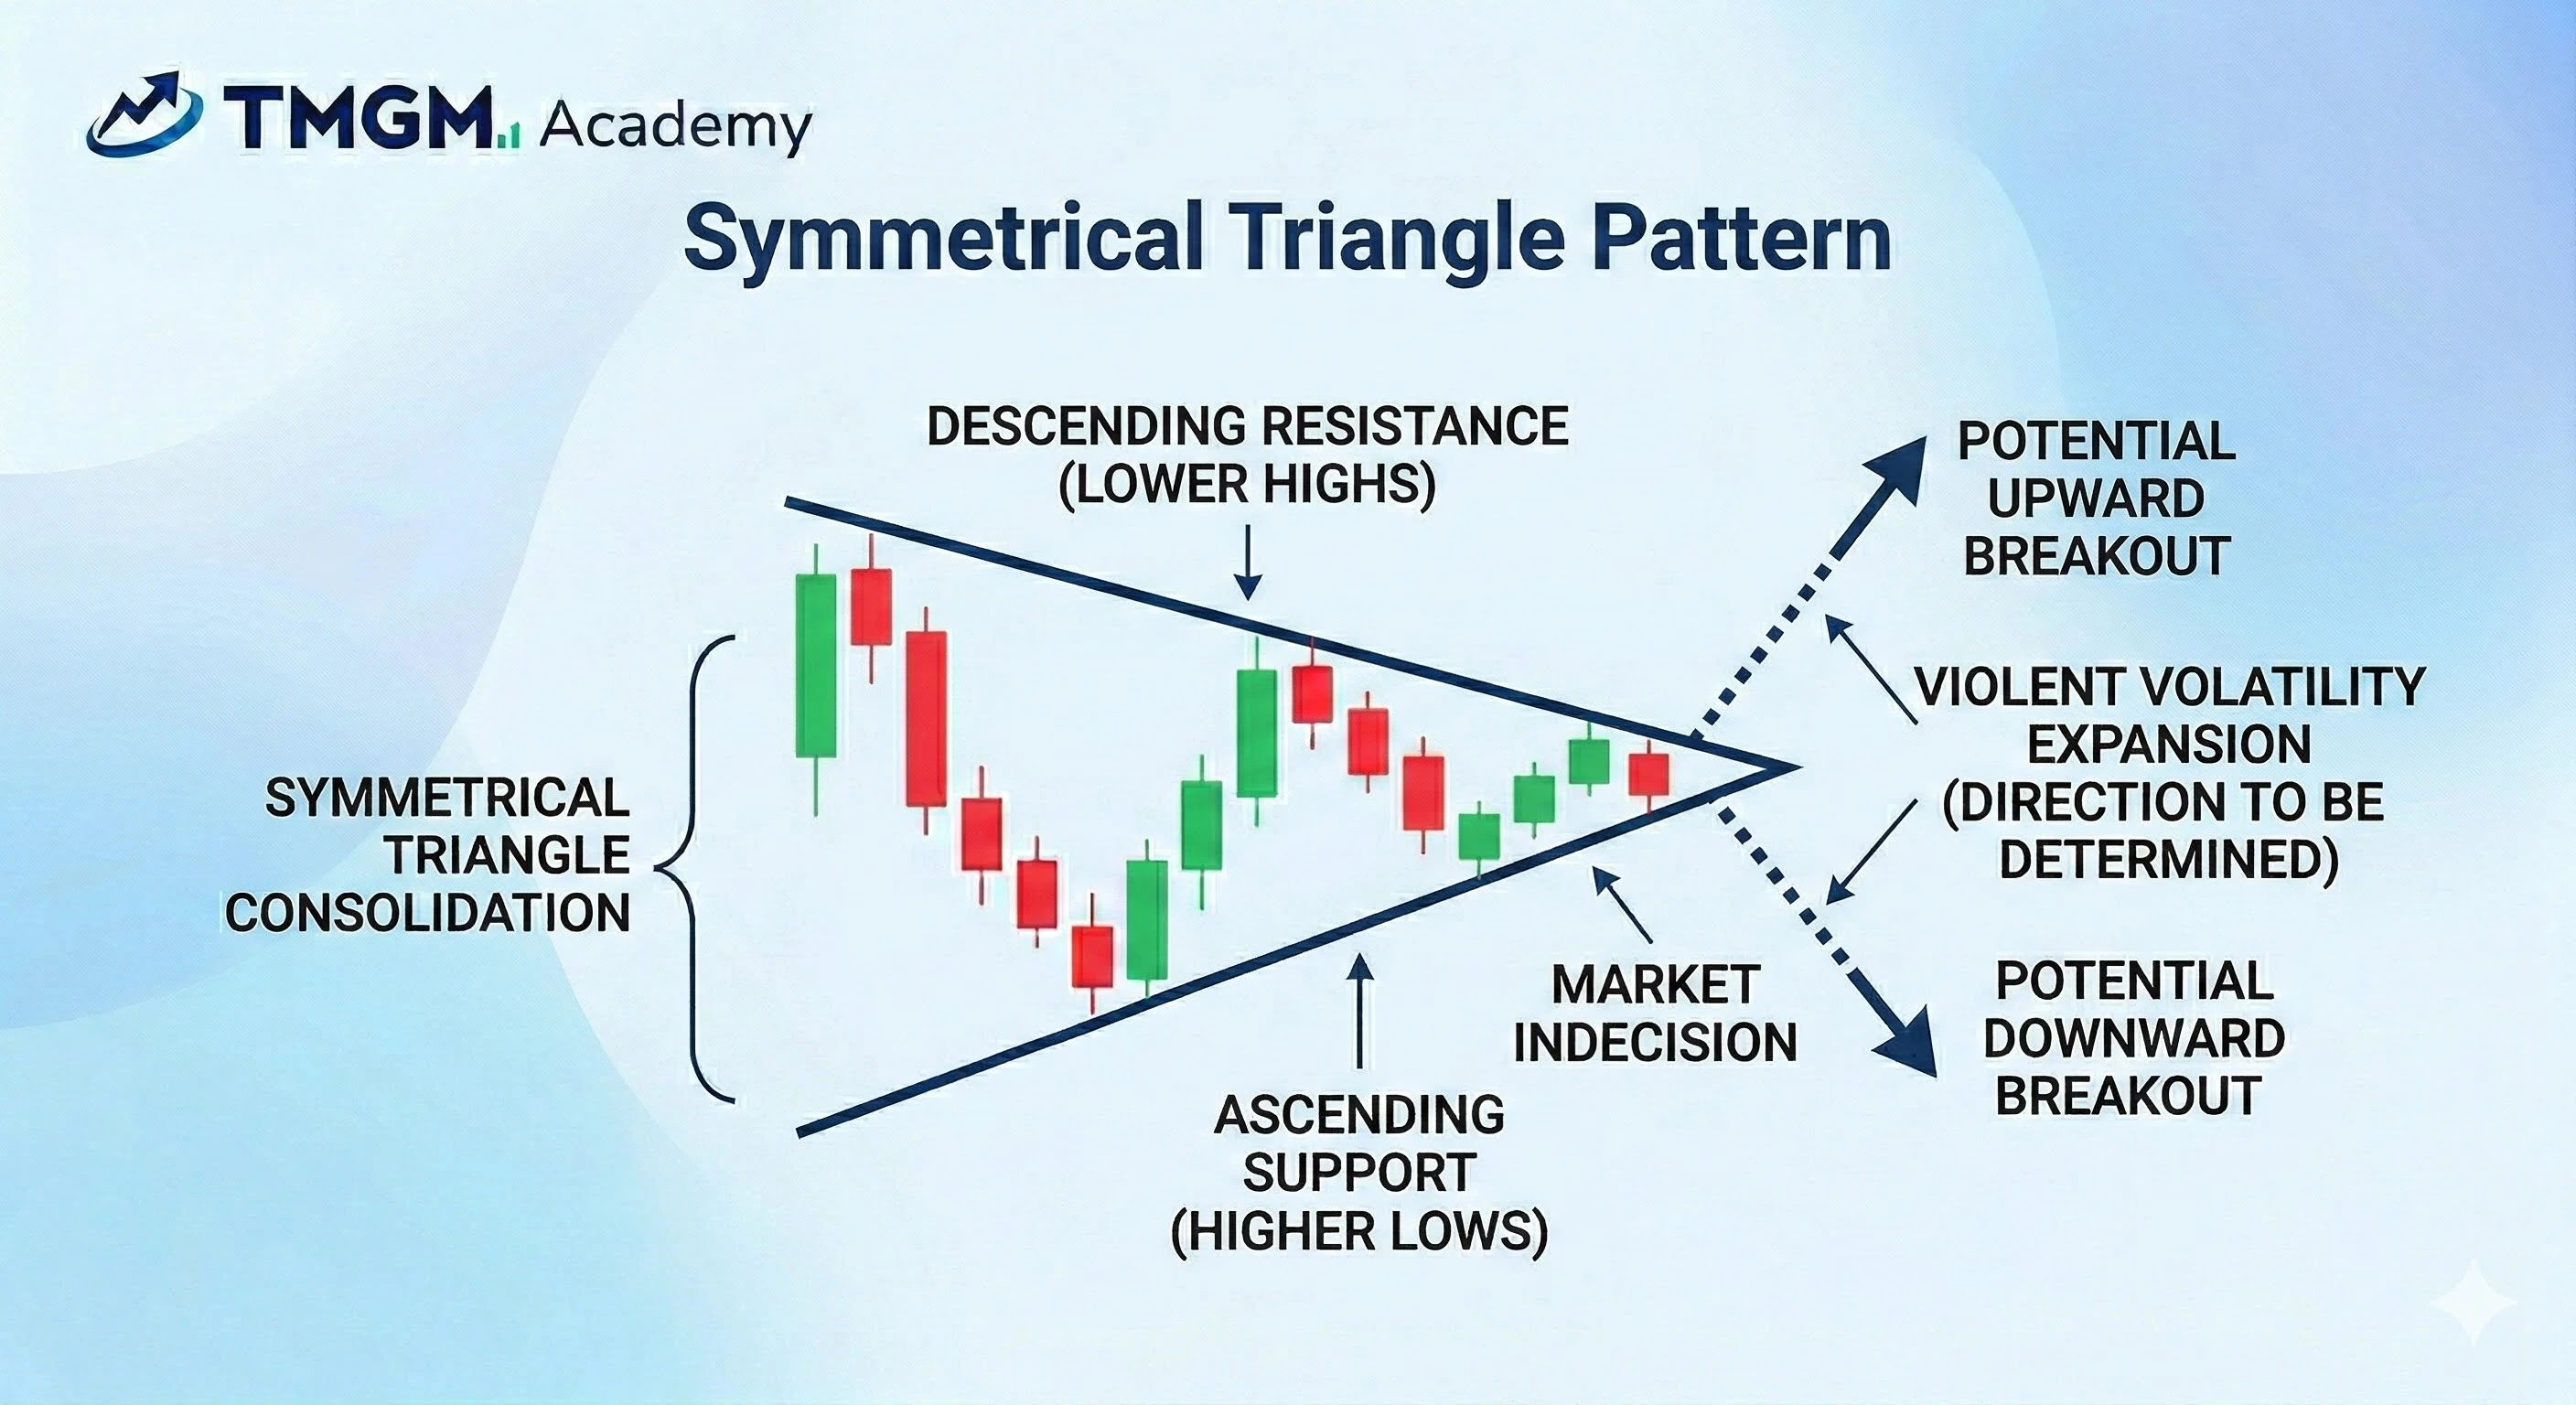
대칭 삼각형 패턴:
수렴하는 추세선(삼각형)은 시장의 완전한 방향성 부재를 보여주며, 브레이크아웃 시 급격한 변동성 확대가 자주 뒤따릅니다.
차트 패턴 매매 기법
일반적으로 차트 패턴을 활용한 매매에는 2가지 접근 방식이 있습니다.
브레이크아웃 매매
브레이크아웃 매매는 가격이 정의된 지지선 또는 저항선 경계를 명확히 돌파할 때 포지션에 진입하는 방식입니다.
목표는 가격이 저항선을 돌파할 때 발생하는 빠른 가격 움직임을 포착하는 것이며, 이러한 모멘텀은 일반적으로 반대 방향으로 거래하던 트레이더들이 포지션을 청산해야 하면서 형성됩니다.
박스권 매매
박스권 매매는 횡보 조정 구간에서 패턴 경계의 극단 구간을 역추세로 공략하는 전략입니다. 트레이더는 하단 지지 구간에서 매수하고 상단 저항 구간에서 숏 포지션을 취하며, 실제 브레이크아웃이 나타날 때까지 이를 반복합니다.
박스권 매매는 시장이 중립적이고 촉매가 없을 때 가장 효과적입니다. 추세 조건이 돌아오면 박스권은 종종 브레이크아웃 셋업으로 전환됩니다.
진입 전 확인 절차
확인은 가격과 시장 참여가 일치해야 한다는 규칙 기반 필터로, 질이 낮은 진입을 줄여줍니다. 트레이더는 기술적 지표, 거래량, 가격 움직임, 그리고 상위 타임프레임 점검으로 확인할 수 있습니다.
프로 팁:
최적의 진입은 명확한 가격대, 분명한 종가 마감, 그리고 실제 무효화 지점에 설정된 스톱을 결합할 때 나옵니다.
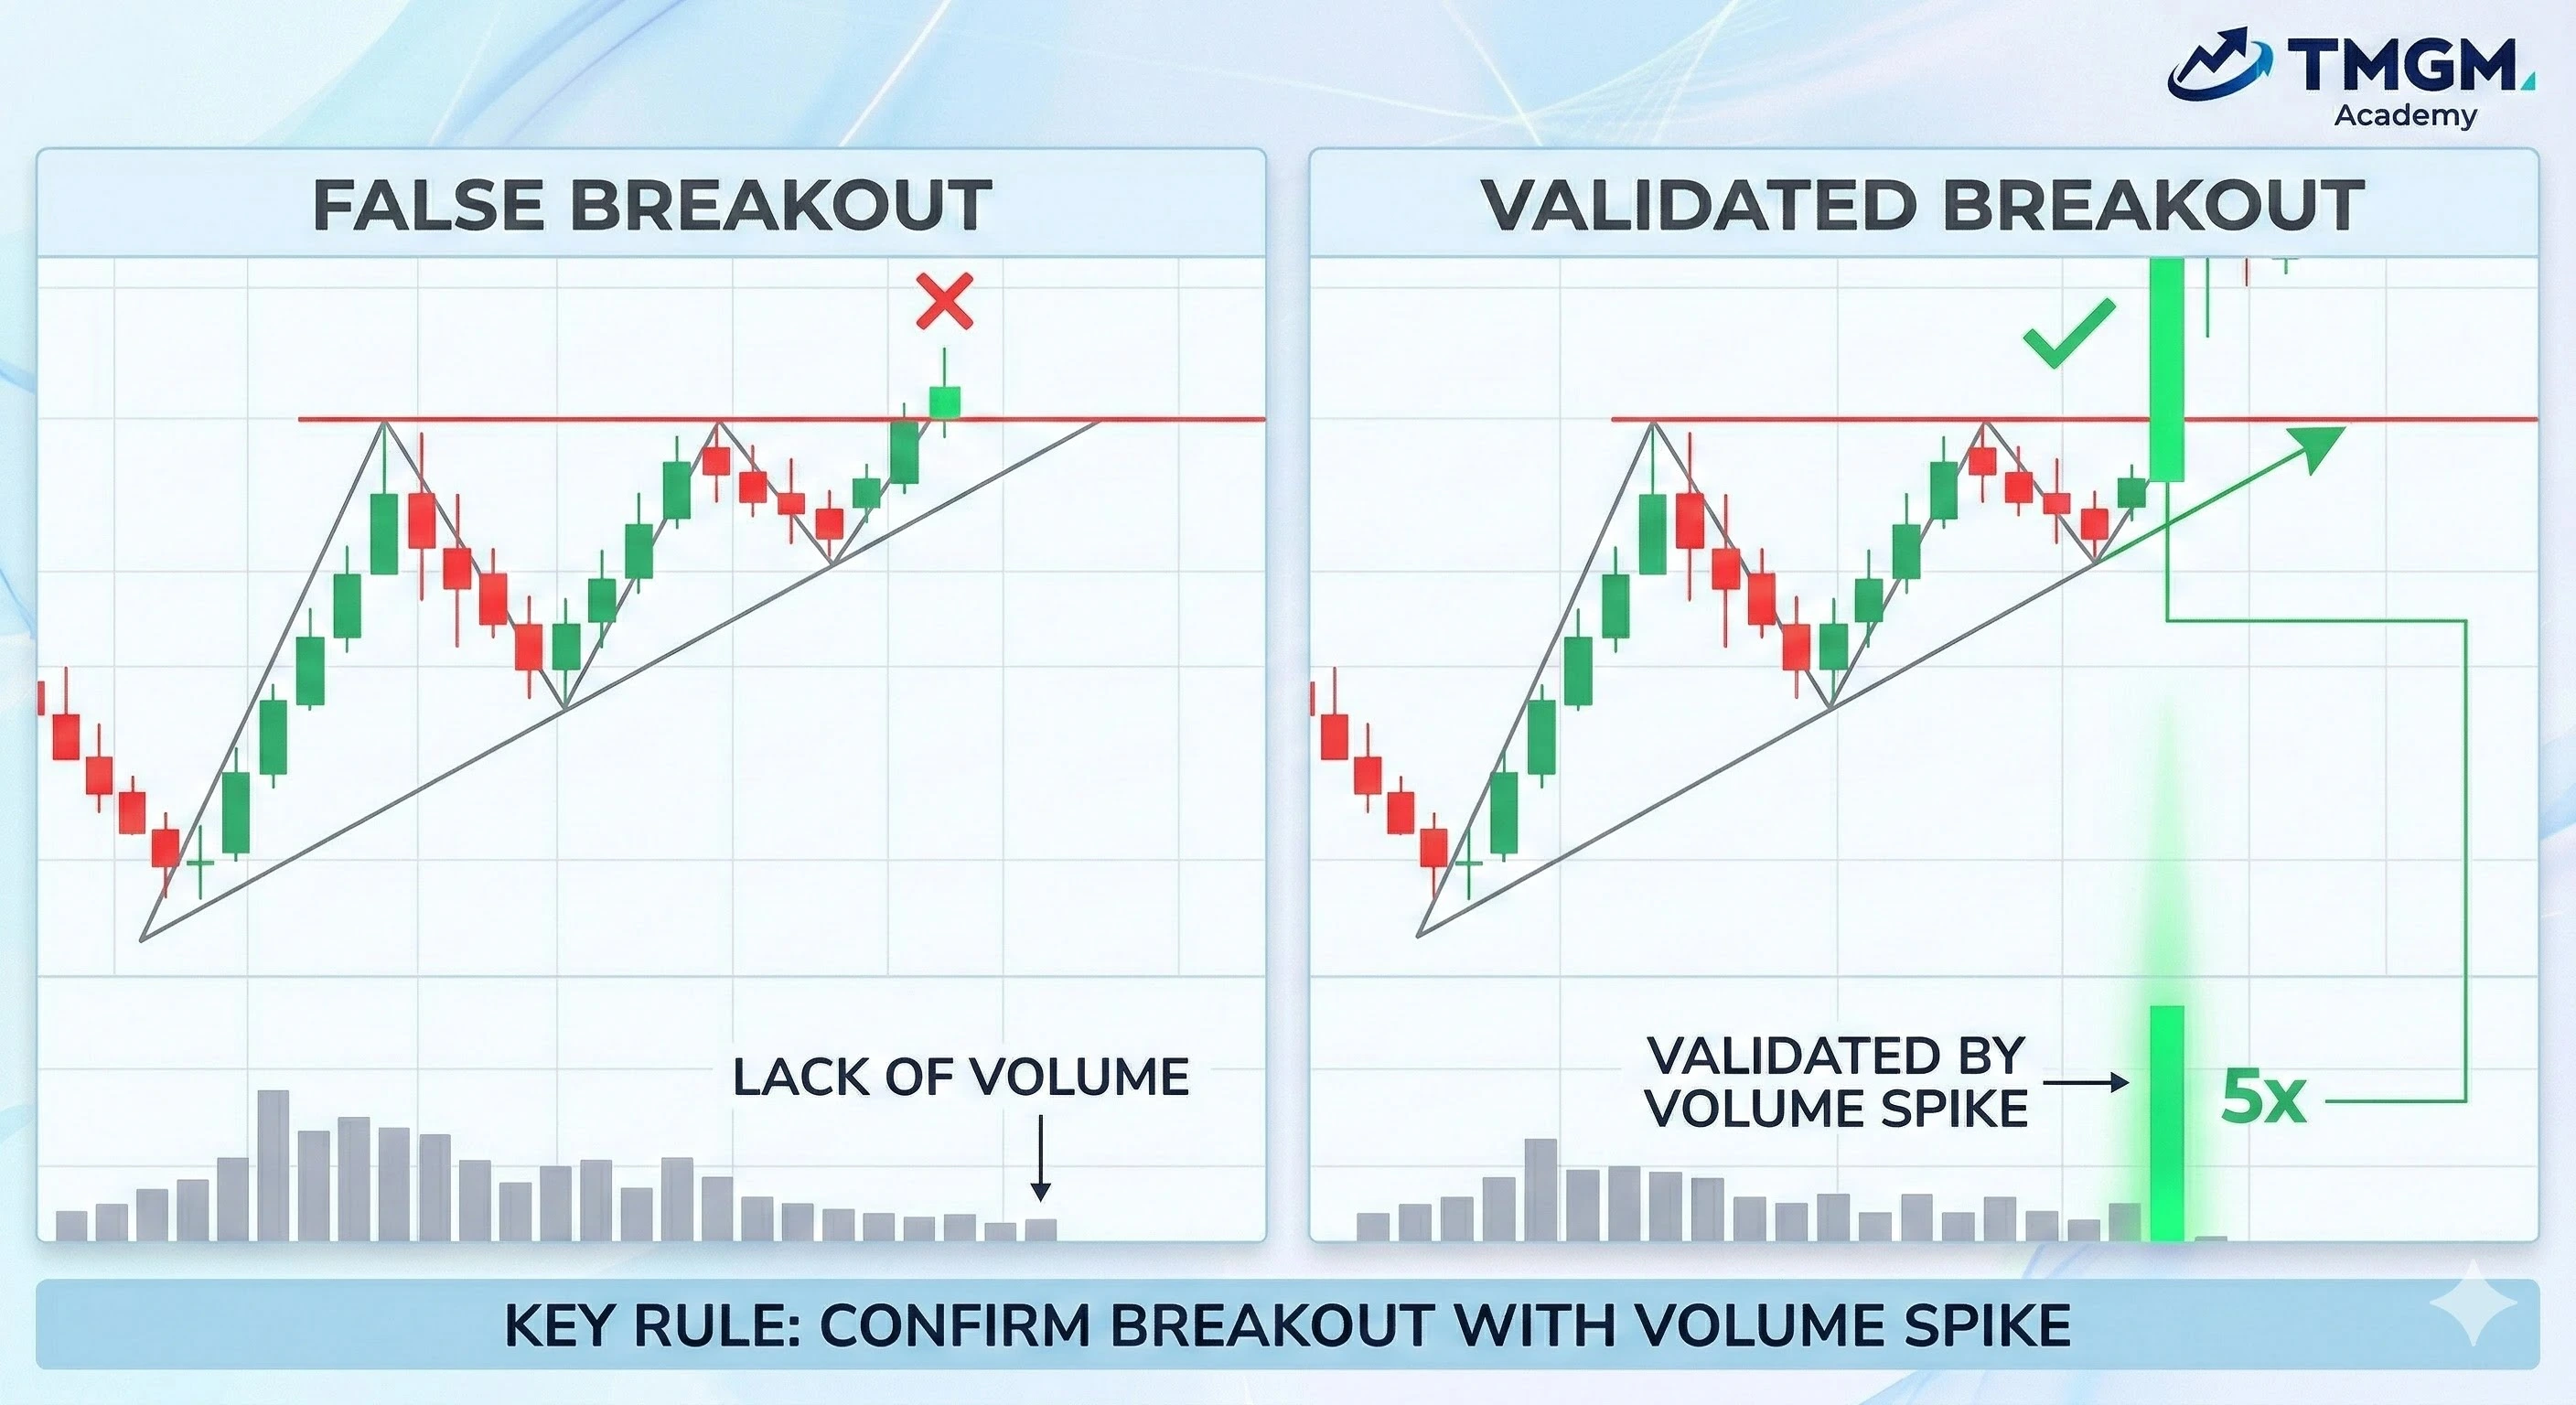
거래량
거래량은 브레이크아웃 검증에 있어 타협할 수 없는 기준입니다. 진정한 구조적 돌파는 반드시 상대 거래량의 유의미한 급증을 동반해야 하며, 이는 브레이크아웃이 충분한 모멘텀에 의해 뒷받침되고 새로운 추세의 지속 가능성을 확인해 줍니다.
현물 FX에서는 거래량이 대체 지표인 경우가 많으므로, 가능하다면 트레이더는 틱 거래량이나 관련 선물 데이터를 사용할 수 있습니다.
거래량이 확대되지 않으면 브레이크아웃은 횡보하거나 실패할 가능성이 더 높습니다. 이 경우 트레이더는 더 강한 종가 마감을 요구하거나 재테스트를 기다리는 방식으로 대응할 수 있습니다.
가격 움직임
가격 움직임 확인은 핵심 가격대 부근의 캔들 종가, 윗꼬리/아랫꼬리, 재테스트에 초점을 맞추며, 셋업의 유효성을 판단하는 데 캔들스틱 차트 패턴 에 엄격히 의존합니다.
아래의 각 요소는 단독으로도 진입 근거가 될 수 있으며, 더 높은 확신의 진입을 위해 여러 확인 요소를 함께 사용할 수도 있습니다.
1개 캔들스틱(저항선 위 종가 마감): 가장 중요한 확인 요소로, 강한 모멘텀을 가진 캔들이 패턴 경계 바깥에서 확실히 마감해야 합니다. 이 시점에서 진입하면 충분한 근거는 되지만 공격적인 진입으로 간주됩니다.
2개 이상 캔들스틱(재테스트): 보다 보수적인 접근은 브레이크아웃 이후 소폭 되돌림이 발생해 이전 저항선을 새로운 지지선으로 테스트할 때까지 기다립니다. 이러한 재테스트는 약한 손을 털어낸 뒤 실제 방향성 움직임이 시작되도록 합니다.
“저항선 위 종가 마감” 캔들스틱과 성공적인 재테스트가 모두 함께 나타나는 것이 가장 이상적입니다.
상위 타임프레임: 거시 차트(예: 일간 또는 주간)에서 신호를 검증하면 미세 타임프레임의 노이즈와 알고리즘 기반 스톱 헌팅을 걸러낼 수 있습니다.
프로 팁:
주요 매매 타임프레임을 바로 위 상위 타임프레임과 항상 연계해, 거시 저항선 바로 아래에서 브레이크아웃을 매매하는 일이 없도록 하세요.
진입 타이밍과 보호 스톱
정교한 진입 메커니즘과 방어적 스톱 배치에 대한 이해는 프로 트레이더와 도박성 매매를 하는 사람을 구분합니다. 적절한 실행을 위해서는 주문 유형을 이해하고 의도적으로 설계된 유동성 스윕을 예상할 수 있어야 합니다.
다음은 설명과 함께 제공되는 몇 가지 차트 패턴 매매 진입 전략입니다 :
진입 스톱
모멘텀 기반 브레이크아웃 전략에서 트레이더는 가격이 브레이크아웃할 때 자동으로 진입 포지션이 실행되도록 패턴' 경계 바로 바깥에 Buy Stop 또는 Sell Stop 주문을 배치합니다.
반대로 박스권 매매에서는 조정 구간의 양 극단에서 최적의 가격을 확보하기 위해 반드시 지정가 주문(Limit Order)을 사용해야 합니다.
거짓 및 실패한 브레이크아웃
거짓 브레이크아웃(또는 "페이크아웃")은 가격이 기술적 경계를 잠시 돌파해 개인 투자자의 스톱로스를 유발한 뒤, 급격히 반전하여 다시 패턴 내부로 되돌아오는 현상입니다. 이러한 움직임은 일반적으로 시장 조성자가 자신의 거시 포지션을 위한 유동성을 확보하기 위해 의도적으로 만들어내는 경우가 많습니다.
보호 스톱
구조적 돌파 실패 시 치명적인 손실 확대를 방지하기 위해 하드 스톱로스는 필수입니다. 배치 위치는 논리적이어야 하며, 일반적으로 브레이크아웃 캔들의 반대편 바로 너머나 최근의 명확한 스윙 저점 뒤에 두는 것이 일반적입니다.
보호 스톱을 활용한 거짓 브레이크아웃 매매
보호 스톱은 트레이더에게 불리한 방향으로 움직일 때 잠재적 손실을 제한하기 위해 설정하는 스톱로스 주문(포지션 청산용)입니다. 브레이크아웃 매매에서는 일반적으로 브레이크아웃 구조의 반대편 너머에 두며, 이는 대개 이전 고점/저점에 따라 달라집니다..
스톱은 스프레드와 일반적인 노이즈를 고려해야 하며, 그래야 정상적이고 예상 가능한 변동성에 의해 포지션이 불필요하게 청산되지 않습니다. 또한 포지션 규모는 스톱 거리로부터 계산해 설정해야 하며, 그 반대가 되어서는 안 됩니다.
일부 숙련된 트레이더는 거짓 브레이크아웃을 적극적으로 추적하며, 그 실패를 반대 방향의 고확률 진입 신호로 활용합니다. 이 경우 페이크아웃 캔들의 극단적인 꼬리 바로 뒤에 보호 스톱을 두면 리스크를 엄격히 제한할 수 있고, 이익 목표는 차트 패턴의 전체 폭까지 확장될 수 있습니다.
중요:
거짓 브레이크아웃을 역추세로 공략할 때는 가격이 패턴 구조 내부로 확실히 종가 복귀할 때까지 기다리세요. 너무 일찍 진입하면 단지 잠시 멈춘 정상적인 브레이크아웃을 잘못 잡을 위험이 있습니다.
차트 패턴 vs 캔들스틱 패턴
차트 패턴 은 삼각형, 웨지, 더블 탑처럼 일반적으로 여러 개의 캔들로 형성되는 더 큰 그림, 즉 시장 구조를 설명합니다. 반면 캔들 차트 패턴 은 더 짧은 신호로, 보통 1~3개의 캔들로 구성되며 더 큰 구조 안에서 타이밍을 확인하는 데 사용됩니다.
트레이더는 일반적으로 차트 패턴으로 가격대와 시나리오를 정의한 뒤, 캔들스틱과 가격 움직임으로 실행 타이밍을 잡습니다. 캔들 패턴 차트에서는 종가와 거부 꼬리가 세션 종료 시점까지 누가 가격을 통제했는지를 보여주기 때문에 확인이 대체로 더 명확합니다.
FAQ
현대의 알고리즘 매매 환경에서도 차트 패턴은 실제로 신뢰할 수 있나요?
네, 다만 차트 패턴은 보장된 예측 모델이라기보다 유동성 구간의 시각적 표현으로 작동합니다. 알고리즘은 고전적 패턴 주변에 형성된 명확한 스톱로스 군집을 적극적으로 겨냥하므로, 현대 시장에서의 신뢰도를 높이려면 멀티 타임프레임 확인과 거래량 분석이 필수적입니다.
일반적인 되돌림과 완전한 패턴 실패는 어떻게 구분하나요?
일반적인 되돌림은 브레이크아웃 구간을 재테스트하는 동안 거래량이 감소하고 몸통이 작은 캔들스틱이 나타나는 특징이 있습니다. 반면 완전한 패턴 실패는 거래량이 확대되고 크고 충동적인 캔들이 브레이크아웃 레벨을 강하게 다시 관통하며 가격을 밀어내는 형태를 보입니다.
지속형 패턴 매매에 가장 효과적인 타임프레임은 무엇인가요?
1시간 및 4시간 타임프레임은 차트 패턴 매매에 가장 적절한 균형을 제공하며, 5분 차트의 알고리즘 노이즈를 걸러내는 동시에 일간 차트보다 더 자주 셋업을 제공합니다. 이 타임프레임에서 식별된 패턴은 항상 상위 일간 추세와 일치해야 합니다.


