


강세 반전 패턴
이러한 패턴은 하락 추세 이후에 나타나며, 상승 방향으로의 잠재적 반전을 시사합니다.
1. 해머 캔들
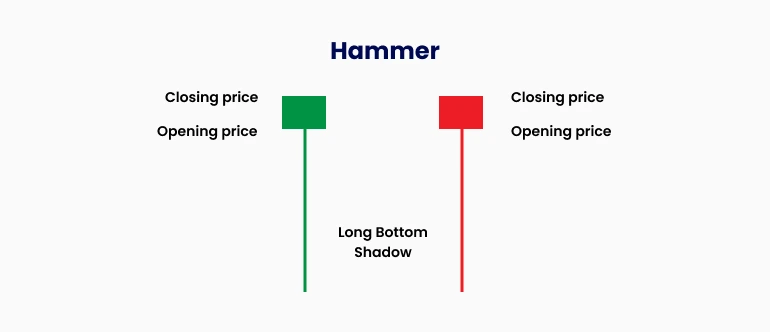
설명: 상단에 작은 몸통이 있고, 일반적으로 몸통 길이의 두 배에 달하는 긴 아래꼬리가 있습니다.
의미: 낮은 가격대에 대한 거부를 나타내며, 잠재적인 매수 압력을 시사합니다.
맥락: 하락 추세 이후에 나타나며, 종종 강세 반전의 첫 신호로 작용합니다.
2. 인버티드 해머 캔들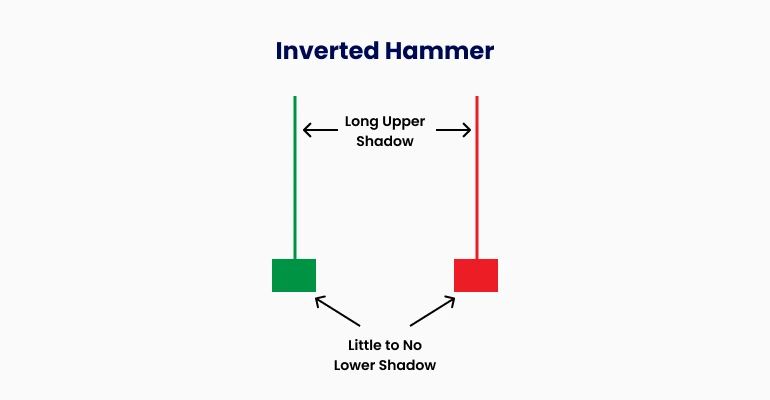
설명: 하단에 작은 몸통이 있고 긴 위꼬리가 있습니다.
의미: 하락 추세 말미에 매도 압력이 약해지면서 강세 반전 가능성을 시사합니다.
확인: 반전을 확인하려면 후속 강세 캔들이 필요합니다.
3. 강세 장악형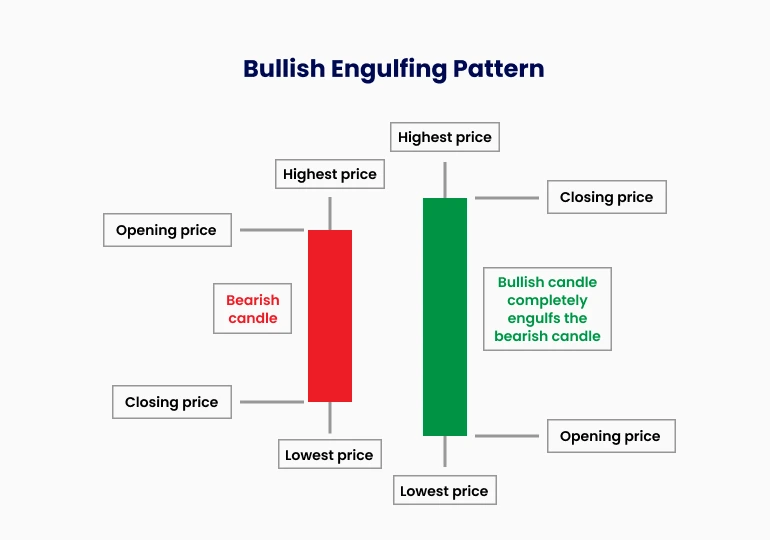
설명: 녹색(강세) 캔들이 이전의 빨간색(약세) 캔들을 완전히 감쌉니다.
의미: 강한 매수 모멘텀을 보여주며, 종종 추가 상승으로 이어집니다.
4. 관통형
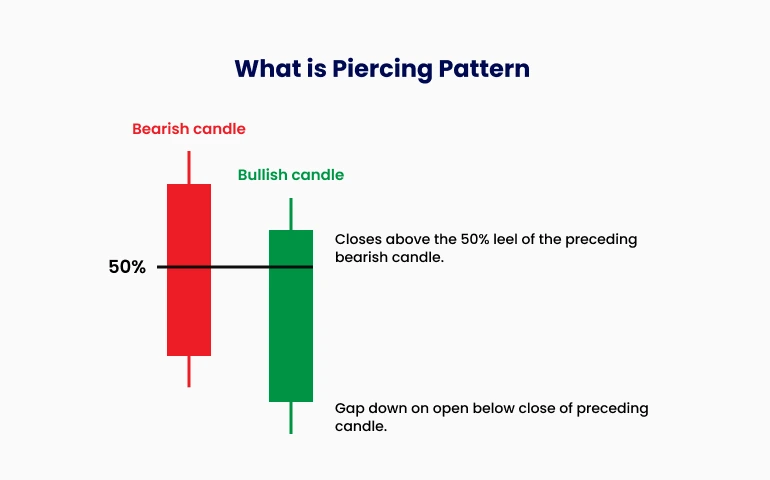
설명: 두 개의 캔들로 이루어진 패턴으로, 두 번째 캔들이 더 낮게 시작하지만 첫 번째 약세 캔들의 중간값 위에서 마감합니다.
의미: 강한 매수세 유입을 나타내며, 추세 반전 가능성을 시사합니다.
5. 모닝 스타
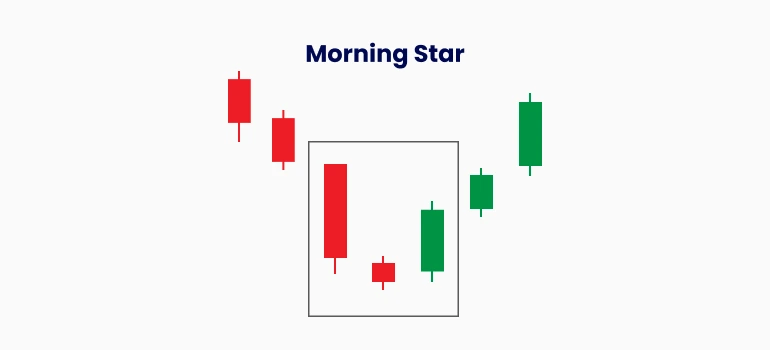
설명: 다음으로 구성된 3개 캔들 패턴입니다:
긴 약세 캔들.
작은 몸통의 방향성 없는 캔들(갭 하락).
첫 번째 약세 캔들의 몸통 안으로 마감하는 강세 캔들.
의미: 매도자에서 매수자로 모멘텀이 전환되고 있음을 나타냅니다.
6. 적삼병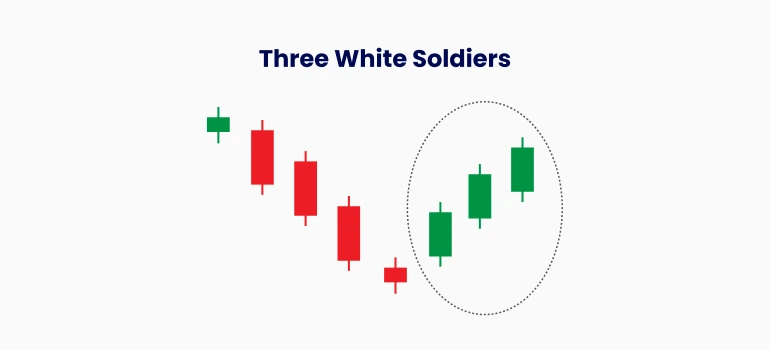
설명: 종가가 점진적으로 높아지는 3개의 연속 강세 캔들입니다.
의미: 강하고 지속적인 매수 압력을 반영하며, 견조한 상승 추세를 시사합니다.
약세 반전 패턴
이러한 패턴은 상승 추세 이후에 발생하며, 잠재적인 하락 가격 움직임을 나타냅니다.
1. 슈팅 스타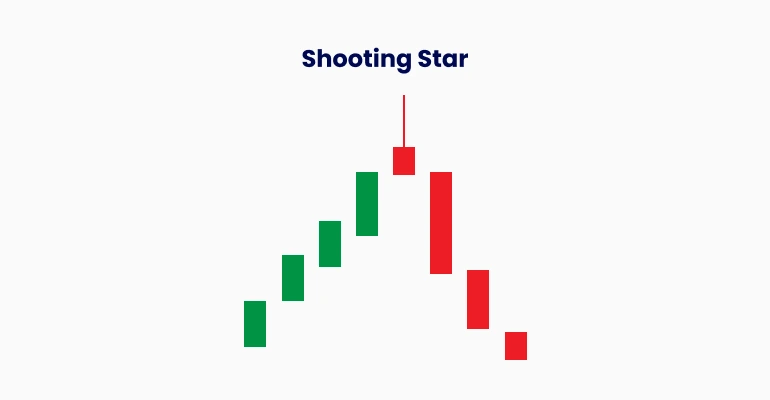
설명: 하단 부근에 작은 몸통이 있고 긴 위꼬리가 있습니다.
의미: 높은 가격대에 대한 거부를 시사하며, 종종 하락 반전을 알립니다.
2. 행잉 맨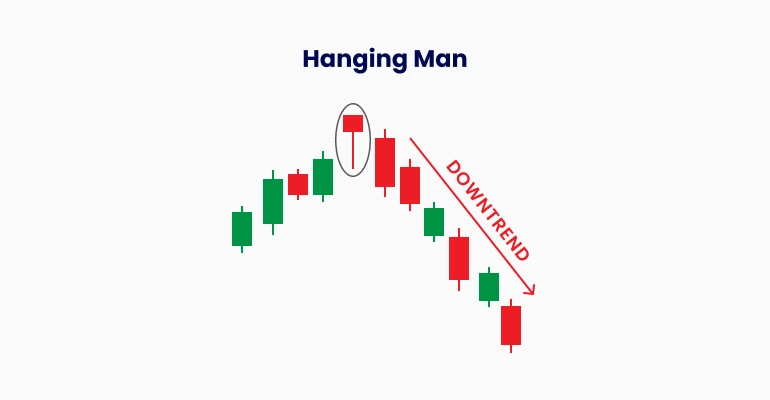
설명: 형태는 해머와 유사하지만 상승 추세의 상단에서 나타납니다.
의미: 매수 압력이 약해지면서 잠재적인 약세 반전을 경고합니다.
3. 약세 장악형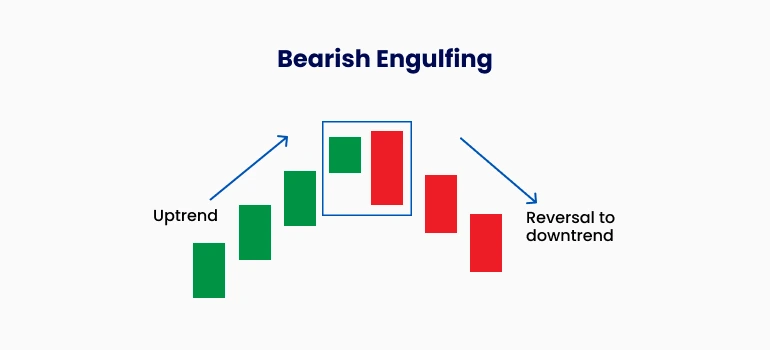
설명: 빨간색(약세) 캔들이 이전의 녹색(강세) 캔들을 완전히 감쌉니다.
의미: 강한 매도 모멘텀과 추세 반전 가능성을 나타냅니다.
4. 먹구름형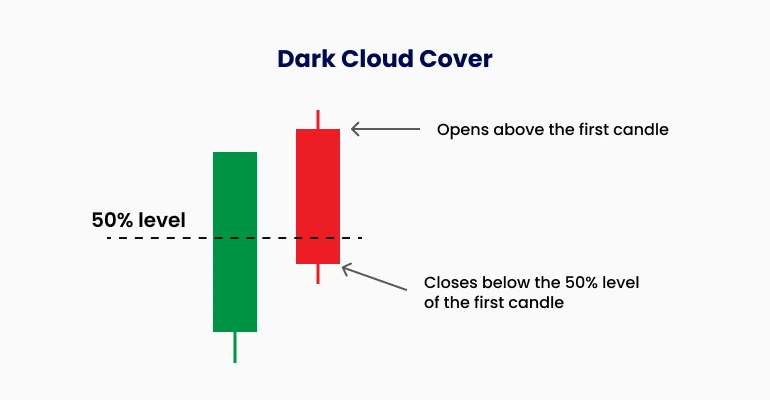
설명: 두 개의 캔들로 이루어진 패턴으로, 두 번째 캔들이 더 높게 시작하지만 첫 번째 강세 캔들의 중간값 아래에서 마감합니다.
의미: 공격적인 매도 압력을 나타내며, 반전 가능성을 시사합니다.
5. 이브닝 스타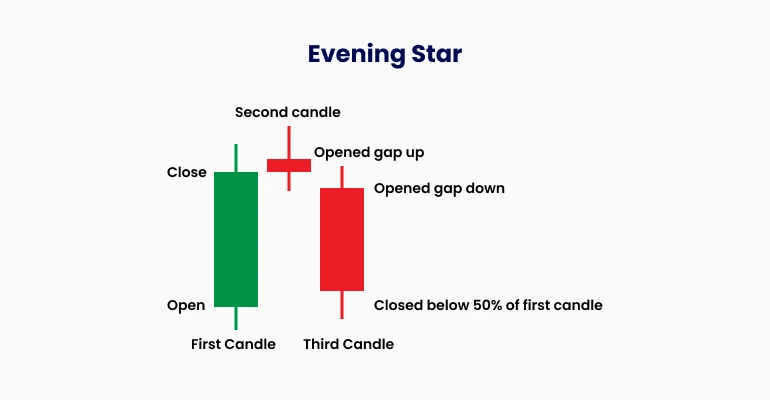
설명: 다음으로 구성된 3개 캔들 패턴입니다:
긴 강세 캔들.
작은 몸통의 방향성 없는 캔들(갭 상승).
첫 번째 강세 캔들의 몸통 안으로 마감하는 약세 캔들.
의미: 매수 우위에서 매도 우위로의 전환을 보여줍니다.
6. 흑삼병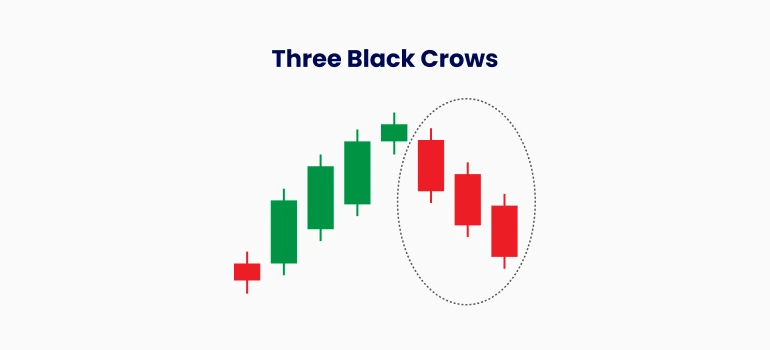
설명: 종가가 점진적으로 낮아지는 3개의 연속 약세 캔들입니다.
의미: 강하고 지속적인 매도 압력을 반영하며, 하락 추세의 시작을 시사합니다.
중립/지속 패턴
이러한 패턴은 시장의 방향성 부재 또는 기존 추세의 지속을 나타냅니다.
1. 도지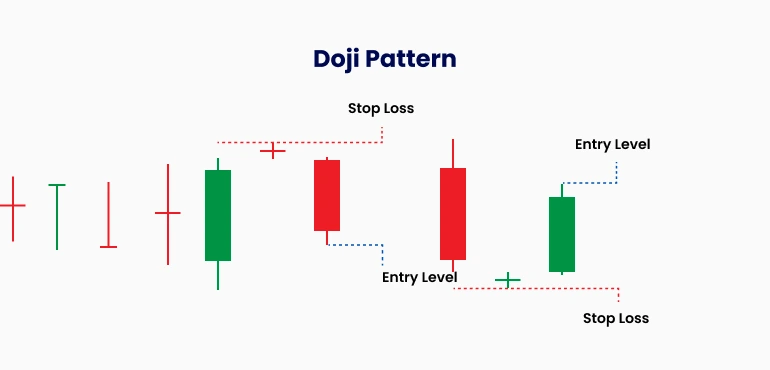
설명: 시가와 종가가 거의 같아 몸통이 거의 없거나 전혀 없는 캔들입니다.
의미: 시장의 방향성 부재를 반영합니다. 맥락에 따라 반전 또는 지속 신호가 될 수 있습니다.
2. 스피닝 탑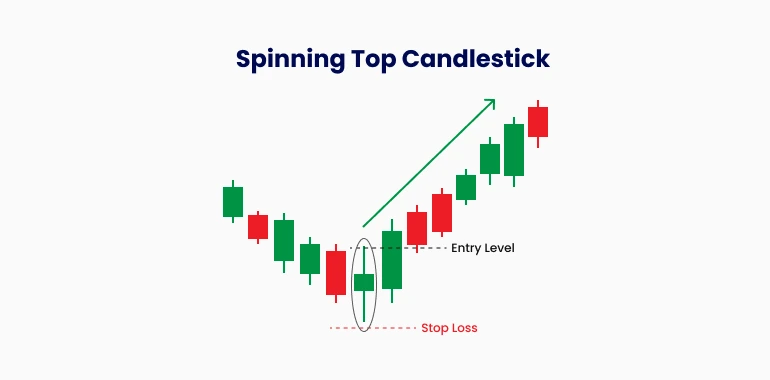
설명: 작은 몸통에 긴 위꼬리와 아래꼬리가 있는 형태입니다.
의미: 시장의 방향성 부재를 나타내며, 종종 박스권 또는 횡보 구간에서 발견됩니다.
3. 마루보즈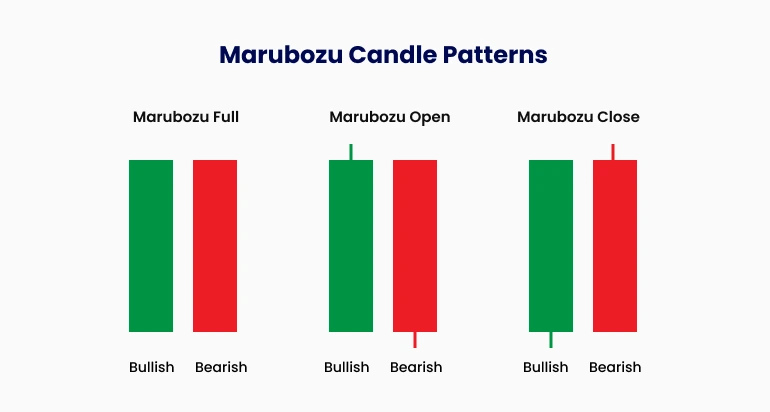
설명: 시가와 종가가 양 끝단에서 형성되어 꼬리가 없는 캔들입니다.
강세 마루보즈: 강한 매수 모멘텀을 보여줍니다.
약세 마루보즈: 강한 매도 압력을 나타냅니다.
4. 하라미
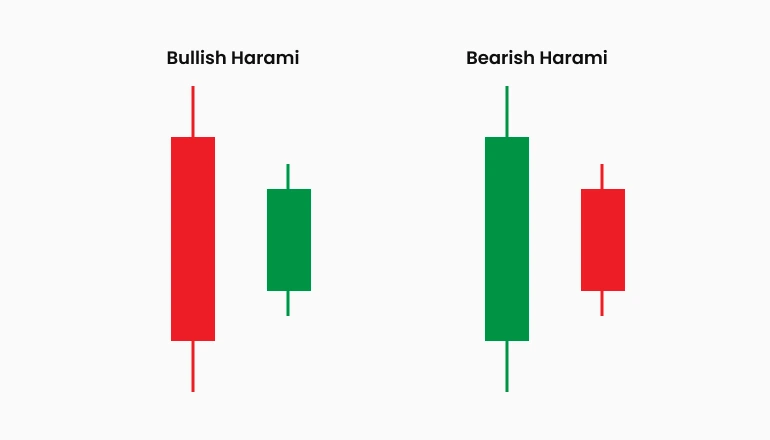
설명: 두 개의 캔들로 이루어진 패턴으로, 두 번째 캔들이 더 작고 첫 번째 캔들의 몸통 안에 포함됩니다.
강세 하라미: 하락 추세의 바닥에서 발견되며, 잠재적인 반전을 시사합니다.
약세 하라미: 상승 추세의 상단에서 발견되며, 잠재적인 반전을 시사합니다.
활용 팁
지표 결합: 정확도를 높이기 위해 캔들스틱 패턴을 거래량, RSI 또는 이동평균선과 같은 다른 도구와 함께 사용하세요
상위 타임프레임: 패턴은 일반적으로 더 높은 타임프레임에서 더 신뢰도가 높습니다.
확인 대기: 실행에 옮기기 전에 항상 추가 신호(예: 후속 캔들)를 확인하세요.


