
Key Takeaways
The Gold to Oil Ratio shows how many barrels of oil one ounce of gold can buy.
In 2026, the ratio broke down sharply from 78 to 43, then stabilized near 52, showing a major repricing between gold and oil.
Historically, the ratio has often stabilized around 10 to 30 barrels, so elevated readings can suggest abnormal conditions.
The ratio is useful for historical comparison and market context, but it is not a standalone trading indicator.
What is Gold to Oil Ratio
The Gold to Oil Ratio is a simple mathematical ratio that compares the price of one ounce of gold with the price of one barrel of crude oil. It shows how many barrels of oil can be bought with the value of one ounce of gold.
The ratio is commonly used to study the historical relationship between gold prices and oil prices. It helps traders and analysts judge whether oil looks relatively expensive or cheap compared with gold.
Gold to Oil Ratio’s Current Status in 2026
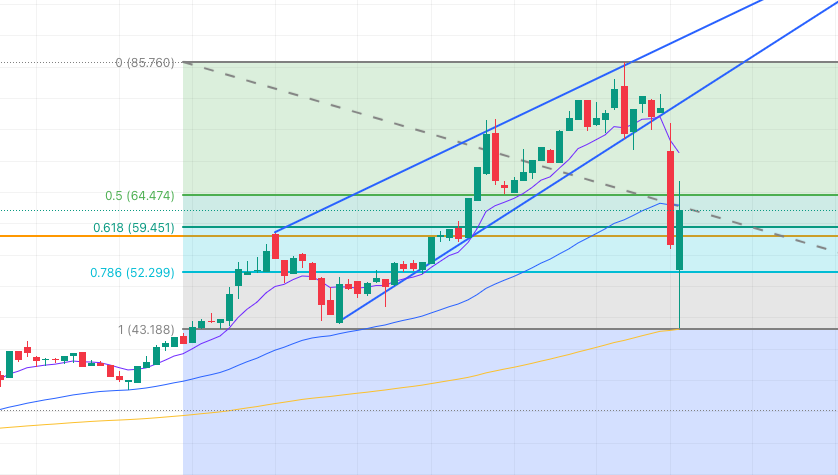
In 2026, the Gold to Oil Ratio Weekly Chart moved sharply lower. After breaking down from around 78 barrels on the triangle’s support line, it continued lower aggressively, briefly hit 43 barrels, and then stabilized near 52 barrels within a few days.
This was a major compression move. It showed that oil prices surged rapidly over a very period of time due to the Iran War.
Historical Average
Historically, the ratio has often stabilized around 10 to 30 barrels of oil for 1 ounce of gold. That long term range is important because it gives context to whether the current reading looks stretched or closer to historical norms.
A reading well above that historical zone usually reflects unusual market conditions (Like the current Iran US War). These can include an oil price collapse, a gold price surge, or a temporary mismatch between the two assets.
Important: A high or low ratio is not a trade signal by itself. It is a relative value reference.
Interpretation and Significance of Gold to Oil Ratio
The main value of the Gold to Oil Ratio is interpretation, not prediction. It shows how oil is behaving relative to gold over time and whether that relationship looks unusually stretched.
An abnormally high ratio often raises the possibility of mean reversion. In practical terms, that can suggest oil prices may not sustain at unusually distorted levels forever and may eventually move back toward more normal relative pricing versus gold.
How Traders Use the Gold to Oil Ratio
Traders mainly use the Gold to Oil Ratio as a macro context tool to help them decide if they should invest in Gold, sometimes, it helps them decide if they should invest in oil too. It helps frame whether the current relationship between gold and oil looks historically normal, compressed, or stretched.
It can also support broader market interpretation. For example, a falling ratio often means oil is strengthening faster than gold, while a rising ratio often means gold is outperforming oil or oil is weakening faster.
Pro Tip: Use the ratio with price structure, macro context, and supply conditions, not in isolation.
Limitations of Gold to Oil Ratio
The Gold to Oil Ratio is only a mathematical relationship. It does not explain every driver behind gold or oil prices, and it should not be treated as a standalone forecast model.
Gold and oil respond to different forces. Gold reacts strongly to real yields, central bank demand, and risk aversion, while oil is more sensitive to supply disruptions, production policy, and global demand conditions.
That is why the ratio is useful as an additional layer of insight, but not as a direct predictor of future price movement.
FAQ
What does a high Gold to Oil Ratio mean?
A high Gold to Oil Ratio means one ounce of gold can buy more barrels of oil than usual. This often suggests oil is relatively weak, gold is relatively strong, or both.
Is the Gold to Oil Ratio a trading indicator?
No. The Gold to Oil Ratio is not a standalone trading indicator. It is a relative value measure that helps provide market context.
What is the historical average Gold to Oil Ratio?
Historically, the ratio has often stabilized around 10 to 30 barrels of oil for one ounce of gold. That range is commonly used as a long term reference point when assessing whether the current ratio looks stretched.


