


Supply and demand zones: the basics
Supply and demand are grounded in technical analysis, specifically price action. Traders look for robust areas that form a strong climb or decline.
A demand zone is an area in the price chart that, when reached, sees buyers' desires beginning to exceed sellers' desires. In other words, the buy volume becomes higher than the sell volume. At this point, the price stops falling, and an incline begins. The support zone operates oppositely.
The four key areas of interest are illustrated below:
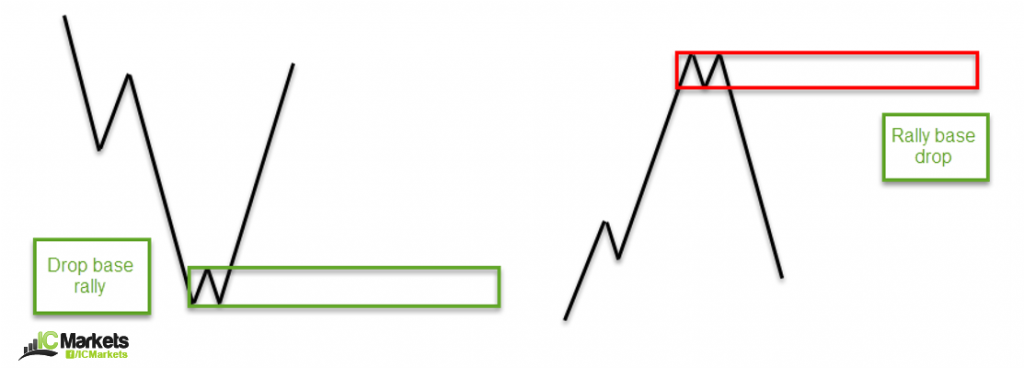
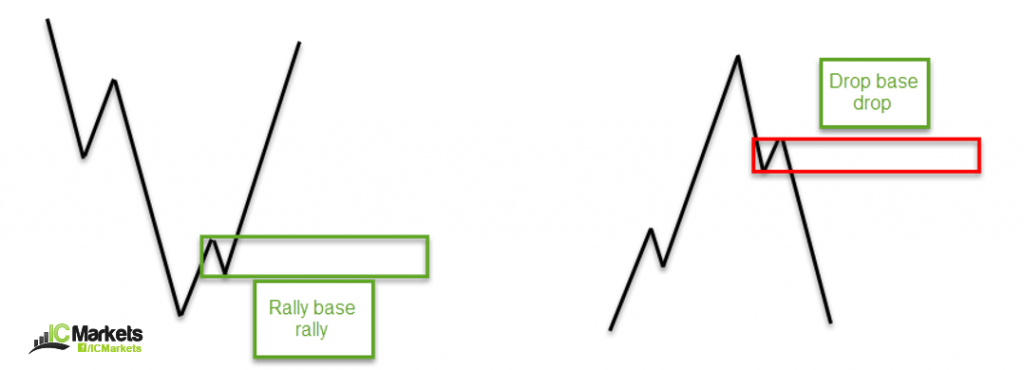
A rally base rally zone usually forms in an uptrend, though it can also be seen at the start of trends.
A drop-base drop supply zone is similar to a rally-base rally zone, except it forms during a downtrend or at the beginning of a trend.
A drop base rally demand is a zone usually denoting a bottom.
A rally-based drop supply forms similarly to a drop-based rally; the only difference is that the pattern prints a market top and follows through with a move lower.
What’s the difference between supply and demand and support and resistance?
There’s no definite answer to this question. According to studies, support and resistance are lines that have held a price in history and may do so again in the future. Supply and demand, on the other hand, involves a recent move and an untouched base. The base is what attracts traders. Tools like Fibonacci retracements can help frame where these zones might align with pullbacks.
Momentum
Supply and demand areas with good momentum that engulf nearby highs/lows are positive indicators. These traits signal that prices moved with little opposition. Momentum context can be cross-checked with indicators like RSI or MACD.
Healthy momentum out of the base is needed as it informs traders of areas with high potential. In practice, you might filter for setups that offer a favorable risk-reward ratio.
Duration
How long the price stays away from a supply or demand area is also crucial.
There’s a belief that supply and demand zones work as institutional traders leave unfilled orders at the base of these areas, but it’s unlikely that traders would leave orders in the market for that long.
However, research has shown that areas where the price moves quickly from its zone appear to be the higher-probability frameworks for trading.
Fresh
To consider a supply or demand area “fresh”, it needs to meet two conditions: zone forms without other structures' help and cannot form from a reaction to another zone.
Trend direction for supply and demand zones
Trading according to the market trend is advantageous; traders must consider the market's reversal pattern. Just because a trend forms on the H1 doesn’t mean the daily timeframe will have a similar trend. If the daily timeframes, H1 and H4, show a comparable trend, the likelihood of a successful trade from an H1 supply or demand area increases. For a structured workflow, consider a top-down analysischecklist.
Traders should also utilize multi-time frame analysis. Though trading short from a supply zone may seem great, if the higher-timeframe structure poses an obstacle, traders may sell into a daily demand area. The bigger picture is important for trend and structure.
Using supply and demand in your trading
When used correctly, traders can benefit greatly from utilizing supply and demand in their strategy. Here are some additional points to confirm the validity of an area:
Trend line convergence. If the trend line meets your chosen zone, the chance of a bounce increases. Review how to draw and validate them with our guide to trading with trend lines.
Is there a long-term support/resistance level intersecting with the area? Pair zone selection with your broader trading strategy and position sizing via the trading calculator.
If you want to put your newfound knowledge to use, try a demo account. You can also practice identifying zones on MT4 or MT5.




















