
AUD/USD Price Forecast: Hovers around 0.6700, nine-day EMA
작성자 Akhtar Faruqui
게시일: 14 Jan 2026 | 수정일: 14 Jan 2026


인기 기사

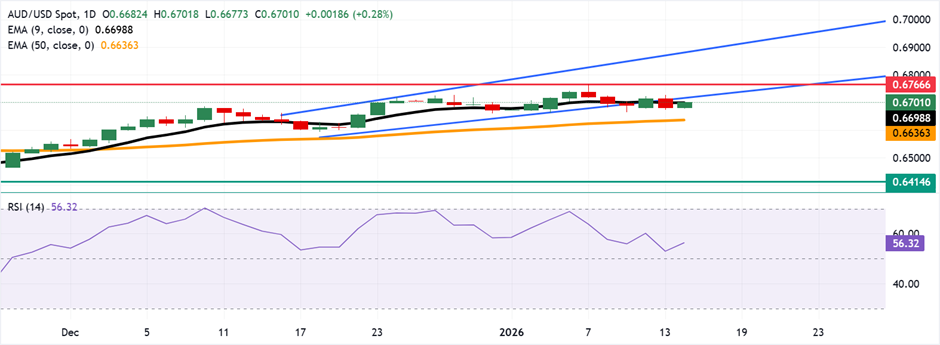
The AUD/USD pair is recovering its recent losses registered in the previous session, trading around 0.6700 during the European hours on Wednesday. The daily chart’s technical analysis indicated a weakening bullish bias as the pair is positioned slightly below the ascending channel pattern.
- AUD/USD rebounded toward the ascending channel.
- The 14-day Relative Strength Index at 56.32 signals improving momentum.
- The pair is hovering around the nine-day EMA of 0.6698.
The AUD/USD pair is recovering its recent losses registered in the previous session, trading around 0.6700 during the European hours on Wednesday. The daily chart’s technical analysis indicated a weakening bullish bias as the pair is positioned slightly below the ascending channel pattern.
The 14-day Relative Strength Index (RSI) at 56.32 is neutral and firming, confirming improving momentum. As long as RSI holds above 50, the pair could maintain the uptrend. Additionally, the AUD/USD pair holds above the rising 50-day Exponential Moving Average (EMA). The nine-day EMA is trending higher, keeping the near-term bias positive.
On the upside, a rebound within the ascending channel would improve the bullish bias and help the AUD/USD pair to target 0.6766, its highest level since October 2024. A decisive break could open a continuation higher toward the upper boundary of the ascending channel near 0.6880.
The immediate support lies at the nine-day Exponential Moving Average (EMA) of 0.6698. A close below the short-term average would undermine the tone and expose the mentioned support at the 50-day EMA at 0.6636. Further losses would open the downside toward 0.6414, the lowest since June 2025.
Australian Dollar Price Today
The table below shows the percentage change of Australian Dollar (AUD) against listed major currencies today. Australian Dollar was the strongest against the Swiss Franc.
| USD | EUR | GBP | JPY | CAD | AUD | NZD | CHF | |
|---|---|---|---|---|---|---|---|---|
| USD | 0.00% | -0.06% | 0.05% | 0.04% | -0.17% | -0.10% | 0.04% | |
| EUR | -0.00% | -0.06% | 0.02% | 0.04% | -0.17% | -0.10% | 0.04% | |
| GBP | 0.06% | 0.06% | 0.11% | 0.10% | -0.10% | -0.05% | 0.10% | |
| JPY | -0.05% | -0.02% | -0.11% | 0.00% | -0.20% | -0.14% | 0.01% | |
| CAD | -0.04% | -0.04% | -0.10% | -0.01% | -0.21% | -0.14% | 0.00% | |
| AUD | 0.17% | 0.17% | 0.10% | 0.20% | 0.21% | 0.07% | 0.21% | |
| NZD | 0.10% | 0.10% | 0.05% | 0.14% | 0.14% | -0.07% | 0.14% | |
| CHF | -0.04% | -0.04% | -0.10% | -0.01% | -0.01% | -0.21% | -0.14% |
The heat map shows percentage changes of major currencies against each other. The base currency is picked from the left column, while the quote currency is picked from the top row. For example, if you pick the Australian Dollar from the left column and move along the horizontal line to the US Dollar, the percentage change displayed in the box will represent AUD (base)/USD (quote).
(The technical analysis of this story was written with the help of an AI tool.)

Acuity Trading은 2013년에 설립된 런던 기반 핀테크로, AI 기반 대체 데이터와 심리 분석을 통해 트레이딩과 투자를 지원합니다. 시각화된 뉴스와 심리 도구로 온라인 트레이딩 경험을 혁신했으며, 최신 AI 연구와 기술로 알파를 창출하는 대체 데이터와 높은 몰입도의 트레이딩 도구를 제공하며 시장을 선도하고 있습니다.
더 읽기


