
Trade The World
Bitcoin Price Forecast: BTC retests $116K as industry leaders push for BITCOIN Act on Capitol Hill
작성자 Manish Chhetri
게시일: 16 Sep 2025 | 수정일: 16 Sep 2025


POPULAR ARTICLES

Bitcoin (BTC) is testing the $116,000 level again on Tuesday. A firm close above this level would suggest gains toward $120,000. Institutional demand is growing, with over $260 million in BTC spot Exchange Traded Funds (ETF) inflows on Monday and firms like Strategy adding BTC to their reserves.
- Bitcoin reclaims resistance at $116,000, with a breakout potentially opening the path to $120,000.
- Industry leaders like Michael Saylor and Fred Thiel will promote BITCOIN Act on Capitol Hill.
- Institutional demand strengthens with over $260 million in ETF inflows on Monday, and Strategy adds 525 BTC to its reserves.
Bitcoin (BTC) is testing the $116,000 level again on Tuesday. A firm close above this level would suggest gains toward $120,000. Institutional demand is growing, with over $260 million in BTC spot Exchange Traded Funds (ETF) inflows on Monday and firms like Strategy adding BTC to their reserves. Traders’ attention now turns to the Capitol Hill event, where industry leaders, such as Michael Saylor and Fred Thiel, will promote the BITCOIN Act.
Could the US set a Bitcoin reserve?
Prominent crypto leaders, including Strategy co-founder Michael Saylor and Marathon Digital CEO Fred Thiel, will gather on Tuesday at a Capitol Hill roundtable to promote the BITCOIN Act.
The BITCOIN Act, reintroduced by Senator Cynthia Lummis in March, proposes that the US government purchase 1 million BTC over five years — a move that, if passed, could boost adoption, improve regulatory clarity, and strengthen the long-term bullish outlook for Bitcoin and position the US as a leading global hub for cryptocurrencies.

Growing institutional inflow and corporate demand for BTC
Despite BTC facing slight rejection around the $116,000 at the start of this week, institutional and corporate demand continues to strengthen. According to SoSoValue data, as shown below, Bitcoin spot Exchange Traded Funds (ETFs) recorded an inflow of $260.02 on Monday, continuing its streak of positive flows since September 8. If this inflow continues and intensifies, BTC could experience further price recovery.
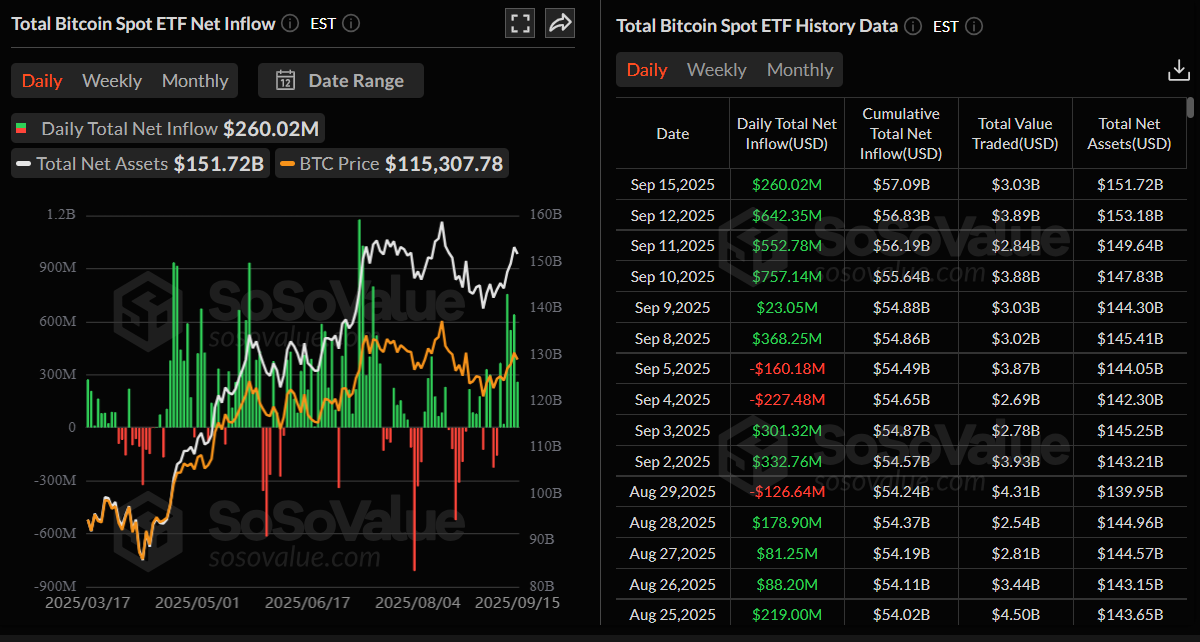
Total Bitcoin spot ETF net inflow daily chart. Source: SoSoValue
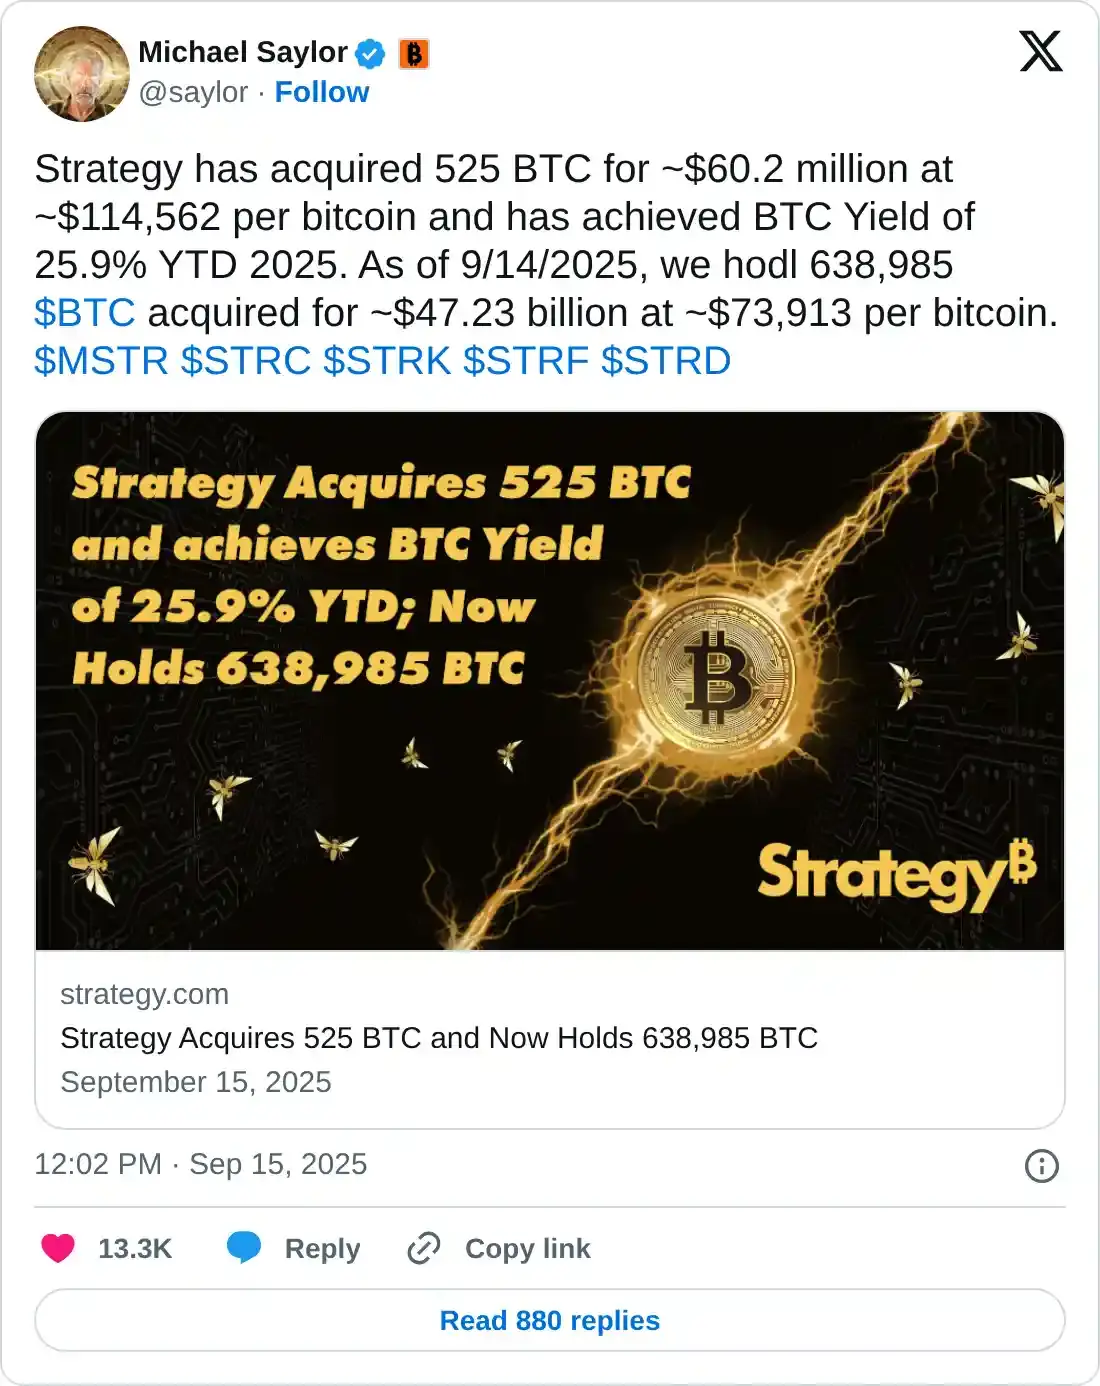
On the corporate front, demand continues to grow as Strategy co-founder Michael Saylor announced on social network X on Monday that his company has added 525 BTC to its reserve, bringing the total holding to 638,985 BTC. During the same period, other firms, including Capital B and Prenetics, also added a total of 88.6 BTC.
Additionally, NEXT Technology Holding Inc. has filed a Form S-3 registration statement with the US Securities and Exchange Commission (SEC), seeking to raise up to $500 million through a shelf offering. The company intends to use the proceeds for general corporate purposes, including working capital, research and development expenses, potential acquisitions, and the purchase of Bitcoin.
US stocks hit record highs while BTC is lagging
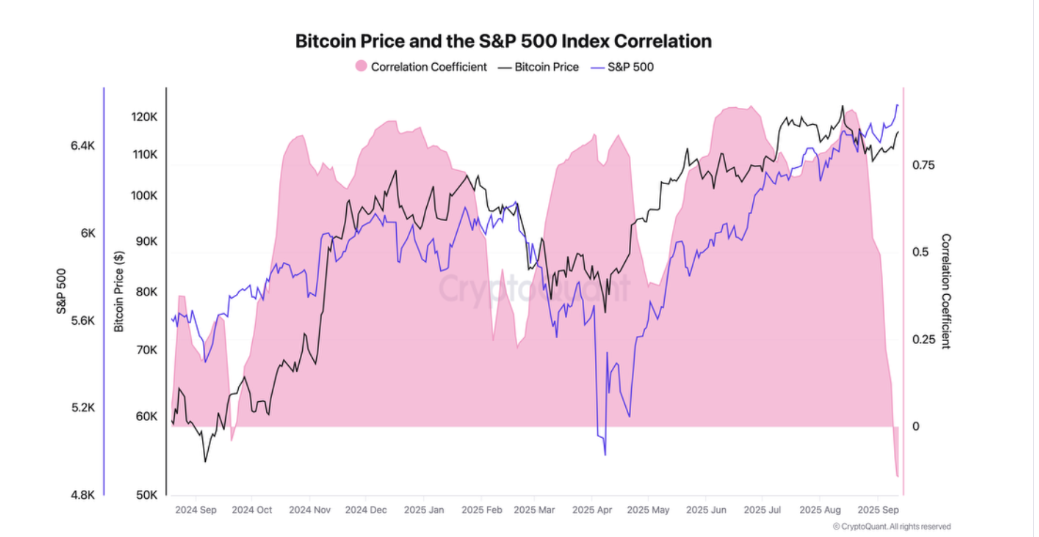
CryptoQuant data indicate that Bitcoin’s price trend has once again decoupled from the S&P 500, marking the first time in a year. The index closed above 6,600 on Monday, setting a new record high, while BTC closed below $116,000 that same day. Historically, when such divergences have occurred between BTC and the S&P 500, BTC has later caught up and even outperformed. If history repeats, this current decoupling could hint at Bitcoin preparing for a strong rally once it regains momentum.
QCP Capital’s report on Monday highlighted that BTC’s recovery from its September lows near $107,000 looks solid but contained. The Federal Reserve’s (Fed) near-term monetary easing path is clear, yet sticky US core inflation and weak job growth could complicate the outlook. Until there is more clarity, markets may tread water before their next decisive move.
Bitcoin Price Forecast: BTC reattempts to surpass $116,000 resistance
Bitcoin price recovered slightly last week but faced resistance around the daily level of $116,000 on Saturday and experienced a mild rejection the next day. At the start of this week, on Monday, BTC reattempted to close above this resistance but failed to do so. At the time of writing on Tuesday, it hovers around $115,500.
If BTC closes above the daily resistance level at $116,000 on a daily basis, it could extend the rally toward its psychological level at $120,000.
The Relative Strength Index (RSI) on the daily chart reads 57, remaining steady above the midline and reflecting slight bullish momentum. The Moving Average Convergence (MACD) indicator on the same chart displayed a bullish crossover on September 6, which remains in effect, indicating sustained bullish momentum and an upward trend ahead.
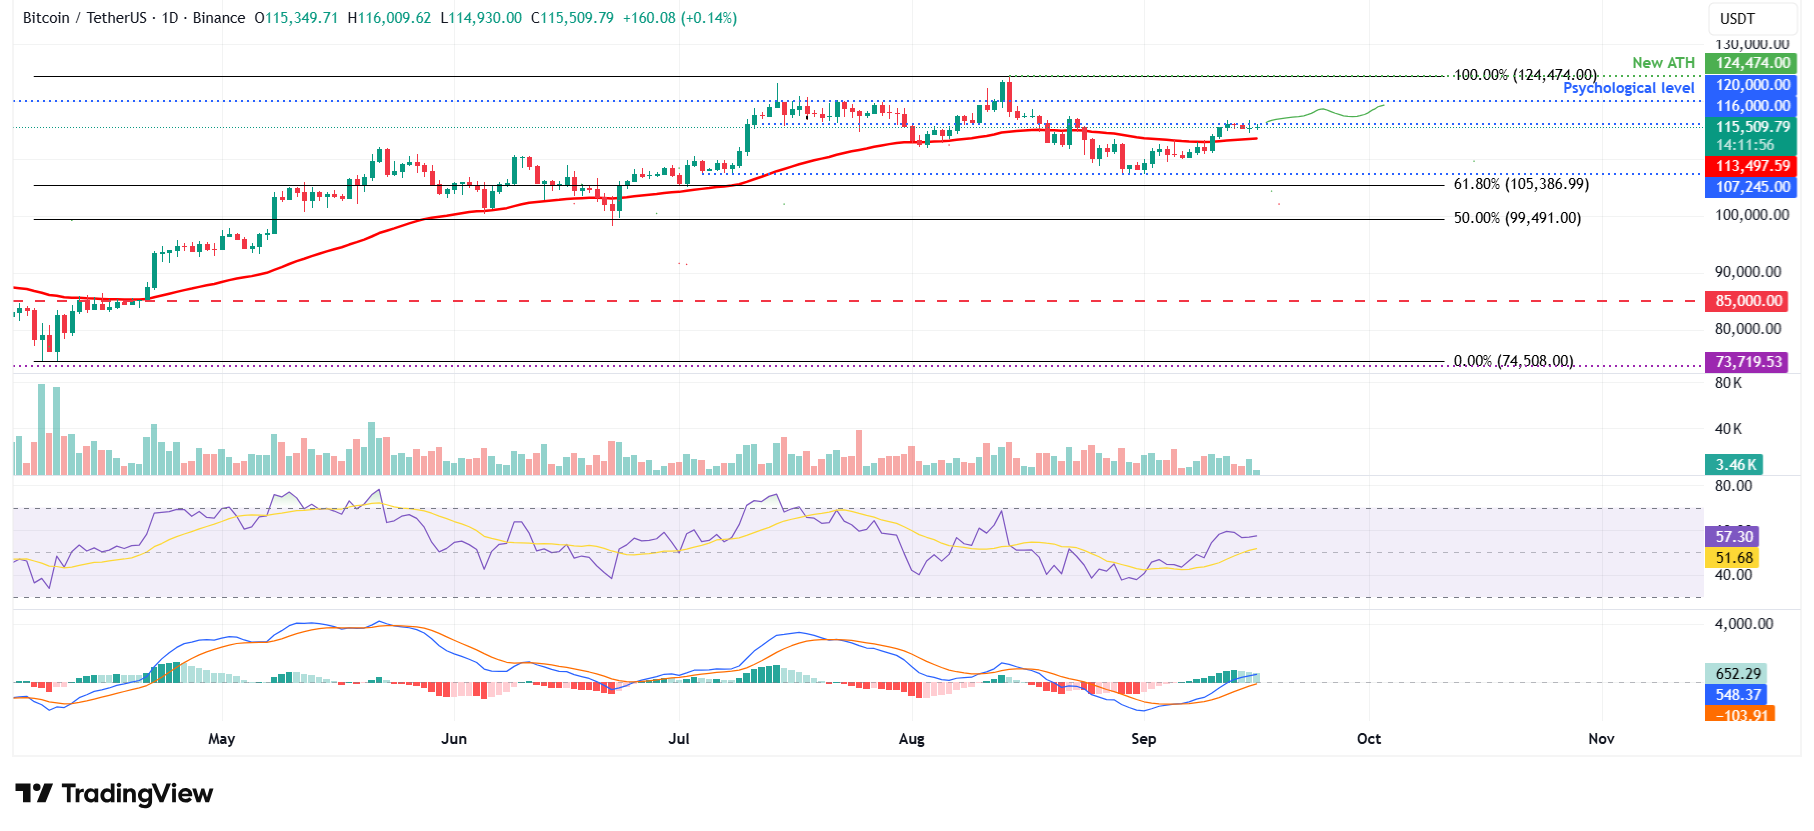
BTC/USDT daily chart
On the contrary, if BTC fails to close above the $116,000 resistance level and continues to correct, it could extend the decline toward its 50-day Exponential Moving Average (EMA) at $113,497.
Cryptocurrency metrics FAQs
The developer or creator of each cryptocurrency decides on the total number of tokens that can be minted or issued. Only a certain number of these assets can be minted by mining, staking or other mechanisms. This is defined by the algorithm of the underlying blockchain technology. On the other hand, circulating supply can also be decreased via actions such as burning tokens, or mistakenly sending assets to addresses of other incompatible blockchains.
Market capitalization is the result of multiplying the circulating supply of a certain asset by the asset’s current market value.
Trading volume refers to the total number of tokens for a specific asset that has been transacted or exchanged between buyers and sellers within set trading hours, for example, 24 hours. It is used to gauge market sentiment, this metric combines all volumes on centralized exchanges and decentralized exchanges. Increasing trading volume often denotes the demand for a certain asset as more people are buying and selling the cryptocurrency.
Funding rates are a concept designed to encourage traders to take positions and ensure perpetual contract prices match spot markets. It defines a mechanism by exchanges to ensure that future prices and index prices periodic payments regularly converge. When the funding rate is positive, the price of the perpetual contract is higher than the mark price. This means traders who are bullish and have opened long positions pay traders who are in short positions. On the other hand, a negative funding rate means perpetual prices are below the mark price, and hence traders with short positions pay traders who have opened long positions.

Acuity Trading
Acuity Trading은 2013년에 설립된 런던 기반 핀테크로, AI 기반 대체 데이터와 심리 분석을 통해 트레이딩과 투자를 지원합니다. 시각화된 뉴스와 심리 도구로 온라인 트레이딩 경험을 혁신했으며, 최신 AI 연구와 기술로 알파를 창출하는 대체 데이터와 높은 몰입도의 트레이딩 도구를 제공하며 시장을 선도하고 있습니다.
Read More


