
Cardano Price Forecast: ADA keeps the broader backdrop bearish as trendline caps recovery
작성자 Manish Chhetri
게시일: 9 Mar 2026 | 수정일: 9 Mar 2026


인기 기사

Cardano (ADA) price trades at $0.25 as of Monday, after falling nearly 9% in the previous week. The ongoing geopolitical conflicts dampen the broader risk sentiment.
- Cardano trades at $0.25 on Monday, down nearly 9% from the previous week.
- Metrics show a negative bias as open interest falls steadily alongside decreasing daily active addresses.
- The technical outlook suggests a deeper correction, as momentum indicators show bearish momentum gaining traction.
Cardano (ADA) price trades at $0.25 as of Monday, after falling nearly 9% in the previous week. The ongoing geopolitical conflicts dampen the broader risk sentiment. On-chain and derivatives data support a negative outlook as Open Interest (OI) and daily active addresses are dropping, indicating waning investor participation. On the technical side, momentum indicators signal a bearish trend, suggesting a deeper correction ahead.
Waning investor participation
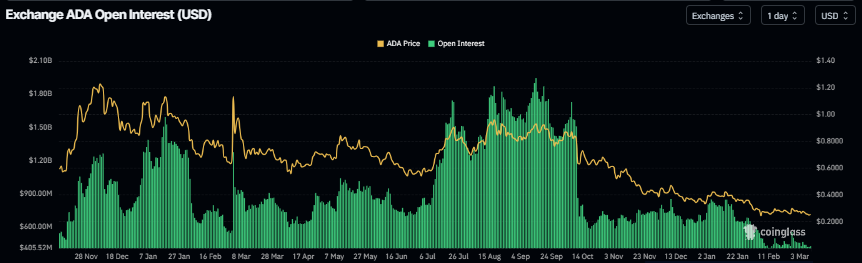
Cardano’s futures Open Interest (OI) dropped to $425.85 million on Monday and has been continuously falling since mid-January. This drop in OI reflects waning investor participation and projects a bearish outlook.
Santiment’s Daily Active Addresses index, which tracks network activity over time, also paints a bearish picture for Cardano. A rise in the metric signals greater blockchain usage, while declining addresses point to lower demand for the network.
In ADA’s case, Daily Active Addresses have been steadily declining since the end of January and currently stand at 13.5K as of Monday. This fall indicates that demand for ADA’s blockchain is decreasing, which doesn’t bode well for Cardano’s price.
 [09-1773030509548-1773030509550.06.16, 09 Mar, 2026].png)
Cardano Price Forecast: ADA momentum indicators show bearish bias
Cardano price trades at $0.25 as of Monday. Price holds below the long-term 50-day and 100-day Exponential Moving Averages (EMAs), keeping the broader backdrop bearish, while the descending trendline from $0.72 continues to cap the upside despite a recent test near the $0.27 breakout area.
The Relative Strength Index (RSI) on the daily chart at 41 shows weak momentum, consistent with a market drifting within the lower part of its recent range rather than starting a sustained recovery. The Moving Average Convergence Divergence (MACD) has slipped back toward the zero line with the MACD line hovering around the signal line, reinforcing a muted, mildly bearish near-term bias as rallies struggle to extend.
Immediate resistance emerges around $0.27–$0.28, close to the trendline break price at $0.27, and a daily close above this zone would be needed to open the way toward the horizontal barrier near $0.32.
On the downside, initial support is seen at the recent lows around $0.25, with stronger structural support at $0.24, where a break would expose a deeper pullback within the prevailing downtrend. As long as price trades beneath $0.27 and the declining moving averages, bears retain the technical advantage, while any bounce into resistance is likely to face selling pressure.
(The technical analysis of this story was written with the help of an AI tool.)

Acuity Trading은 2013년에 설립된 런던 기반 핀테크로, AI 기반 대체 데이터와 심리 분석을 통해 트레이딩과 투자를 지원합니다. 시각화된 뉴스와 심리 도구로 온라인 트레이딩 경험을 혁신했으며, 최신 AI 연구와 기술로 알파를 창출하는 대체 데이터와 높은 몰입도의 트레이딩 도구를 제공하며 시장을 선도하고 있습니다.
더 읽기


