
Trade The World
Dogecoin Price Forecast: DOGE bulls aiming for $0.30 mark
작성자 Manish Chhetri
게시일: 7 Oct 2025 | 수정일: 7 Oct 2025


POPULAR ARTICLES

Dogecoin (DOGE) trades in green on Tuesday after rallying more than 5% the previous day. On-chain metrics indicate a growing accumulation by holders, while the technical outlook suggests further gains, with the $0.30 mark emerging as the next key target.
- Dogecoin price trades in the green on Tuesday after rallying more than 5% the previous day.
- On-chain data show that holders are accumulating DOGE tokens.
- The technical outlook suggests a continuation of the rally, targeting the $0.30 mark.
Dogecoin (DOGE) trades in green on Tuesday after rallying more than 5% the previous day. On-chain metrics indicate a growing accumulation by holders, while the technical outlook suggests further gains, with the $0.30 mark emerging as the next key target.
Dogecoin holders buy the dips
Santiment’s Supply Distribution data supports a bullish outlook for Dogecoin. The metric indicates that whales holding between 100,000 and 1 million (red line), and between 10 million and 100 million (blue line), have accumulated 390 million tokens since September 23. During the same period, wallets holding between 1 million and 10 million DOGE tokens (yellow line) have shed 10 million tokens.
This shows that the second cohort of whales could have fallen prey to the capitulation event. In contrast, the first set of wallets seized the opportunity and accumulated DOGE at a discount.
 [08-1759813708931-1759813708933.26.51, 07 Oct, 2025].png)
Dogecoin supply distribution chart. Source: Santiment
Dogecoin Price Forecast: DOGE bulls aiming for $0.30 mark
Dogecoin price found support around the 50% Fibonacci retracement level at $0.22 on September 26 and rallied nearly 20% until Monday, closing above the daily resistance at $0.25. At the time of writing on Tuesday, it trades around $0.26.
If DOGE continues its upward momentum, it could extend the rally toward the key psychological level at $0.30.
The Relative Strength Index (RSI) on the daily chart reads 59, which is above the neutral level of 50, indicating that bullish momentum is gaining traction. Moreover, the Moving Average Convergence Divergence (MACD) also showed a bullish crossover last week. Additionally, the rising green histogram bars above the neutral level further indicate a bullish momentum and continuation of an upward trend.
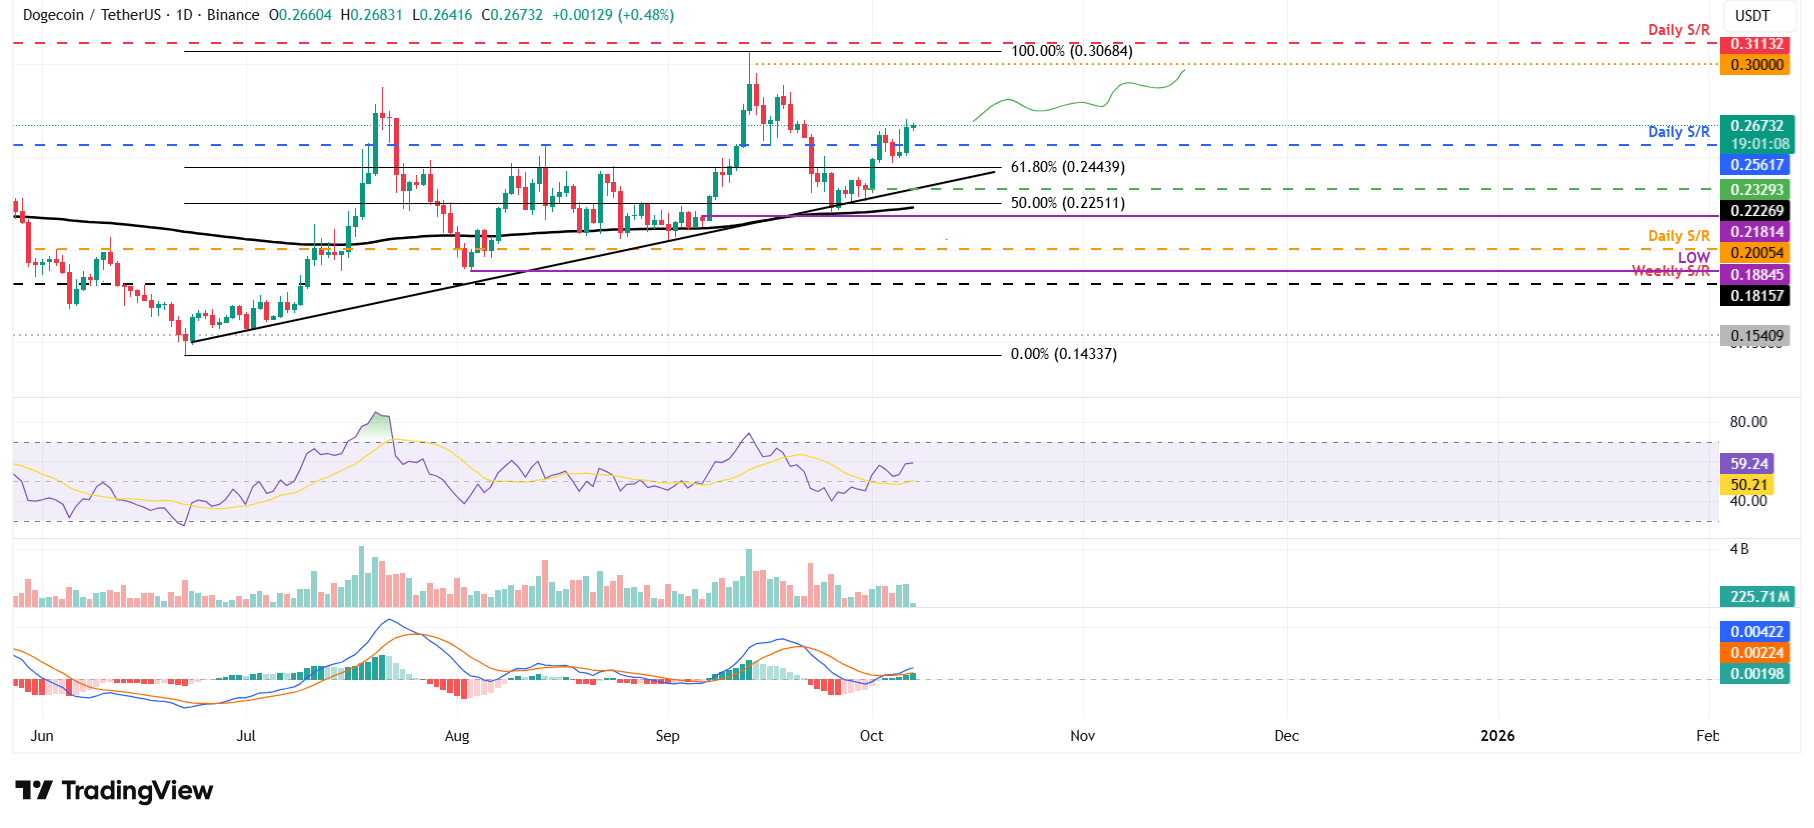
DOGE/USDT daily chart
However, if DOGE faces a correction, it could extend the decline toward the daily support at $0.25.

Acuity Trading
Acuity Trading은 2013년에 설립된 런던 기반 핀테크로, AI 기반 대체 데이터와 심리 분석을 통해 트레이딩과 투자를 지원합니다. 시각화된 뉴스와 심리 도구로 온라인 트레이딩 경험을 혁신했으며, 최신 AI 연구와 기술로 알파를 창출하는 대체 데이터와 높은 몰입도의 트레이딩 도구를 제공하며 시장을 선도하고 있습니다.
Read More


