
EUR/JPY Price Forecast: Eyes 184.00 barrier after breaking above moving averages
작성자 Akhtar Faruqui
게시일: 25 Feb 2026 | 수정일: 25 Feb 2026


인기 기사

EUR/JPY gains ground for the second successive session, trading around 183.70 during the Asian hours on Wednesday.
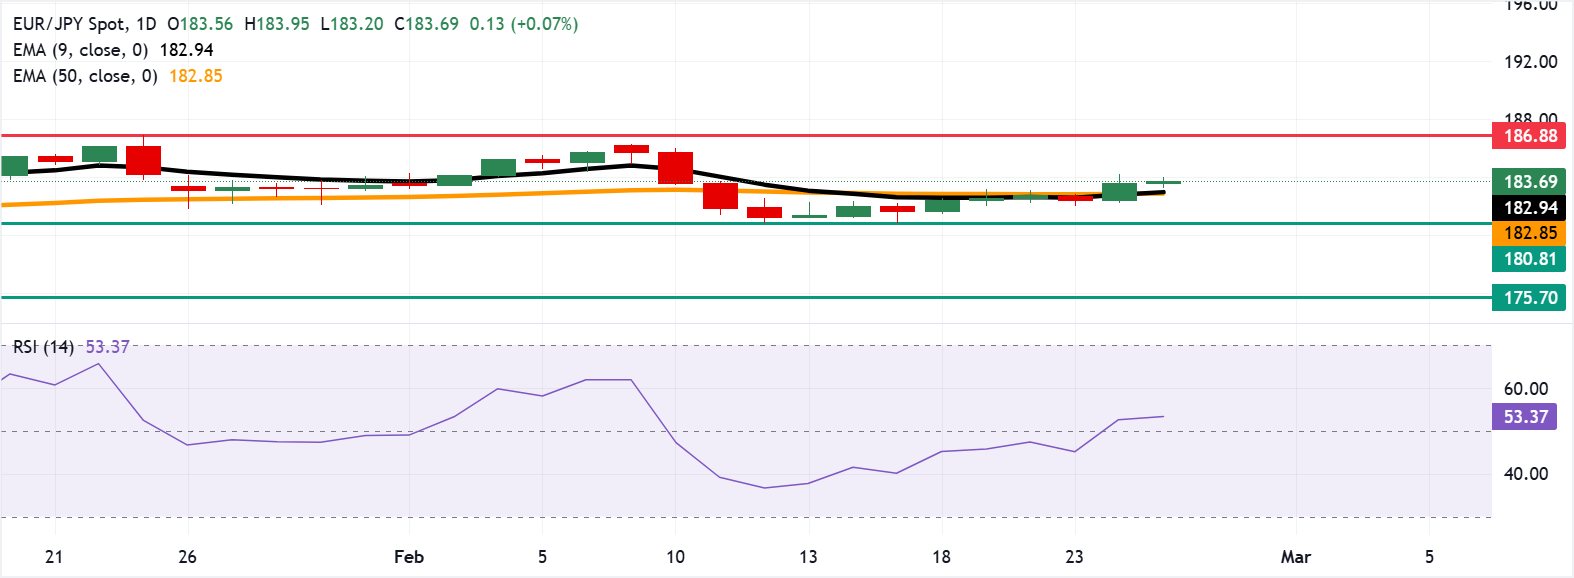
- EUR/JPY eyes initial resistance at the 184.00 psychological level.
- The 14-day Relative Strength Index at 54 signals modest bullish momentum.
- Immediate support stands at the nine-day EMA near 182.94.
EUR/JPY gains ground for the second successive session, trading around 183.70 during the Asian hours on Wednesday. The technical analysis of the daily chart shows the 14-day Relative Strength Index (RSI) at 54 stays above its midline and turns higher, indicating modest bullish pressure while leaving room for further gains if buyers regain control.
The EUR/JPY cross holds a neutral-to-bullish tone as price consolidates above the 50-day Exponential Moving Average (EMA), keeping the broader uptrend structure intact despite recent pullbacks from the 186.00 region. The nine-day EMA has flattened just below spot, reflecting loss of immediate upside momentum rather than a clear bearish reversal.
On the upside, initial resistance lies at the psychological level of 184.00. Further advances would support the EUR/JPY cross to approach the all-time high of 186.88, reached on January 23.
Immediate support emerges at the nine-day EMA at 182.94, which protects the sequence of higher daily lows and aligns with the underlying 50-day EMA at 182.85 backdrop. Further declines below the averages would weaken the momentum and expose a two-month low at 180.81, recorded on February 12, with deeper support seen at a four-month low at 175.70.
(The technical analysis of this story was written with the help of an AI tool.)
Euro Price Today
The table below shows the percentage change of Euro (EUR) against listed major currencies today. Euro was the strongest against the US Dollar.
| USD | EUR | GBP | JPY | CAD | AUD | NZD | CHF | |
|---|---|---|---|---|---|---|---|---|
| USD | -0.19% | -0.17% | -0.09% | -0.17% | -0.68% | -0.26% | -0.18% | |
| EUR | 0.19% | 0.02% | 0.09% | 0.02% | -0.49% | -0.07% | 0.00% | |
| GBP | 0.17% | -0.02% | 0.08% | -0.01% | -0.51% | -0.10% | -0.01% | |
| JPY | 0.09% | -0.09% | -0.08% | -0.06% | -0.58% | -0.17% | -0.08% | |
| CAD | 0.17% | -0.02% | 0.00% | 0.06% | -0.51% | -0.10% | -0.01% | |
| AUD | 0.68% | 0.49% | 0.51% | 0.58% | 0.51% | 0.42% | 0.50% | |
| NZD | 0.26% | 0.07% | 0.10% | 0.17% | 0.10% | -0.42% | 0.08% | |
| CHF | 0.18% | -0.01% | 0.01% | 0.08% | 0.01% | -0.50% | -0.08% |
The heat map shows percentage changes of major currencies against each other. The base currency is picked from the left column, while the quote currency is picked from the top row. For example, if you pick the Euro from the left column and move along the horizontal line to the US Dollar, the percentage change displayed in the box will represent EUR (base)/USD (quote).

Acuity Trading은 2013년에 설립된 런던 기반 핀테크로, AI 기반 대체 데이터와 심리 분석을 통해 트레이딩과 투자를 지원합니다. 시각화된 뉴스와 심리 도구로 온라인 트레이딩 경험을 혁신했으며, 최신 AI 연구와 기술로 알파를 창출하는 대체 데이터와 높은 몰입도의 트레이딩 도구를 제공하며 시장을 선도하고 있습니다.
더 읽기


