
Trade The World
EUR/JPY price forecast: Hovers around 172.50, eyes nine-day EMA support
작성자 Akhtar Faruqui
게시일: 13 Aug 2025 | 수정일: 13 Aug 2025


POPULAR ARTICLES

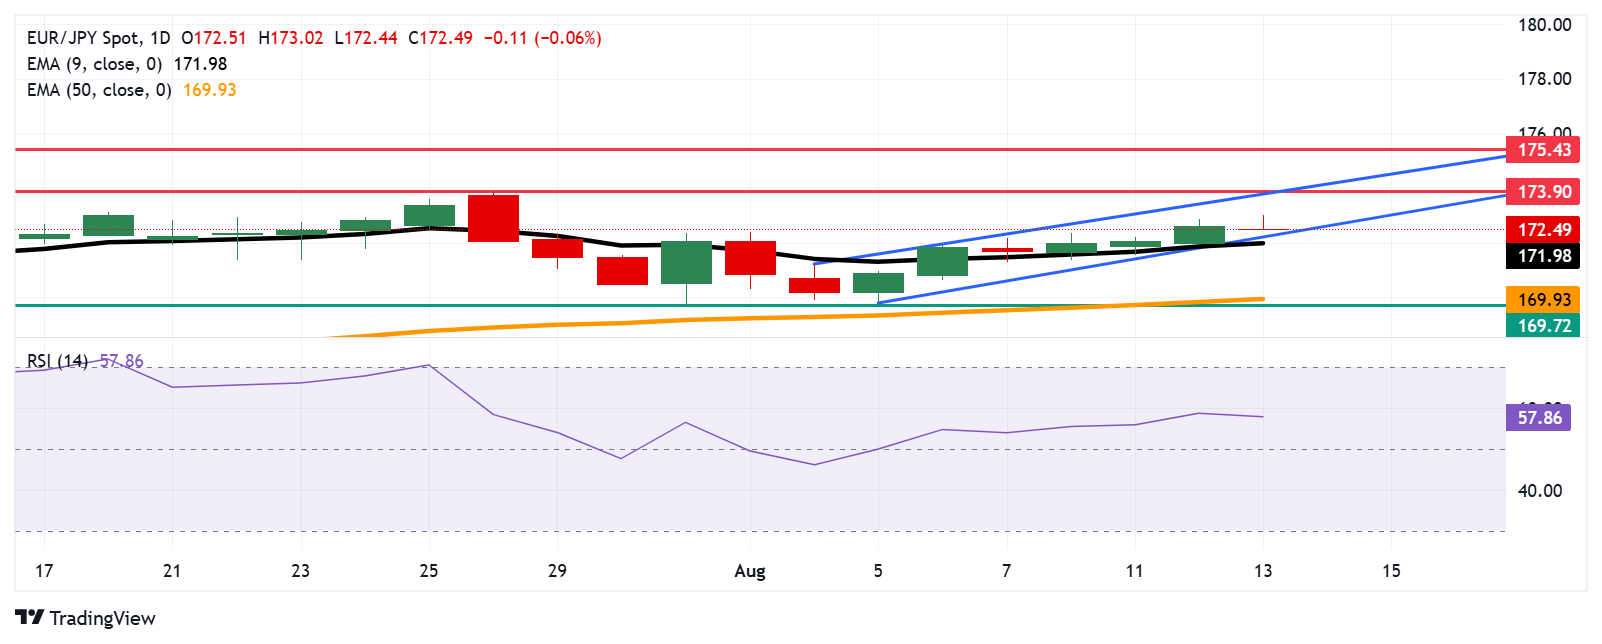
EUR/JPY halts its three-day winning streak, trading around 172.50 during the European hours on Wednesday. The technical analysis of the daily chart suggests an ongoing bullish bias as the currency cross is moving upwards within the ascending channel pattern.
- EUR/JPY may find the primary barrier at the ascending channel’s upper boundary around 173.80.
- Bullish bias strengthens as the 14-day RSI is positioned above 50.
- The immediate support appears at the crucial level of 172.50.
EUR/JPY halts its three-day winning streak, trading around 172.50 during the European hours on Wednesday. The technical analysis of the daily chart suggests an ongoing bullish bias as the currency cross is moving upwards within the ascending channel pattern.
Additionally, the 14-day Relative Strength Index (RSI) is positioned above the 50 mark, strengthening the bullish outlook. The short-term price momentum is stronger as the EUR/JPY cross remains above the nine-day Exponential Moving Average (EMA).
On the upside, the EUR/JPY cross could target the upper boundary of the ascending channel around 173.80, followed by 173.90, the highest since July 2024, recorded on July 28, 2025. A successful breach above this crucial resistance zone could reinforce the bullish bias and support the pair to approach a record high at 175.43, reached in July 2024.
A successful break below the psychological level of 172.50 would prompt the currency cross to target the ascending channel’s lower boundary around 172.30, followed by the nine-day EMA at 171.98. Further declines below this crucial support zone could weaken the short-term price momentum and put downward pressure on the EUR/JPY cross to explore the region around the 50-day EMA at 169.93, followed by the six-week low at 169.72, which was recorded on July 31.
EUR/JPY: Daily Chart
Euro PRICE Today
The table below shows the percentage change of Euro (EUR) against listed major currencies today. Euro was the weakest against the New Zealand Dollar.
| USD | EUR | GBP | JPY | CAD | AUD | NZD | CHF | |
|---|---|---|---|---|---|---|---|---|
| USD | -0.36% | -0.47% | -0.38% | -0.08% | -0.37% | -0.54% | -0.46% | |
| EUR | 0.36% | -0.05% | -0.05% | 0.27% | -0.01% | -0.18% | -0.11% | |
| GBP | 0.47% | 0.05% | 0.06% | 0.32% | 0.04% | -0.04% | -0.03% | |
| JPY | 0.38% | 0.05% | -0.06% | 0.31% | -0.00% | -0.15% | -0.09% | |
| CAD | 0.08% | -0.27% | -0.32% | -0.31% | -0.31% | -0.42% | -0.35% | |
| AUD | 0.37% | 0.00% | -0.04% | 0.00% | 0.31% | -0.18% | -0.09% | |
| NZD | 0.54% | 0.18% | 0.04% | 0.15% | 0.42% | 0.18% | 0.10% | |
| CHF | 0.46% | 0.11% | 0.03% | 0.09% | 0.35% | 0.09% | -0.10% |
The heat map shows percentage changes of major currencies against each other. The base currency is picked from the left column, while the quote currency is picked from the top row. For example, if you pick the Euro from the left column and move along the horizontal line to the US Dollar, the percentage change displayed in the box will represent EUR (base)/USD (quote).

Acuity Trading
Acuity Trading은 2013년에 설립된 런던 기반 핀테크로, AI 기반 대체 데이터와 심리 분석을 통해 트레이딩과 투자를 지원합니다. 시각화된 뉴스와 심리 도구로 온라인 트레이딩 경험을 혁신했으며, 최신 AI 연구와 기술로 알파를 창출하는 대체 데이터와 높은 몰입도의 트레이딩 도구를 제공하며 시장을 선도하고 있습니다.
Read More


