
EUR/USD Price Forecast: Tests nine-day support near 1.1700
작성자 Akhtar Faruqui
게시일: 19 Dec 2025 | 수정일: 19 Dec 2025


인기 기사

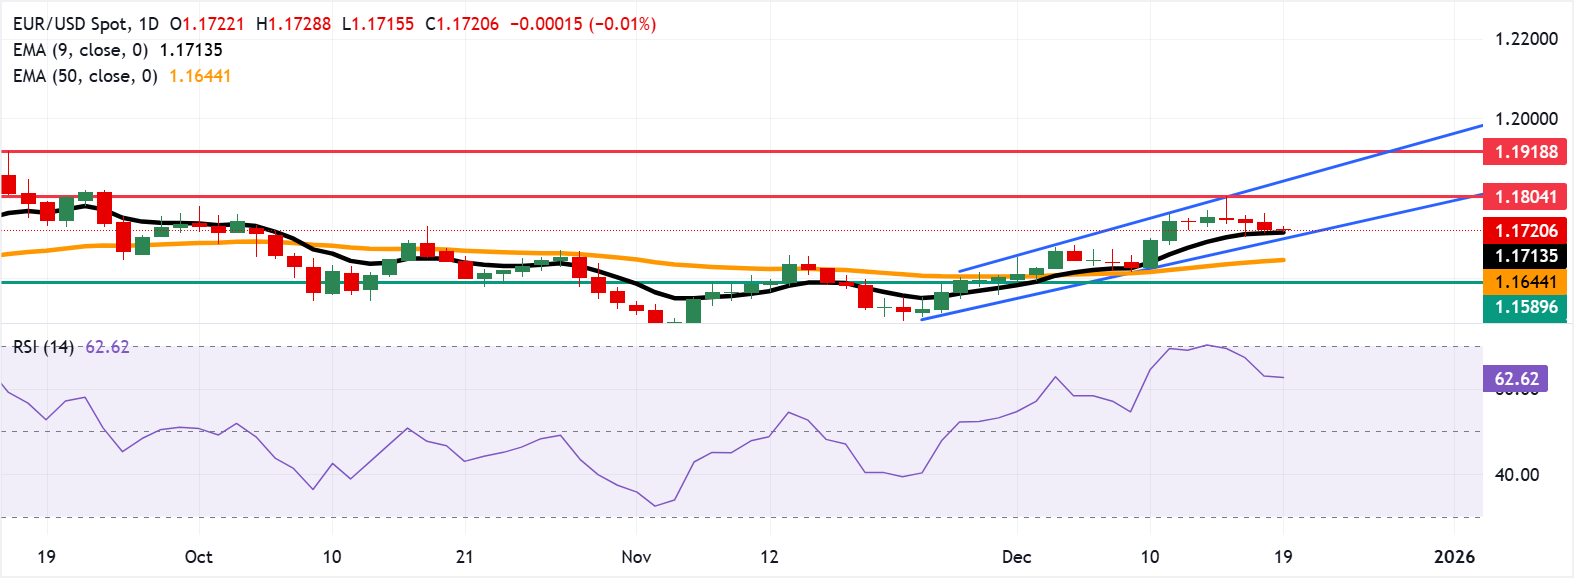
EUR/USD remains weaker for the fourth consecutive session, trading around 1.1720 during the Asian hours on Friday. On the daily chart, technical analysis indicates a prevailing bullish bias, as the pair remains within the ascending channel pattern.
- EUR/USD may rise toward a two-month high of 1.1804 amid prevailing bullish bias.
- The 14-day Relative Strength Index at 62.11 signals strong bullish momentum without overbought conditions.
- The pair tests immediate support at the nine-day EMA of 1.1713.
EUR/USD remains weaker for the fourth consecutive session, trading around 1.1720 during the Asian hours on Friday. On the daily chart, technical analysis indicates a prevailing bullish bias, as the pair remains within the ascending channel pattern. Additionally, the 14-day Relative Strength Index (RSI) stands at 62.11, signaling firm positive momentum without overbought pressure.
The EUR/USD pair holds above the ascending nine- and 50-day Exponential Moving Averages (EMAs), maintaining a bullish bias. Upside prospects stay intact as long as price holds above the EMAs. The short-term average remains above the medium-term gauge, underscoring trend strength.
The EUR/USD pair may rebound toward the two-month high of 1.1804, reached on December 16. A daily close above the primary barrier could extend gains toward the upper boundary of the ascending channel around 1.1850. A break above the channel would support the pair to explore the region around 1.1918, the highest since June 2021.
Further declines could be contained toward the nine-day EMA at 1.1713, followed by the lower ascending channel boundary around 1.1700. A break below this support area would weaken the short-term price momentum and put downward pressure on the EUR/USD pair to test the 50-day EMA at 1.1644, followed by the three-week low of 1.1589, which was recorded on December 1.
Euro Price Today
The table below shows the percentage change of Euro (EUR) against listed major currencies today. Euro was the weakest against the US Dollar.
| USD | EUR | GBP | JPY | CAD | AUD | NZD | CHF | |
|---|---|---|---|---|---|---|---|---|
| USD | 0.01% | 0.00% | 0.25% | 0.06% | 0.06% | 0.18% | 0.12% | |
| EUR | -0.01% | 0.00% | 0.26% | 0.05% | 0.05% | 0.18% | 0.10% | |
| GBP | -0.01% | -0.00% | 0.25% | 0.05% | 0.05% | 0.18% | 0.10% | |
| JPY | -0.25% | -0.26% | -0.25% | -0.18% | -0.19% | -0.07% | -0.14% | |
| CAD | -0.06% | -0.05% | -0.05% | 0.18% | -0.01% | 0.11% | 0.05% | |
| AUD | -0.06% | -0.05% | -0.05% | 0.19% | 0.00% | 0.13% | 0.05% | |
| NZD | -0.18% | -0.18% | -0.18% | 0.07% | -0.11% | -0.13% | -0.08% | |
| CHF | -0.12% | -0.10% | -0.10% | 0.14% | -0.05% | -0.05% | 0.08% |
The heat map shows percentage changes of major currencies against each other. The base currency is picked from the left column, while the quote currency is picked from the top row. For example, if you pick the Euro from the left column and move along the horizontal line to the US Dollar, the percentage change displayed in the box will represent EUR (base)/USD (quote).
(The technical analysis of this story was written with the help of an AI tool.)

Acuity Trading은 2013년에 설립된 런던 기반 핀테크로, AI 기반 대체 데이터와 심리 분석을 통해 트레이딩과 투자를 지원합니다. 시각화된 뉴스와 심리 도구로 온라인 트레이딩 경험을 혁신했으며, 최신 AI 연구와 기술로 알파를 창출하는 대체 데이터와 높은 몰입도의 트레이딩 도구를 제공하며 시장을 선도하고 있습니다.
더 읽기


