
Trade The World
GBP/USD Price Forecast: Falls toward 1.3400 near 50-day EMA
작성자 Akhtar Faruqui
게시일: 5 Jan 2026 | 수정일: 5 Jan 2026


POPULAR ARTICLES

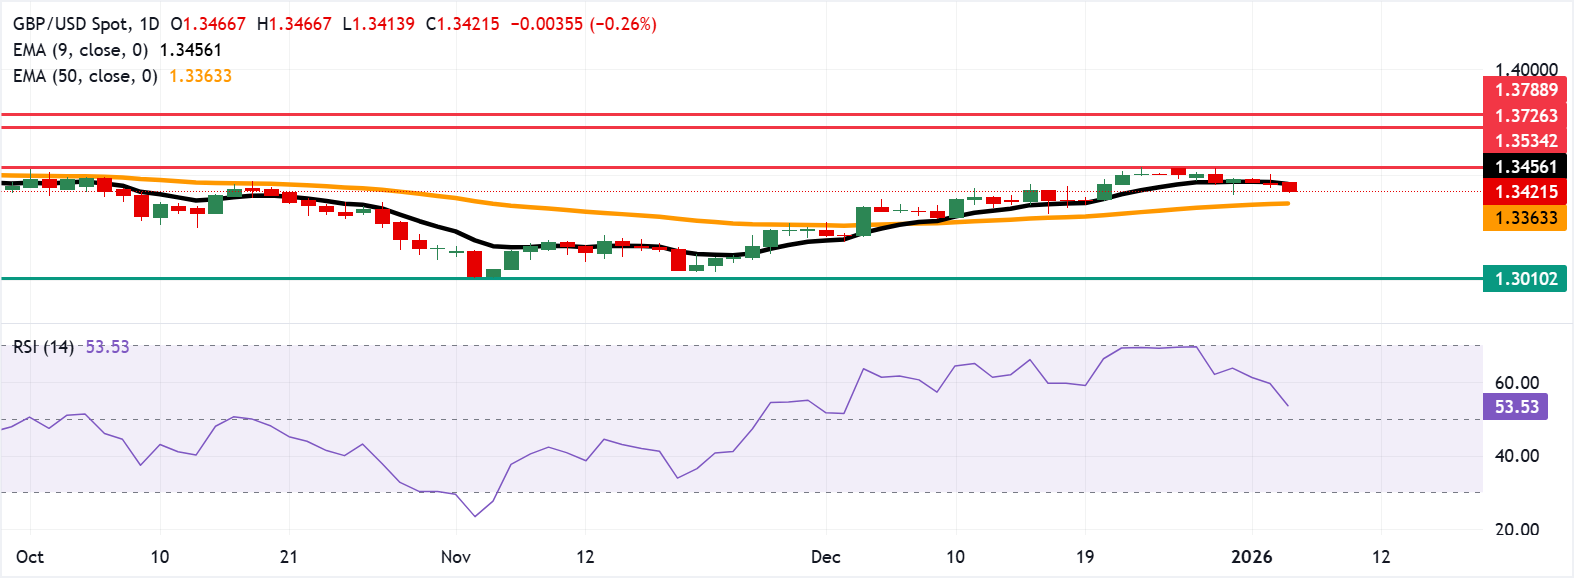
GBP/USD extends its losses for the second successive session, trading around 1.3420 during the Asian hours on Monday.
- GBP/USD may find the primary barrier at the nine-day EMA of 1.3455.
- The 14-day Relative Strength Index at 53 has eased from near-overbought, signaling cooling momentum.
- The initial support lies at the psychological level of 1.3400.
GBP/USD extends its losses for the second successive session, trading around 1.3420 during the Asian hours on Monday. The technical analysis of the daily chart indicates that the 14-day Relative Strength Index (RSI) at 53 (neutral) has eased from near overbought, indicating that momentum has cooled while remaining above the midline. RSI holds above 50, keeping a modest bullish bias.
The nine-day Exponential Moving Average (EMA) stands above the 50-day EMA, preserving a bullish bias as price consolidates below the short-term average but holds over the medium-term line. This suggests a shallow pullback within the prevailing uptrend. The short-term trend pauses as the nine-day EMA flattens, while the rising 50-day EMA underpins the broader advance.
The immediate barrier lies at the nine-day EMA of 1.3455. A daily close back above the short-term average would reassert upside control and lead the GBP/USD pair to test the three-month high of 1.3534, reached on December 24. Further gains could open a move toward the six-month high of 1.3726, followed by the 1.3788, the highest level since October 2021.
On the downside, the GBP/USD pair falls toward the psychological level of 1.3400, followed by the 50-day EMA at 1.3363. A break below the medium-term price momentum and put downward pressure on the pair to navigate the region around the eight-month low of 1.3010.
Pound Sterling Price Today
The table below shows the percentage change of British Pound (GBP) against listed major currencies today. British Pound was the weakest against the US Dollar.
| USD | EUR | GBP | JPY | CAD | AUD | NZD | CHF | |
|---|---|---|---|---|---|---|---|---|
| USD | 0.34% | 0.26% | 0.22% | 0.29% | 0.39% | 0.40% | 0.24% | |
| EUR | -0.34% | -0.09% | -0.09% | -0.04% | 0.05% | 0.05% | -0.10% | |
| GBP | -0.26% | 0.09% | -0.02% | 0.04% | 0.14% | 0.13% | -0.02% | |
| JPY | -0.22% | 0.09% | 0.02% | 0.07% | 0.16% | 0.15% | 0.00% | |
| CAD | -0.29% | 0.04% | -0.04% | -0.07% | 0.09% | 0.09% | -0.06% | |
| AUD | -0.39% | -0.05% | -0.14% | -0.16% | -0.09% | -0.00% | -0.15% | |
| NZD | -0.40% | -0.05% | -0.13% | -0.15% | -0.09% | 0.00% | -0.15% | |
| CHF | -0.24% | 0.10% | 0.02% | -0.01% | 0.06% | 0.15% | 0.15% |
The heat map shows percentage changes of major currencies against each other. The base currency is picked from the left column, while the quote currency is picked from the top row. For example, if you pick the British Pound from the left column and move along the horizontal line to the US Dollar, the percentage change displayed in the box will represent GBP (base)/USD (quote).
(The technical analysis of this story was written with the help of an AI tool.)

Acuity Trading
Acuity Trading은 2013년에 설립된 런던 기반 핀테크로, AI 기반 대체 데이터와 심리 분석을 통해 트레이딩과 투자를 지원합니다. 시각화된 뉴스와 심리 도구로 온라인 트레이딩 경험을 혁신했으며, 최신 AI 연구와 기술로 알파를 창출하는 대체 데이터와 높은 몰입도의 트레이딩 도구를 제공하며 시장을 선도하고 있습니다.
Read More


