
GBP/USD Price Forecast: Hovers around 1.3400 with bearish pressure intact
작성자 Akhtar Faruqui
게시일: 3 Mar 2026 | 수정일: 3 Mar 2026


인기 기사

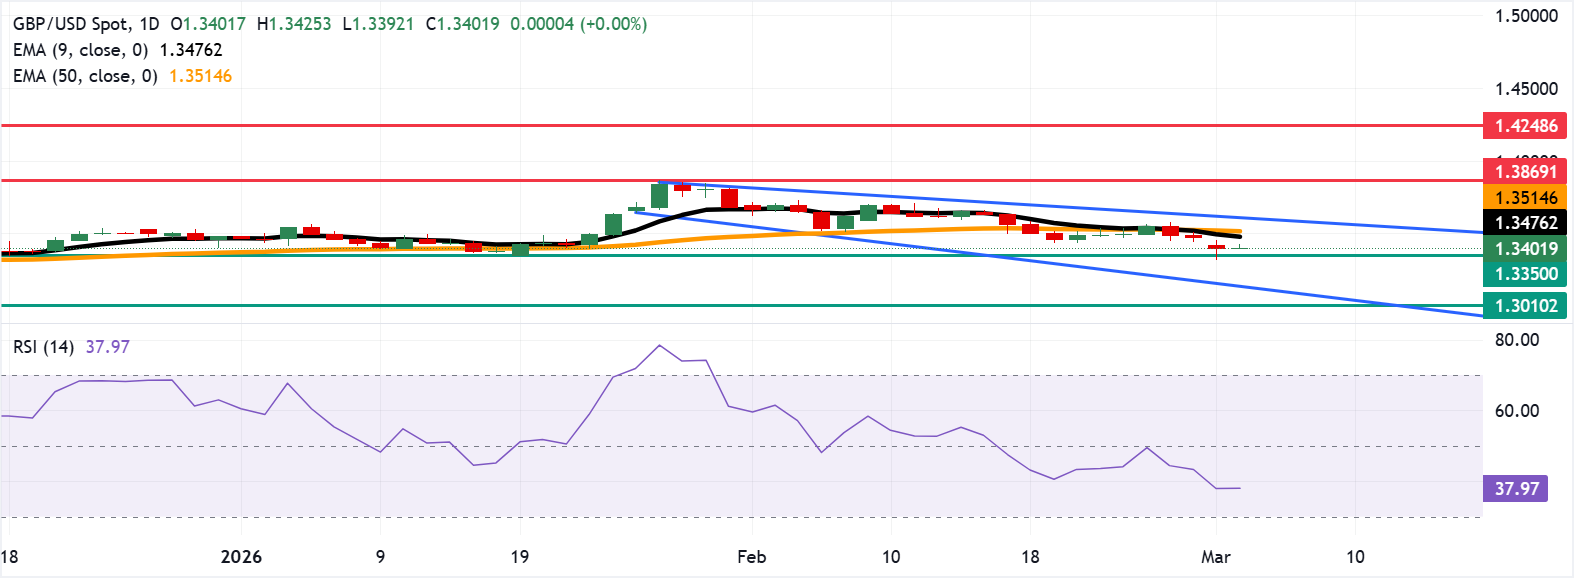
GBP/USD edges higher after three days of losses, trading around 1.3400 during the Asian hours on Tuesday. The technical analysis of the daily chart indicates an ongoing bearish bias, as the pair trades within a descending channel pattern.
- GBP/USD may find primary support near the 1.3350 reversal zone.
- The 14-day Relative Strength Index at 39 signals sustained bearish pressure.
- The primary barrier lies at the nine-day EMA at 1.3476.
GBP/USD edges higher after three days of losses, trading around 1.3400 during the Asian hours on Tuesday. The technical analysis of the daily chart indicates an ongoing bearish bias, as the pair trades within a descending channel pattern.
The 14-day Relative Strength Index (RSI), a momentum indicator, has slipped toward 39, showing fading bullish momentum after the earlier overbought reading and reinforcing the idea of corrective pressure within a broader range rather than a clear trend reversal.
The near-term bias is neutral with a slight bearish tilt as spot holds just above the 50-day Exponential Moving Average (EMA) while trading below the falling nine-day average, which caps recovery attempts.
The immediate support lies at the reversal zone around 1.3350. The proximity to the 50-day EMA may attract dip buyers toward the descending channel around 1.3170, followed by the 10-month low at 1.3010.
On the upside, the primary barrier is seen at the nine-day EMA at 1.3476, followed by the 50-day EMA at 1.3514. Further advances above these averages would improve the momentum and expose the upper descending channel boundary around 1.3630. A break above the channel would support the bullish bias and support the GBP/USD pair to test the 1.3869, the highest since September 2021, reached on January 27.
(The technical analysis of this story was written with the help of an AI tool.)
Pound Sterling Price Today
The table below shows the percentage change of British Pound (GBP) against listed major currencies today. British Pound was the strongest against the Swiss Franc.
| USD | EUR | GBP | JPY | CAD | AUD | NZD | CHF | |
|---|---|---|---|---|---|---|---|---|
| USD | -0.02% | -0.02% | -0.03% | -0.06% | -0.27% | -0.04% | 0.05% | |
| EUR | 0.02% | -0.00% | 0.00% | -0.04% | -0.25% | -0.03% | 0.07% | |
| GBP | 0.02% | 0.00% | 0.00% | -0.04% | -0.25% | -0.03% | 0.07% | |
| JPY | 0.03% | 0.00% | 0.00% | -0.03% | -0.24% | -0.03% | 0.08% | |
| CAD | 0.06% | 0.04% | 0.04% | 0.03% | -0.21% | 0.00% | 0.11% | |
| AUD | 0.27% | 0.25% | 0.25% | 0.24% | 0.21% | 0.22% | 0.32% | |
| NZD | 0.04% | 0.03% | 0.03% | 0.03% | -0.01% | -0.22% | 0.10% | |
| CHF | -0.05% | -0.07% | -0.07% | -0.08% | -0.11% | -0.32% | -0.10% |
The heat map shows percentage changes of major currencies against each other. The base currency is picked from the left column, while the quote currency is picked from the top row. For example, if you pick the British Pound from the left column and move along the horizontal line to the US Dollar, the percentage change displayed in the box will represent GBP (base)/USD (quote).

Acuity Trading은 2013년에 설립된 런던 기반 핀테크로, AI 기반 대체 데이터와 심리 분석을 통해 트레이딩과 투자를 지원합니다. 시각화된 뉴스와 심리 도구로 온라인 트레이딩 경험을 혁신했으며, 최신 AI 연구와 기술로 알파를 창출하는 대체 데이터와 높은 몰입도의 트레이딩 도구를 제공하며 시장을 선도하고 있습니다.
더 읽기


