
Trade The World
GBP/USD Price Forecast: Remains below 1.3450, nine-day EMA
작성자 Akhtar Faruqui
게시일: 9 Jan 2026 | 수정일: 9 Jan 2026


POPULAR ARTICLES

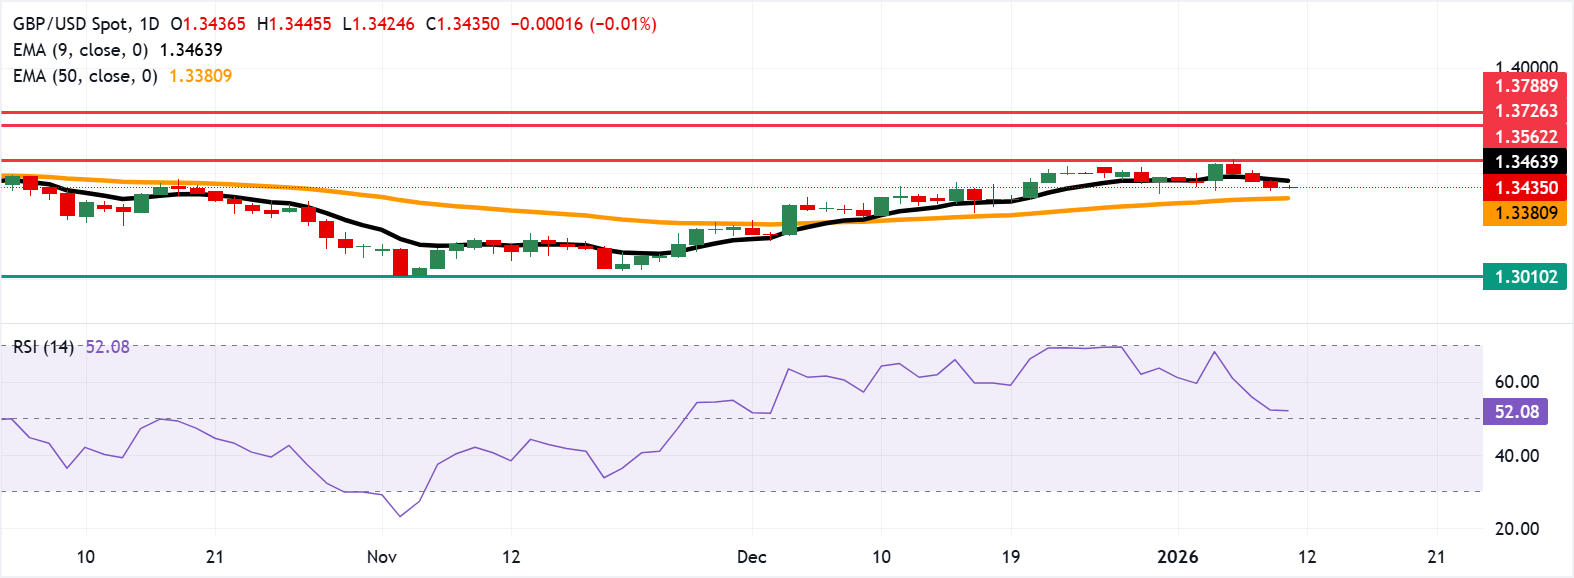
GBP/USD remains subdued for the fourth consecutive day, trading around 1.3430 during the Asian hours on Friday. The momentum indicator 14-day Relative Strength Index (RSI) at 51.9 is neutral, reflecting slower momentum after firm recent readings.
- GBP/USD sits below the nine-day EMA but above the 50-day EMA, straddling short- and medium-term trends.
- The 14-day Relative Strength Index at 51.9 is neutral, indicating easing momentum after recent strength.
- Staying above the 50-day line would maintain the positive bias and provide support on pullbacks.
GBP/USD remains subdued for the fourth consecutive day, trading around 1.3430 during the Asian hours on Friday. The momentum indicator 14-day Relative Strength Index (RSI) at 51.9 is neutral, reflecting slower momentum after firm recent readings. An RSI drop back beneath 50 would strengthen the case for a deeper pullback.
The GBP/USD pair straddles the short-term and medium-term trend filters, sitting below the nine-day Exponential Moving Average (EMA) but above the 50-day EMA. The nine-day average remains above the 50-day EMA, yet its recent rollover caps upside traction.
The initial support lies at the 50-day EMA of at 1.3381. A daily close under the medium-term average would shift focus toward the eight-month low of 1.3010. Holding above the 50-day line would preserve the underlying positive tone and keep dips supported.
A break through the nine-day EMA at 1.3464 would expose the three-month high of 1.3562 as the next barrier. A daily close back over this confluence resistance zone could reassert the topside bias. Further advances would lead the GBP/USD pair to explore the region around the six-month high of 1.3726, followed by the 1.3788, the highest level since October 2021.
Pound Sterling Price Today
The table below shows the percentage change of British Pound (GBP) against listed major currencies today. British Pound was the weakest against the Euro.
| USD | EUR | GBP | JPY | CAD | AUD | NZD | CHF | |
|---|---|---|---|---|---|---|---|---|
| USD | -0.03% | 0.01% | 0.19% | 0.05% | -0.00% | 0.07% | 0.01% | |
| EUR | 0.03% | 0.05% | 0.22% | 0.08% | 0.03% | 0.10% | 0.05% | |
| GBP | -0.01% | -0.05% | 0.19% | 0.04% | -0.02% | 0.05% | -0.01% | |
| JPY | -0.19% | -0.22% | -0.19% | -0.13% | -0.19% | -0.12% | -0.18% | |
| CAD | -0.05% | -0.08% | -0.04% | 0.13% | -0.06% | 0.00% | -0.05% | |
| AUD | 0.00% | -0.03% | 0.02% | 0.19% | 0.06% | 0.07% | 0.01% | |
| NZD | -0.07% | -0.10% | -0.05% | 0.12% | -0.01% | -0.07% | -0.06% | |
| CHF | -0.01% | -0.05% | 0.00% | 0.18% | 0.05% | -0.01% | 0.06% |
The heat map shows percentage changes of major currencies against each other. The base currency is picked from the left column, while the quote currency is picked from the top row. For example, if you pick the British Pound from the left column and move along the horizontal line to the US Dollar, the percentage change displayed in the box will represent GBP (base)/USD (quote).
(The technical analysis of this story was written with the help of an AI tool.)

Acuity Trading
Acuity Trading은 2013년에 설립된 런던 기반 핀테크로, AI 기반 대체 데이터와 심리 분석을 통해 트레이딩과 투자를 지원합니다. 시각화된 뉴스와 심리 도구로 온라인 트레이딩 경험을 혁신했으며, 최신 AI 연구와 기술로 알파를 창출하는 대체 데이터와 높은 몰입도의 트레이딩 도구를 제공하며 시장을 선도하고 있습니다.
Read More


