
Litecoin Price Forecast: LTC extends correction as bears eye $45
작성자 Manish Chhetri
게시일: 24 Feb 2026 | 수정일: 24 Feb 2026


인기 기사

Litecoin (LTC) is extending its correction, trading below $50.50 at the time of writing on Tuesday, after losing 4% the previous day.
- Litecoin price extends its correction on Tuesday, after losing nearly 4% the previous day.
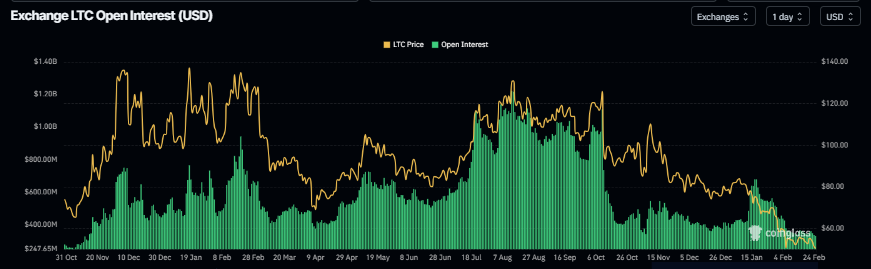
- Derivatives data support bearish sentiment, with Open Interest at very low levels and rising short bets.
- The technical outlook suggests sellers are in control, with $45 emerging as the next downside target.
Litecoin (LTC) is extending its correction, trading below $50.50 at the time of writing on Tuesday, after losing 4% the previous day. The bearish price action is further supported by derivatives data, as Open Interest (OI) has been falling steadily alongside rising short bets, while the technical outlook remains unfavorable.
Litecoin derivatives data shows bearish bias
Litecoin futures OI falls to $328.60 million on Tuesday, having been steadily declining since mid-January. This drop in OI reflects waning investor participation and projects a bearish outlook.
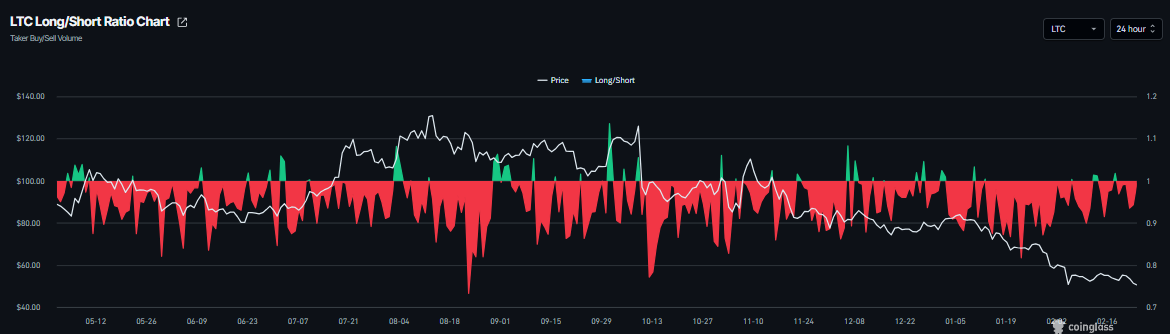
In addition, Litecoin's long-to-short ratio reads 0.94 on Tuesday and has failed to remain above 1 for the third time so far this month, signaling that traders are reluctant to add long positions. This ratio below 1 indicates bearish sentiment as traders are betting on the Litecoin price to fall.
Litecoin Price Forecast: LTC bears aim for the $45 mark
Litecoin price trades at $50.39 as of writing on Tuesday. The 50-day Exponential Moving Average (EMA) slopes lower at $62.36, maintaining a bearish bias as price holds beneath it. Rallies remain capped below this average, keeping recovery attempts fragile.
On the daily chart, the Moving Average Convergence Divergence (MACD) line is above the signal and near the zero line, while a positive but contracting histogram suggests fading bullish momentum.
The Relative Strength Index (RSI) at 32.26 stays below the midline, indicating persistent bearish pressure near oversold territory.
Measured from the $70.49 high to the $45.07 low, the 23.6% Fibonacci retracement at $51.06 acts as immediate resistance, while the 38.2% retracement at $54.78 caps the next rebound. Support is seen at $50.39, with resistance further up at $61.62.
A push above $51.06 would open room toward $54.78, whereas a daily close below $50.39 could extend the slide within the prevailing downtrend toward the February 6 low of $45.07.
-1771918622614-1771918622615.png)
(The technical analysis of this story was written with the help of an AI tool.)

Acuity Trading은 2013년에 설립된 런던 기반 핀테크로, AI 기반 대체 데이터와 심리 분석을 통해 트레이딩과 투자를 지원합니다. 시각화된 뉴스와 심리 도구로 온라인 트레이딩 경험을 혁신했으며, 최신 AI 연구와 기술로 알파를 창출하는 대체 데이터와 높은 몰입도의 트레이딩 도구를 제공하며 시장을 선도하고 있습니다.
더 읽기


