
Trade The World
Official Trump Price Forecast: TRUMP extends rally as whale activity and bullish momentum strengthen
작성자 Manish Chhetri
게시일: 6 Nov 2025 | 수정일: 6 Nov 2025


POPULAR ARTICLES

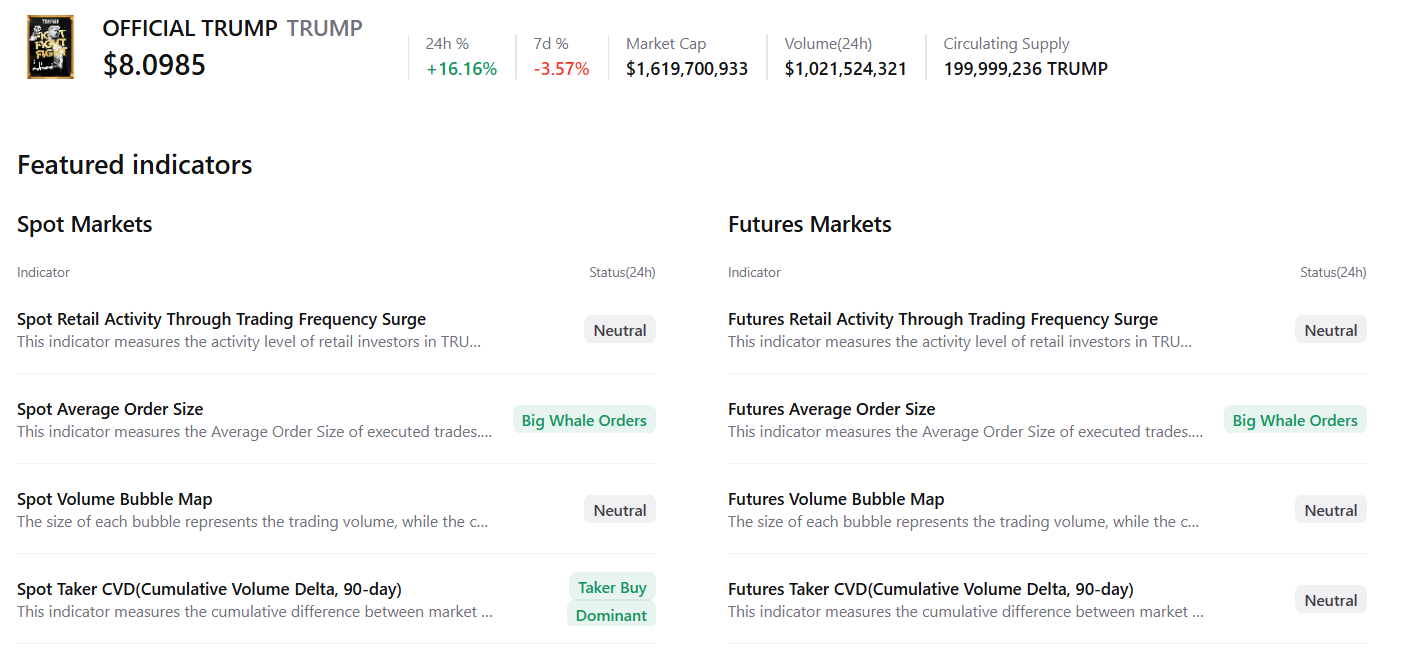
Official Trump (TRUMP) price continues its upward trajectory, trading above $8.32 at the time of writing on Thursday, building on a 16% rally from the previous day.
- Official Trump price extends its gains on Thursday after rallying more than 16% the previous day.
- On-chain and derivatives data suggest a bullish outlook with rising whale activity, improving buy dominance, and positive funding rates.
- Technical indicators show strengthening bullish momentum, signaling potential for continued upside.
Official Trump (TRUMP) price continues its upward trajectory, trading above $8.32 at the time of writing on Thursday, building on a 16% rally from the previous day. On-chain and derivatives data paint a bullish picture as whale accumulation, buy dominance, and positive funding rates strengthen investor confidence. Meanwhile, momentum indicators suggest that TRUMP’s bullish run could extend further in the upcoming days.
TRUMP’s on-chain and derivatives data show a bullish bias
CryptoQuant’s summary data supports the positive outlook, as TRUMP’s spot and futures markets show large whale orders and buy dominance, signaling a potential rally ahead.
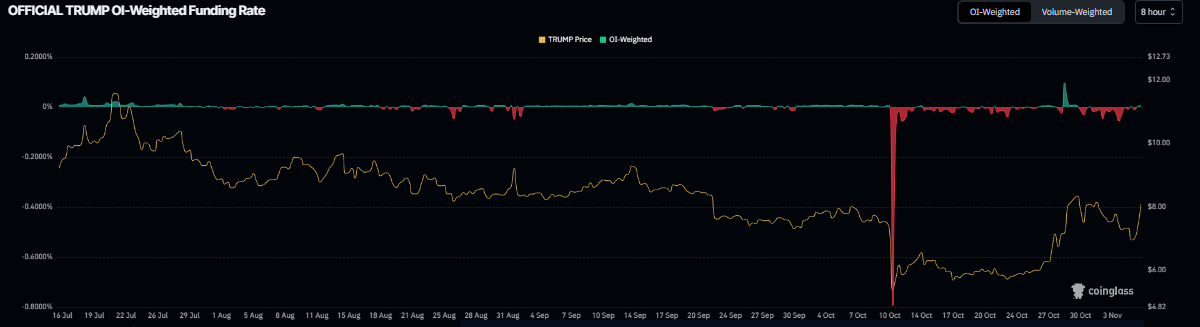
Derivatives data also support a bullish bias. Coinglass’s OI-Weighted Funding Rate data shows that the number of traders betting that the price of TRUMP memecoin will slide further is lower than those anticipating a price increase.
The metric has flipped to a positive rate, standing at 0.0053% on Thursday, indicating that longs are paying shorts. Historically, as shown in the chart below, when the funding rates have flipped from negative to positive, Official Trump’s price has rallied sharply.
Official Trump Price Forecast: TRUMP bulls aiming for $11.92 mark
Official Trump price found support around the 50-day Exponential Moving Average (EMA) at $7.30 on Tuesday and rose more than 16% on the next day. At the time of writing on Thursday, TRUMP is trading higher around $8.31, breaking above the descending trendline.
If TRUMP closes above the 61.8% Fibonacci retracement level at $7.95 on a daily basis, it could extend the rally toward the July 21 high of $11.92.
The Relative Strength Index (RSI) on the daily chart reads 61, above the neutral level of 50, indicating bullish momentum gaining traction. Additionally, the Moving Average Convergence Divergence (MACD) indicators showed a bullish crossover that remains intact, indicating the continuation of an upward trend.
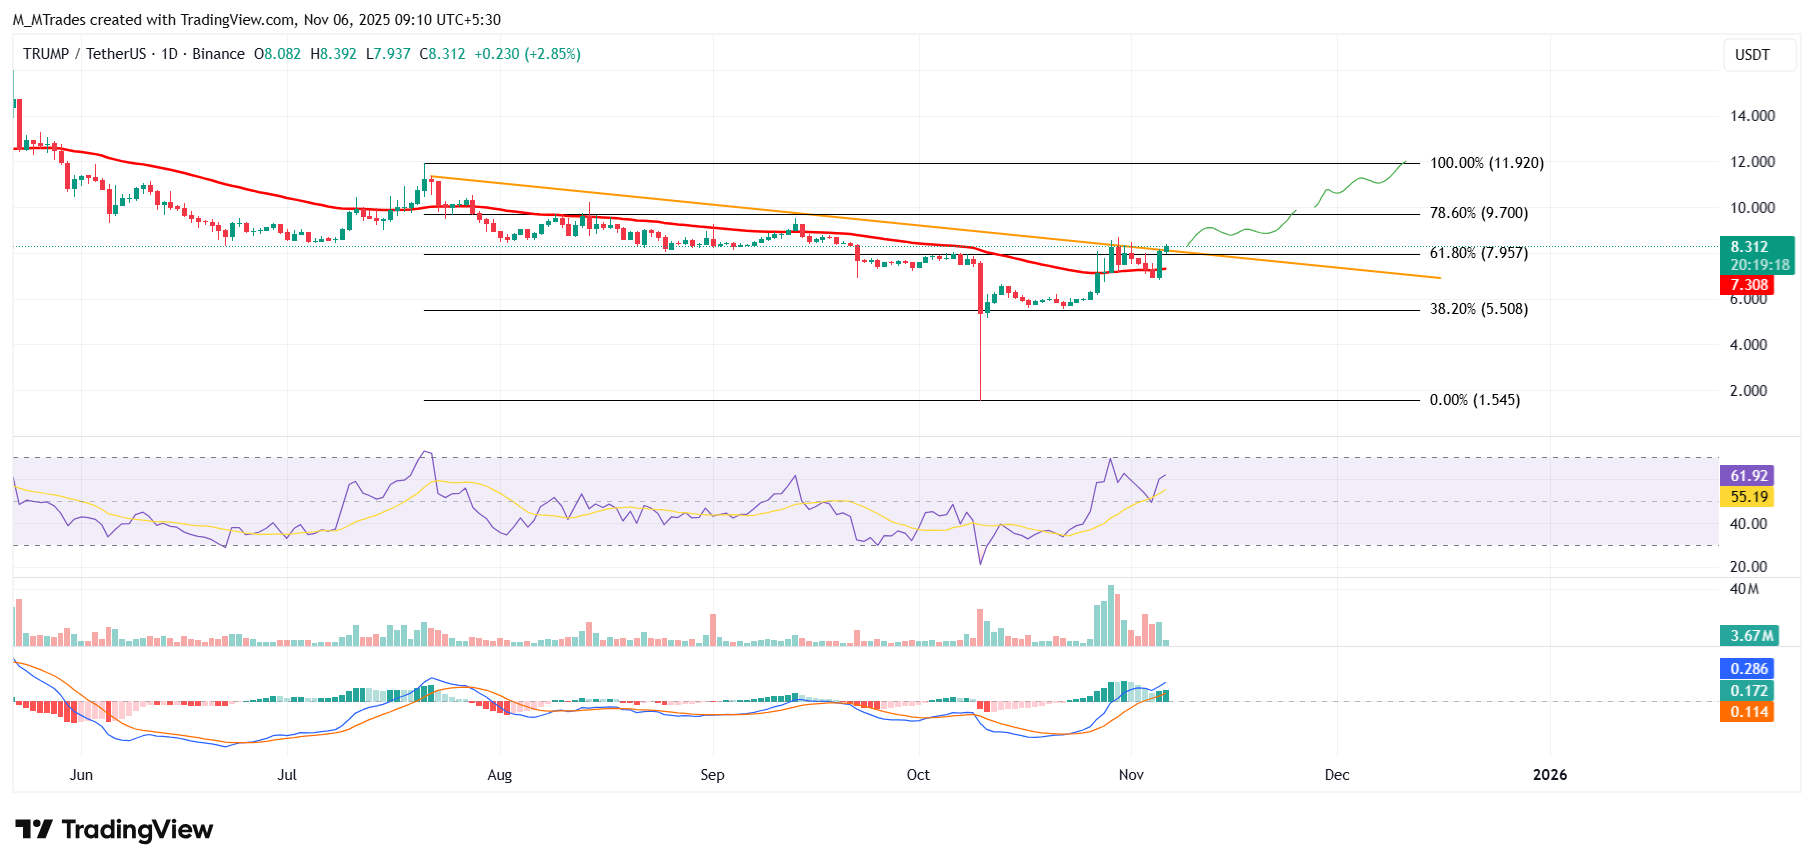
On the other hand, if TRUMP faces a correction, it could extend the decline toward the 50-day EMA at $7.30.

Acuity Trading
Acuity Trading은 2013년에 설립된 런던 기반 핀테크로, AI 기반 대체 데이터와 심리 분석을 통해 트레이딩과 투자를 지원합니다. 시각화된 뉴스와 심리 도구로 온라인 트레이딩 경험을 혁신했으며, 최신 AI 연구와 기술로 알파를 창출하는 대체 데이터와 높은 몰입도의 트레이딩 도구를 제공하며 시장을 선도하고 있습니다.
Read More


