
Trade The World
Pump.fun Price Forecast: PUMP eyes breakout toward record high as retail demand recovers
작성자 John Isige
게시일: 3 Oct 2025 | 수정일: 3 Oct 2025


POPULAR ARTICLES

Pump.fun (PUMP) is bullish on Friday, trading above the critical $0.0070 level, unfazed by subtle price corrections in Bitcoin (BTC) and Ethereum (ETH). The token native to Solana’s leading meme coin launchpad offers short-term bullish signals buoyed by key technical indicators.
- Pump.fun extends gains for a fourth straight day, recovering above $0.0070.
- PUMP derivatives market Open Interest edges up alongside the price increase.
- A Golden Cross pattern in the 4-hour time frame backs PUMP’s strong technical structure.
Pump.fun (PUMP) is bullish on Friday, trading above the critical $0.0070 level, unfazed by subtle price corrections in Bitcoin (BTC) and Ethereum (ETH). The token native to Solana’s leading meme coin launchpad offers short-term bullish signals buoyed by key technical indicators.
Pump.fun shows strength as retail demand increases
Retail interest in PUMP is gaining momentum, as evidenced by the derivatives market’s futures Open Interest (OI) recovery to $866 million after declining to $626 million on September 26.
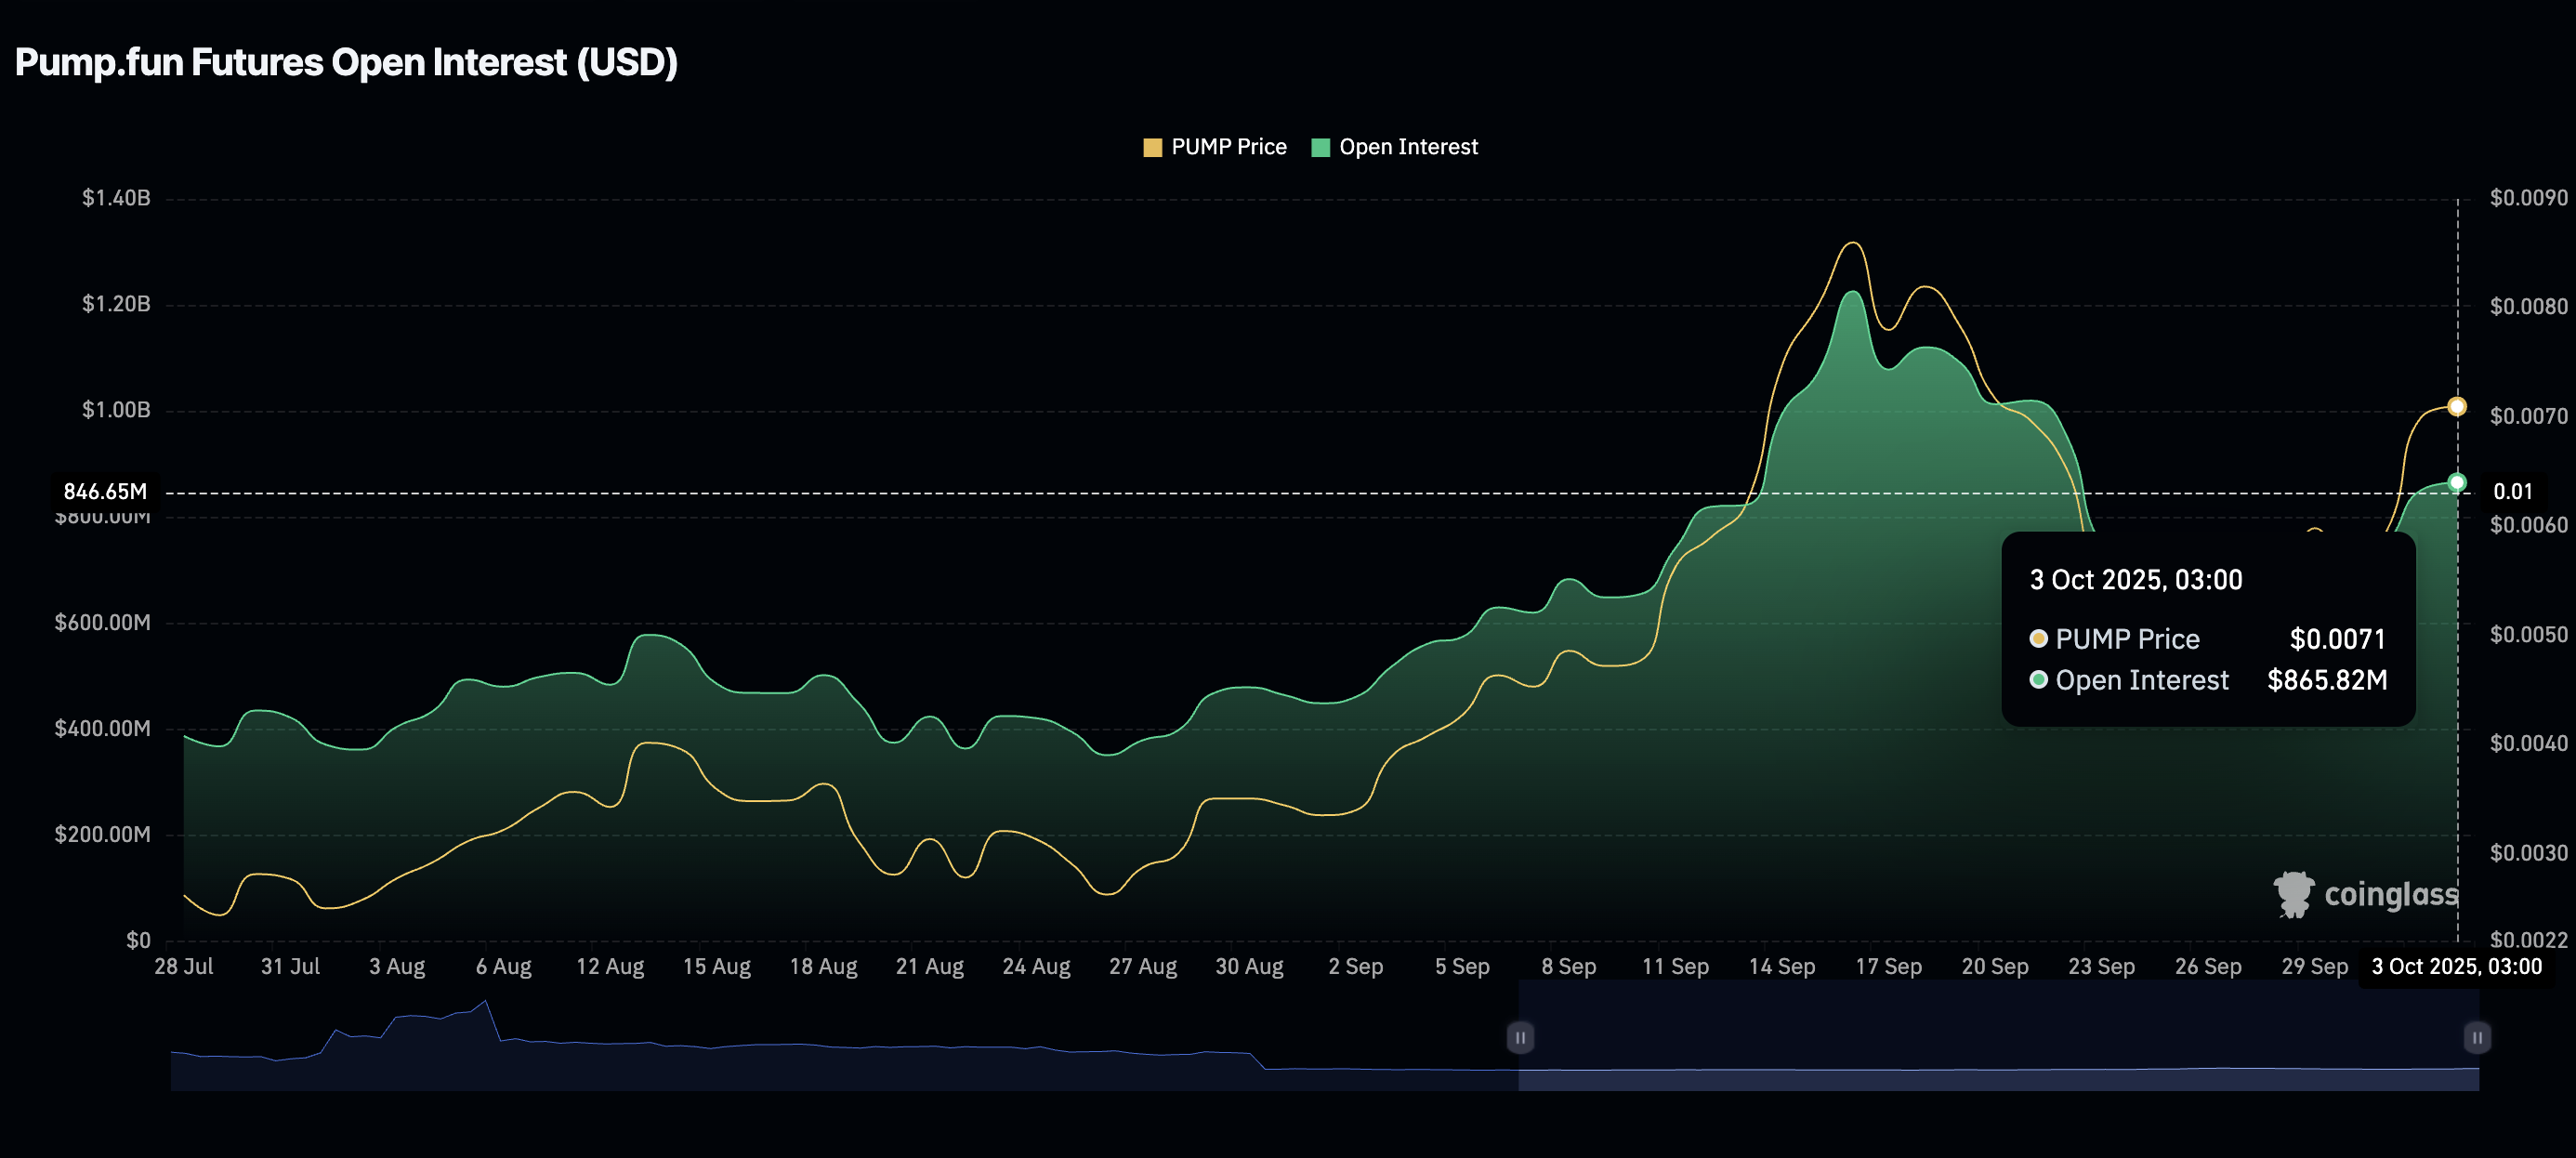
PUMP Open Interest | Source: CoinGlass
OI tracks the notional value of outstanding futures contracts; hence, a steady recovery suggests that traders are gaining confidence in the market. It also means that sentiment is improving, prompting traders to exit their short positions.
A subsequent recovery in the OI-Weighted Funding Rate, which averaged 0.0080% on Friday, suggests that traders are increasingly piling into long positions, thereby upholding the bullish momentum needed to sustain the uptrend.
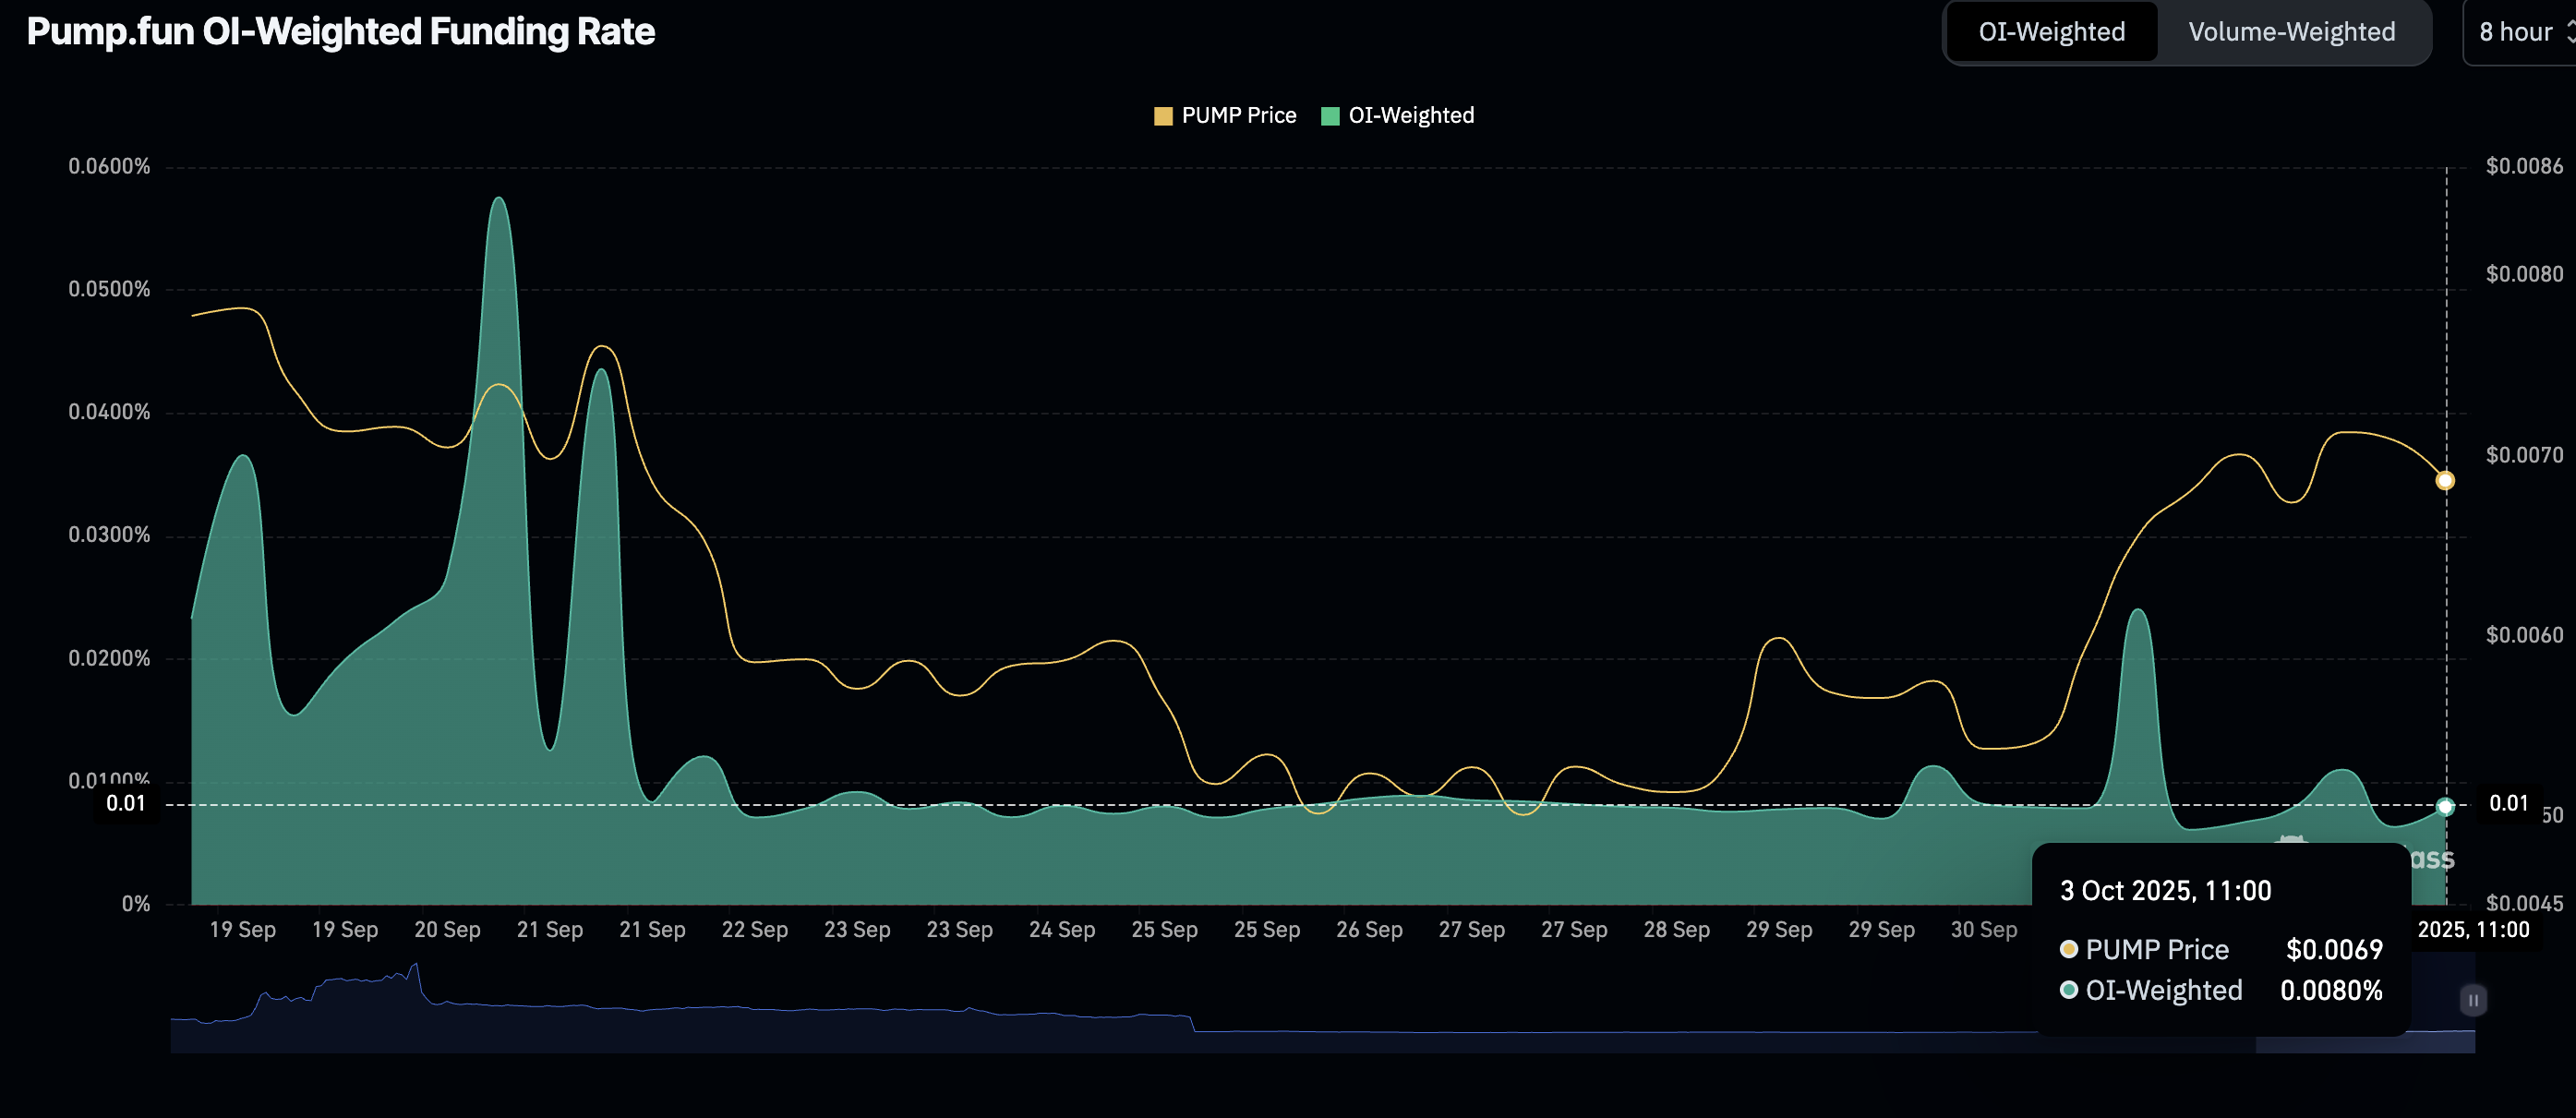
PUMP OI-Weighted Funding Rate | Source: CoinGlass
Technical outlook: PUMP holds key support
Pump.fun is positioned above the pivotal $0.0070 level, providing short-term support at the time of writing on Friday. A Golden Cross pattern on the 4-hour chart supports the current bullish sentiment as bulls eye an extended breakout toward PUMP’s record high of $0.0089.
This is a bullish pattern that occurs when a shorter-term moving average crosses above a longer-term moving average. The 50-period Exponential Moving Average (EMA) crossed above the 100-period EMA on Thursday, indicating that sentiment surrounding PUMP is improving.
Still, traders should be aware of the round-number supply area at $0.0080, which could delay the uptrend, especially if profit-taking takes center stage. The Relative Strength Index (RSI), which shows weakness at 62, indicates easing bullish momentum. A steady decline toward the midline could see PUMP trim part of the gains this week.
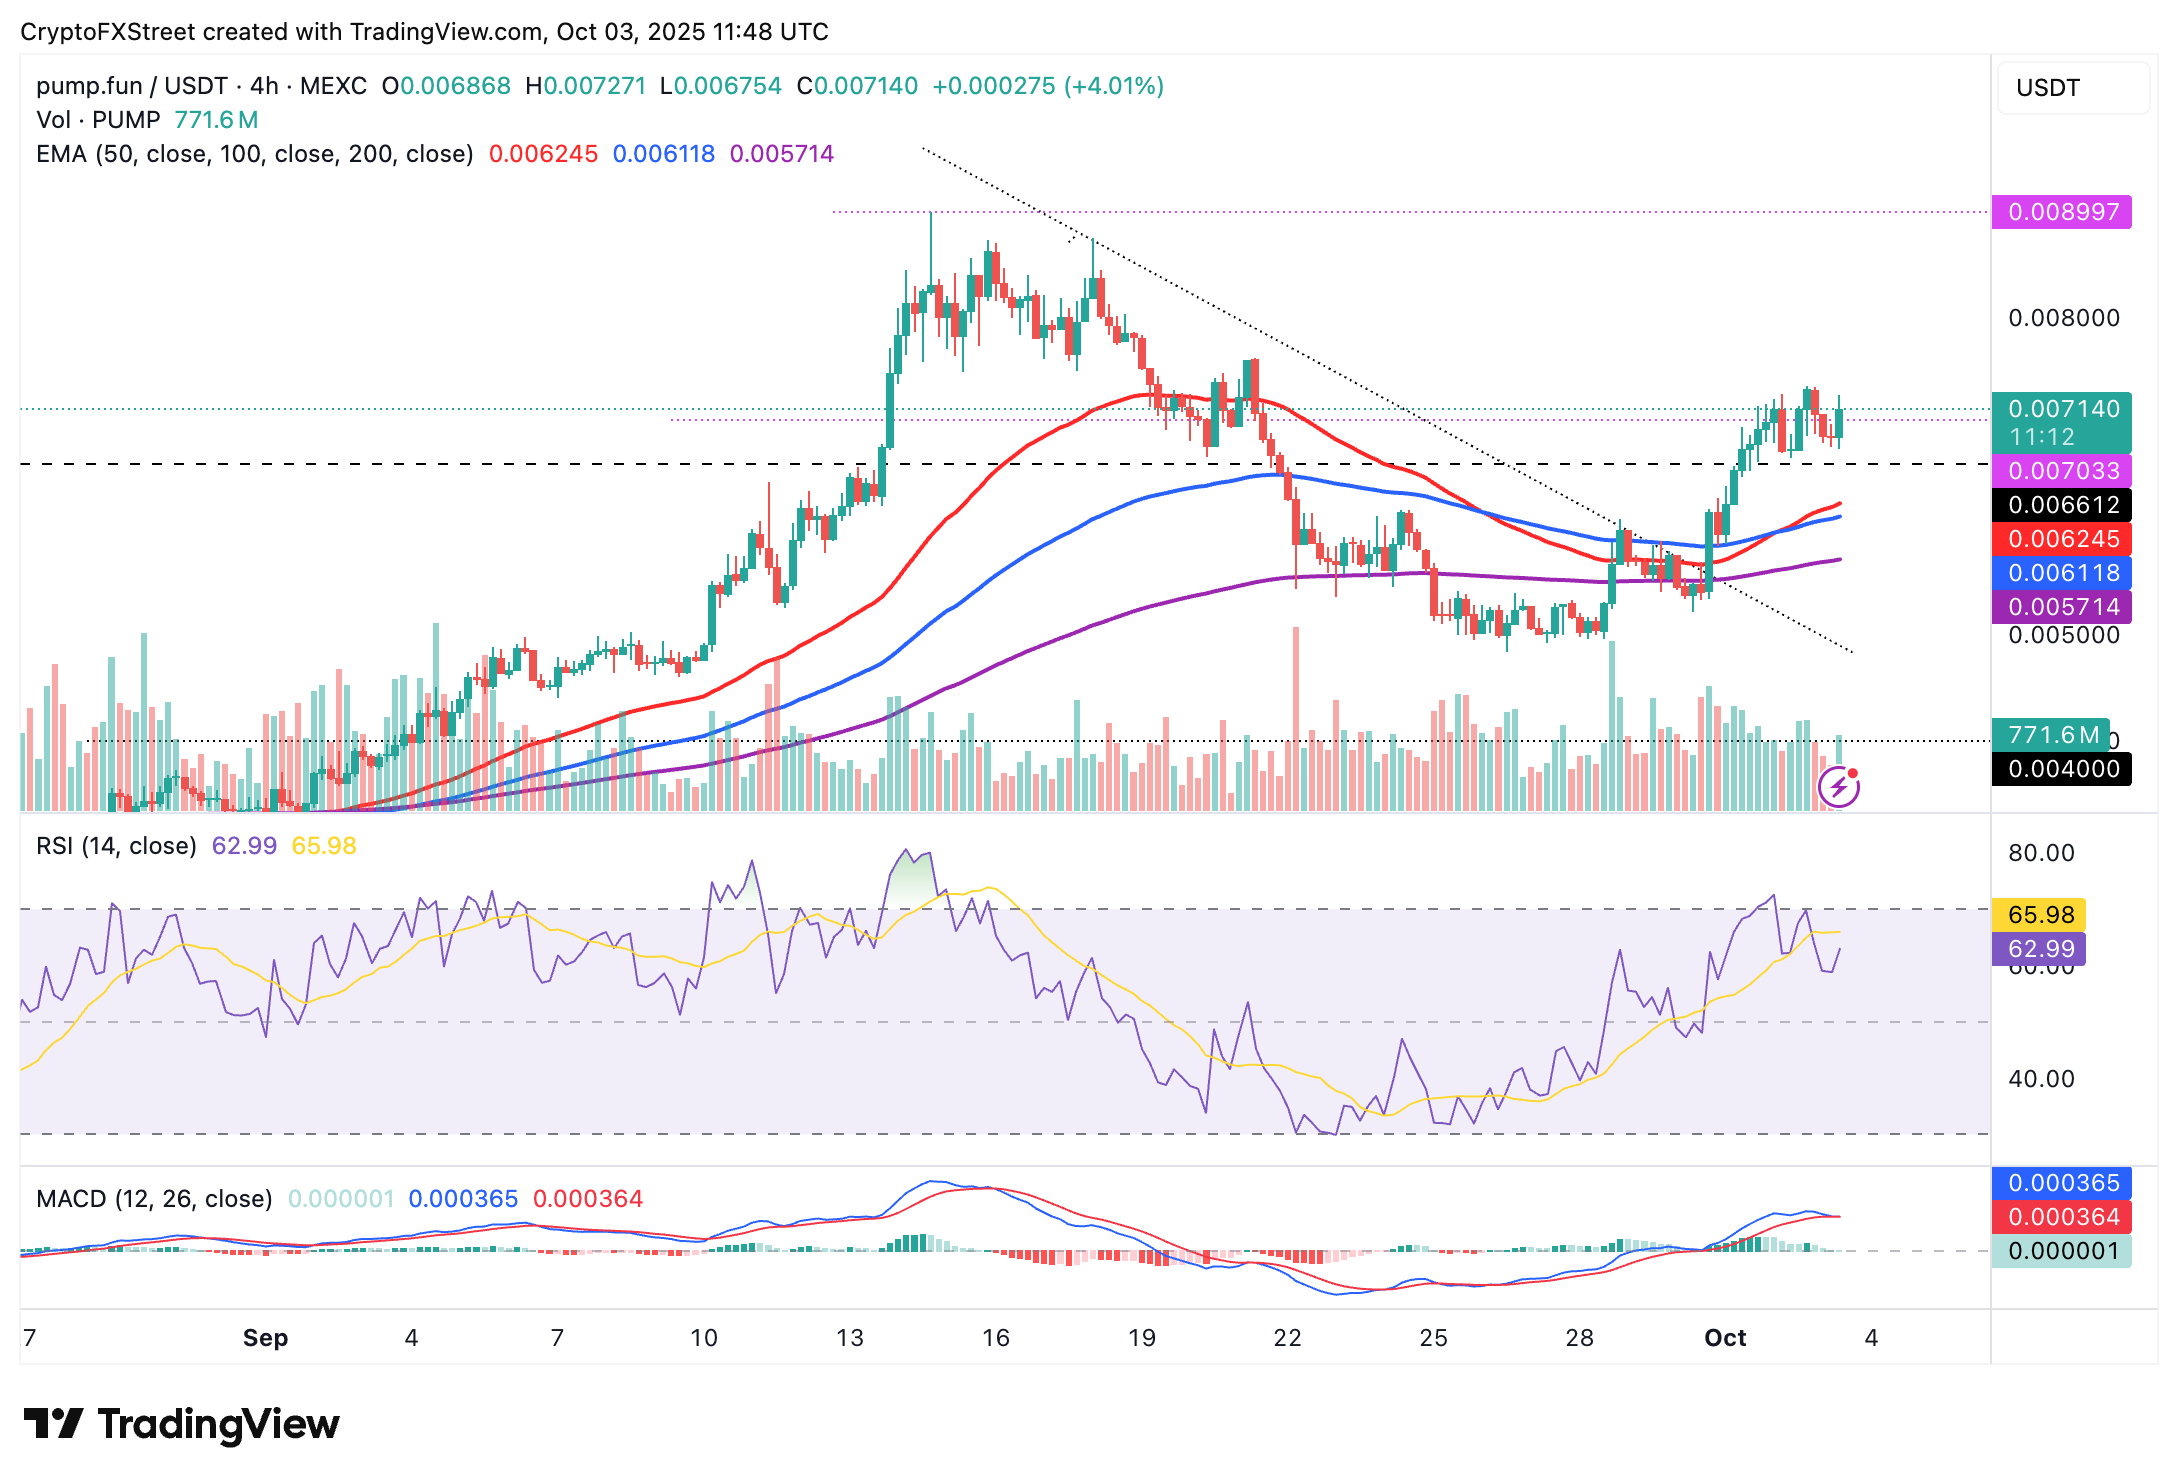
PUMP/USDT daily chart
The Moving Average Convergence Divergence (MACD) indicator could trigger a sell signal in upcoming sessions, as shown on the same 4-hour chart. The signal is triggered when the blue MACD line crosses and settles below the red signal line, prompting investors to consider reducing their risk exposure.
If PUMP breaches the short-term support at $0.0070, the odds of declining to test tentative support at the 50-period EMA, positioned at $0.0062, the 100-period EMA at $0.0061, and the 200-period EMA at $0.0057 could increase significantly.
Open Interest, funding rate FAQs
Higher Open Interest is associated with higher liquidity and new capital inflow to the market. This is considered the equivalent of increase in efficiency and the ongoing trend continues. When Open Interest decreases, it is considered a sign of liquidation in the market, investors are leaving and the overall demand for an asset is on a decline, fueling a bearish sentiment among investors.
Funding fees bridge the difference between spot prices and prices of futures contracts of an asset by increasing liquidation risks faced by traders. A consistently high and positive funding rate implies there is a bullish sentiment among market participants and there is an expectation of a price hike. A consistently negative funding rate for an asset implies a bearish sentiment, indicating that traders expect the cryptocurrency’s price to fall and a bearish trend reversal is likely to occur.

Acuity Trading
Acuity Trading은 2013년에 설립된 런던 기반 핀테크로, AI 기반 대체 데이터와 심리 분석을 통해 트레이딩과 투자를 지원합니다. 시각화된 뉴스와 심리 도구로 온라인 트레이딩 경험을 혁신했으며, 최신 AI 연구와 기술로 알파를 창출하는 대체 데이터와 높은 몰입도의 트레이딩 도구를 제공하며 시장을 선도하고 있습니다.
Read More


