
XRP risks extending sell-off amid fading retail demand
작성자 John Isige
게시일: 2 Mar 2026 | 수정일: 2 Mar 2026


인기 기사

Ripple (XRP) remains under pressure, trading around $1.35 at the time of writing on Monday. The remittance token extended its down leg to $1.27 on Saturday after the United States (US), in collaboration with Israel, launched attacks on Iran, killing the nation’s Supreme Leader, Ali Khamenei.
- XRP slides for the second consecutive day, reflecting risk-off sentiment in the broader crypto market.
- The US-Iran war is spreading across the Middle East, pressuring risk assets.
- Muted retail activity and mild ETF outflows could limit potential short-term recovery in XRP price.
Ripple (XRP) remains under pressure, trading around $1.35 at the time of writing on Monday. The remittance token extended its down leg to $1.27 on Saturday after the United States (US), in collaboration with Israel, launched attacks on Iran, killing the nation’s Supreme Leader, Ali Khamenei.
Although knee-jerk recovery pushed XRP to $1.43 on Sunday, the overall outlook leans bearishly as Iran escalates the war, striking several Middle East nations, including Iraq, Kuwait, Qatar, Saudi Arabia, Oman, Jordan and Bahrain, among others.
Risk sentiment is largely on the back foot, with investors on edge amid the escalation of the war. Global trade is also at risk, especially with Oil prices expected to increase. Since wars rarely favour risk assets, retail and institutional interest in XRP could continue to fade as the conflicts evolve.
XRP faces weak retail demand, mild ETF inflows
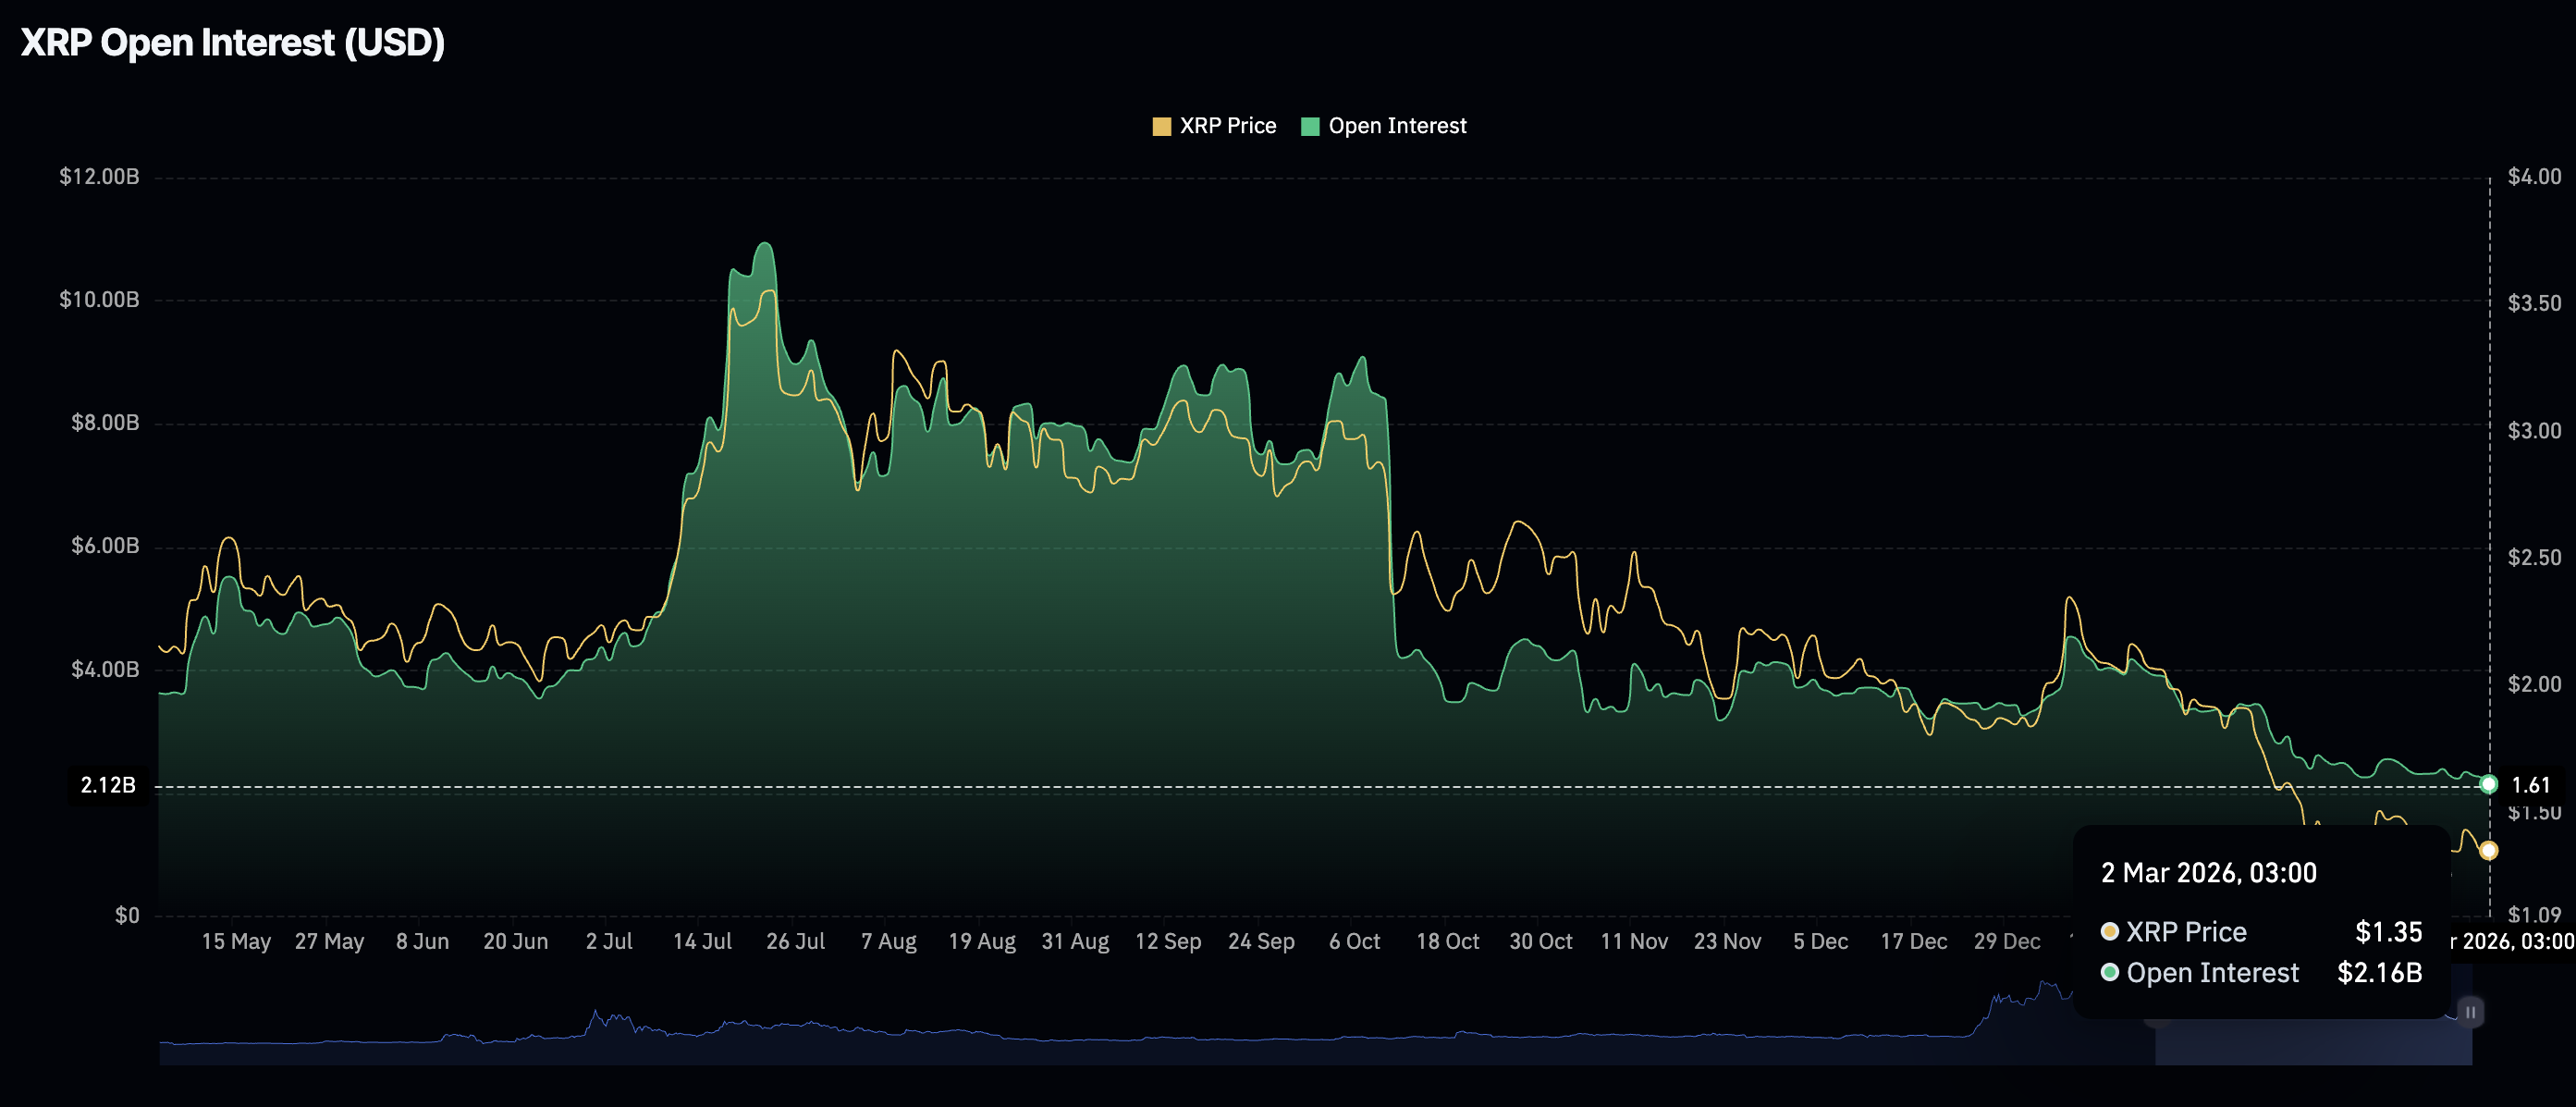
Retail investor interest in XRP has persistently waned, as evidenced by a significant slump in derivatives activity. CoinGlass data shows that the drop in futures Open Interest (OI) to $2.16 billion on Monday, from $2.26 billion the previous day, undermines risk appetite. The OI is at its lowest level since January 2025.
In contrast, OI hit a record $10.94 billion in July, coinciding with XRP reaching $3.66, the current all-time high. A steadily declining OI suggests that investors are unwilling to lean into risk and would rather close positions than open new ones.
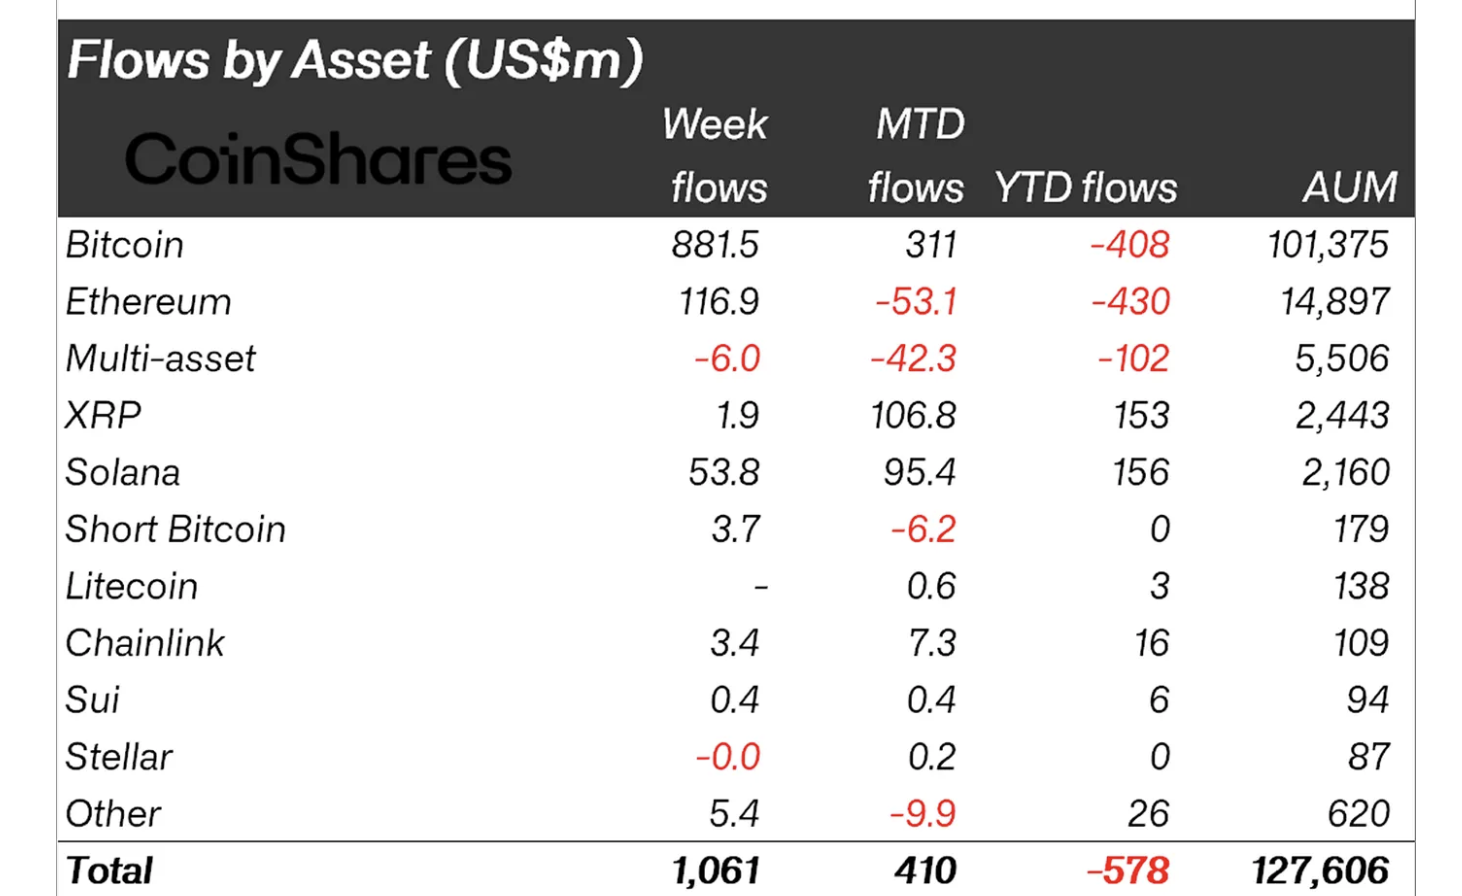
Institutional interest in XRP remains low despite mild inflows of $2.21 million into spot Exchange-Traded Funds (ETFs) on Friday. Cumulative inflows totaled $9.55 million last week, bringing the net assets under management to $983 million.
Meanwhile, digital assets products recorded $1 billion inflows last week, breaking a five-week outflow streak, according to CoinShares. XRP-related products saw $1.9 million in inflows, with total assets under management averaging $2.44 billion.
Inflows into Bitcoin (BTC) and Ethereum (ETH) totalled $886 million and $117 million, respectively, underscoring key technical resets and renewed whale accumulation.
“Digital asset investment products recorded $1 billion in inflows last week, ending a five-week stretch of outflows that totalled $4.0 billion. From a macro standpoint, it is difficult to attribute the shift in sentiment to a single catalyst,” CoinShares’ report states.
Technical outlook: Bearish indicators weigh on XRP
XRP trades around $1.35, well below the 50, 100 and 200-day Exponential Moving Averages (EMAs), which are clustered between $1.58 and $2.05. All three moving averages are sloping lower, keeping the broader trend under pressure despite recent recovery from the Saturday low of $1.27.
The Moving Average Convergence Divergence (MACD) indicator remains above the signal line on the daily chart, with the green histogram bars modestly expanding, suggesting mild bullish momentum and limited follow-through so far.
At the same time, the Relative Strength Index (RSI) around 39 is below the 50 midline on the same chart, reinforcing the view that sellers still retain an edge even as downside momentum has eased.
-1772455725612-1772455725616.png)
Meanwhile, immediate resistance emerges at $1.40, where recent candles have failed to break above the descending trendline. Further upside hurdles lie ahead, with the 50-day EMA at $1.59. A daily close above that moving average level would ease medium-term bearish pressure and open the way toward the 100-day EMA at $1.81.
Still, initial support lies at the recent floor and current spot area near $1.27. A clear break below this demand would expose XRP to the February low at $1.12.
Bitcoin, altcoins, stablecoins FAQs
Bitcoin is the largest cryptocurrency by market capitalization, a virtual currency designed to serve as money. This form of payment cannot be controlled by any one person, group, or entity, which eliminates the need for third-party participation during financial transactions.
Altcoins are any cryptocurrency apart from Bitcoin, but some also regard Ethereum as a non-altcoin because it is from these two cryptocurrencies that forking happens. If this is true, then Litecoin is the first altcoin, forked from the Bitcoin protocol and, therefore, an “improved” version of it.
Stablecoins are cryptocurrencies designed to have a stable price, with their value backed by a reserve of the asset it represents. To achieve this, the value of any one stablecoin is pegged to a commodity or financial instrument, such as the US Dollar (USD), with its supply regulated by an algorithm or demand. The main goal of stablecoins is to provide an on/off-ramp for investors willing to trade and invest in cryptocurrencies. Stablecoins also allow investors to store value since cryptocurrencies, in general, are subject to volatility.
Bitcoin dominance is the ratio of Bitcoin's market capitalization to the total market capitalization of all cryptocurrencies combined. It provides a clear picture of Bitcoin’s interest among investors. A high BTC dominance typically happens before and during a bull run, in which investors resort to investing in relatively stable and high market capitalization cryptocurrency like Bitcoin. A drop in BTC dominance usually means that investors are moving their capital and/or profits to altcoins in a quest for higher returns, which usually triggers an explosion of altcoin rallies.
(The technical analysis of this story was written with the help of an AI tool.)

Acuity Trading은 2013년에 설립된 런던 기반 핀테크로, AI 기반 대체 데이터와 심리 분석을 통해 트레이딩과 투자를 지원합니다. 시각화된 뉴스와 심리 도구로 온라인 트레이딩 경험을 혁신했으며, 최신 AI 연구와 기술로 알파를 창출하는 대체 데이터와 높은 몰입도의 트레이딩 도구를 제공하며 시장을 선도하고 있습니다.
더 읽기


