
Trade The World
Silver Price Forecast: XAG/USD consolidates above $42.50, highest since September 2011
작성자 Haresh Menghani
게시일: 16 Sep 2025 | 수정일: 16 Sep 2025


POPULAR ARTICLES

Silver (XAG/USD) enters a bullish consolidation phase near its highest level since September 2011 and oscillates in a range, just above mid-$42.00s during the Asian session on Tuesday.
- Silver bulls pause for a breather after touching the highest level since September 2011.
- The overbought daily RSI makes it prudent to wait for some near-term consolidation.
- Any corrective decline might still be seen as a buying opportunity and remain limited.
Silver (XAG/USD) enters a bullish consolidation phase near its highest level since September 2011 and oscillates in a range, just above mid-$42.00s during the Asian session on Tuesday.
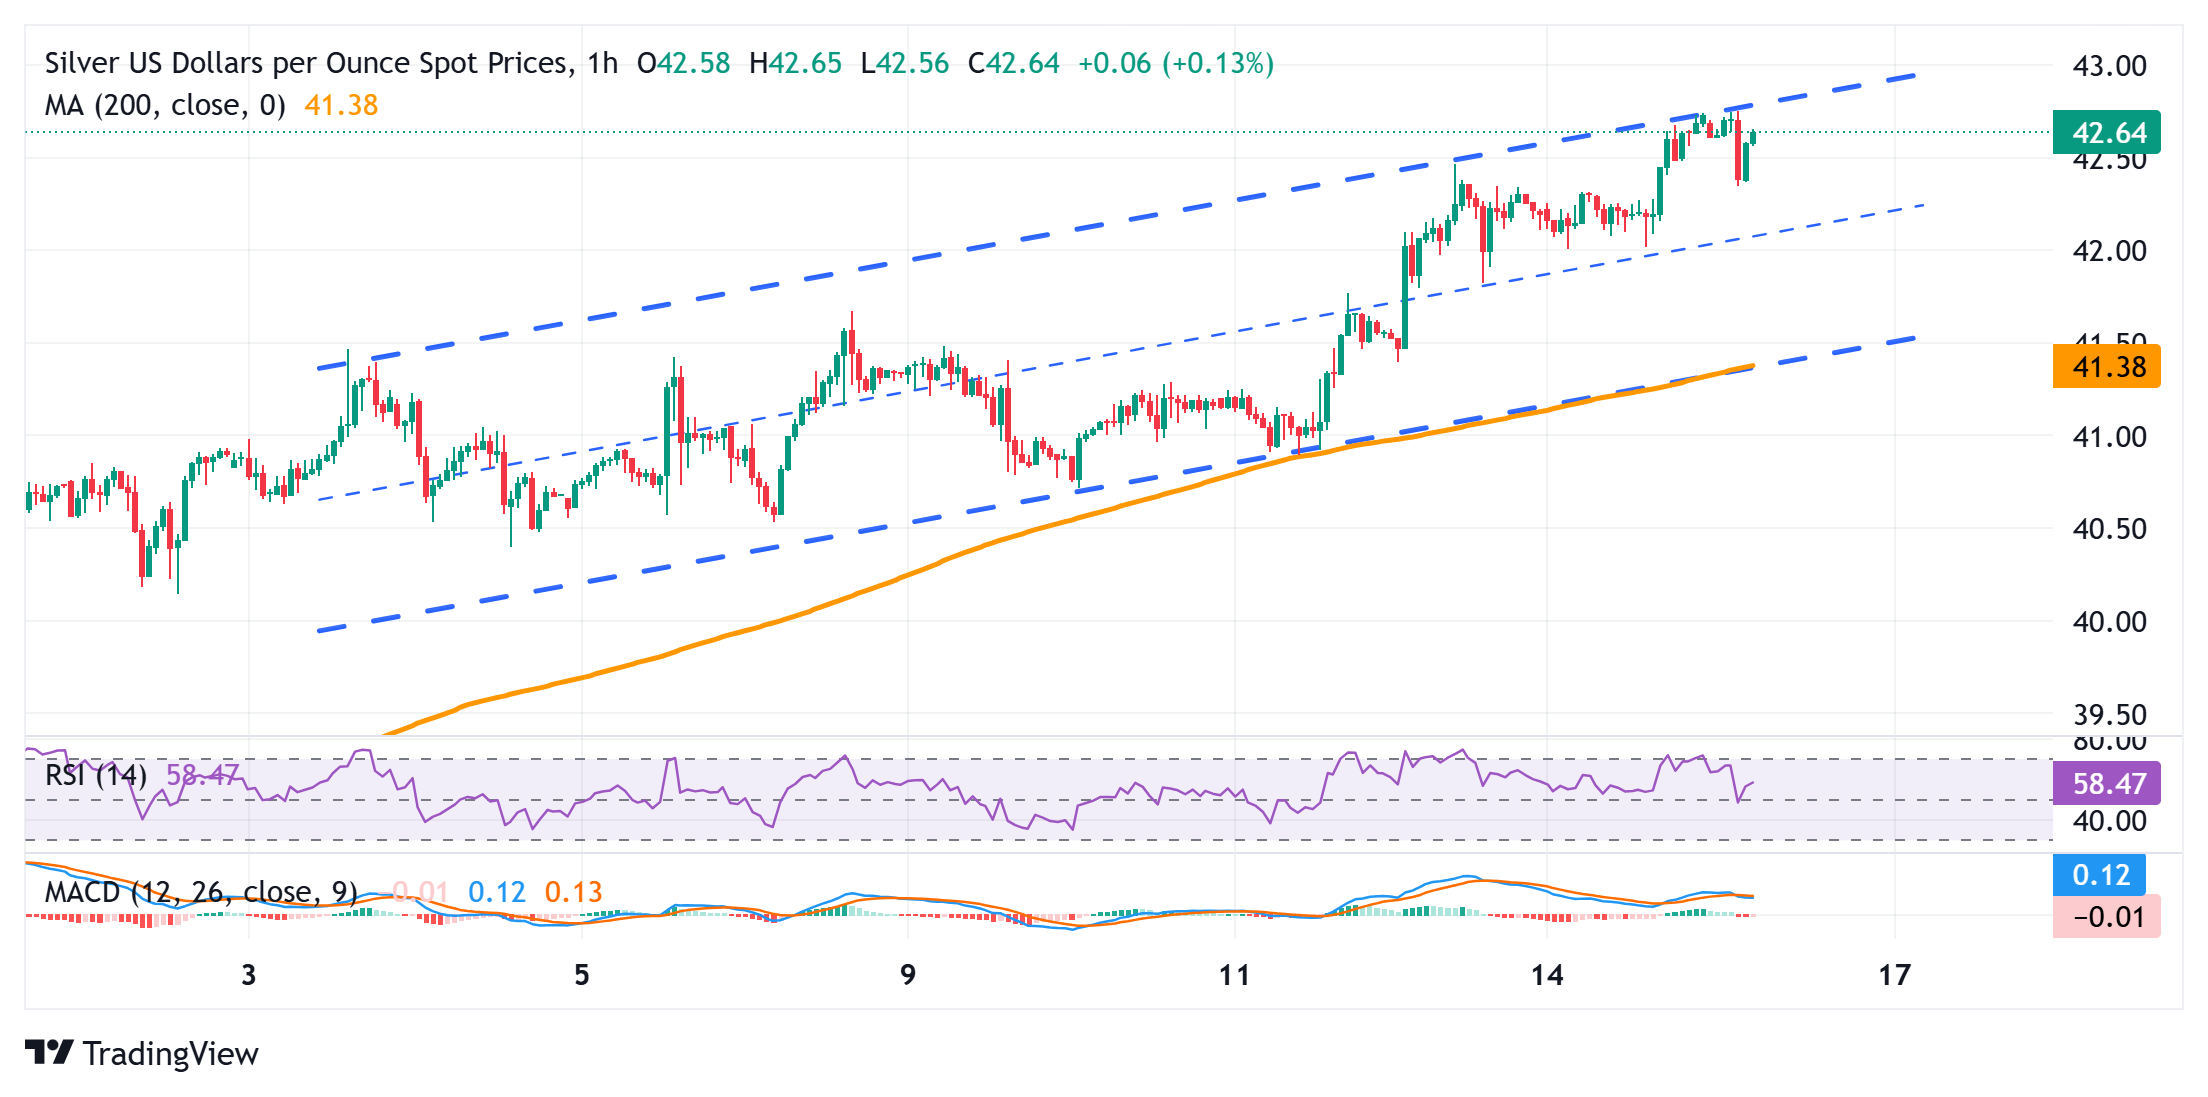
From a technical perspective, the recent strong move up witnessed over the past four weeks or so pauses near the top boundary of the month-to-date (MTD) ascending channel as traders opt to move to the sidelines ahead of the crucial FOMC policy meeting. Moreover, the overbought Relative Strength Index (RSI) on the daily chart further holds back the XAG/USD bulls from placing fresh bets.
This, in turn, makes it prudent to wait for an extension of the sideways consolidative price move or a modest pullback before the next leg up. That said, any corrective slide below Asian session low, around the $42.40-$42.35 zone, could be seen as a buying opportunity and limit losses for the XAG/USD near the $42.00 mark. A convincing break below, however, should pave the way for a deeper decline.
The subsequent fall could drag the white metal to the $41.40 confluence – comprising the lower boundary of the aforementioned channel and the 200-hour Simple Moving Average (SMA). A convincing break below would expose the $41.00 mark before the XAG/USD extends the corrective slide further towards the $40.80-$40.75 intermediate support en route to the $40.50-$40.45 region.
Meanwhile, bulls might now wait for a sustained move beyond the ascending channel resistance, currently pegged near the $42.75 region. This is followed by the $43.00 round figure, above which the XAG/USD could aim to challenge the September 2011 peak, around the $43.40 region, and climb further to the $44.00 round figure and the $44.25 region, or the August 2011 swing high.
Silver 1-hour chart
Silver FAQs
Silver is a precious metal highly traded among investors. It has been historically used as a store of value and a medium of exchange. Although less popular than Gold, traders may turn to Silver to diversify their investment portfolio, for its intrinsic value or as a potential hedge during high-inflation periods. Investors can buy physical Silver, in coins or in bars, or trade it through vehicles such as Exchange Traded Funds, which track its price on international markets.
Silver prices can move due to a wide range of factors. Geopolitical instability or fears of a deep recession can make Silver price escalate due to its safe-haven status, although to a lesser extent than Gold's. As a yieldless asset, Silver tends to rise with lower interest rates. Its moves also depend on how the US Dollar (USD) behaves as the asset is priced in dollars (XAG/USD). A strong Dollar tends to keep the price of Silver at bay, whereas a weaker Dollar is likely to propel prices up. Other factors such as investment demand, mining supply – Silver is much more abundant than Gold – and recycling rates can also affect prices.
Silver is widely used in industry, particularly in sectors such as electronics or solar energy, as it has one of the highest electric conductivity of all metals – more than Copper and Gold. A surge in demand can increase prices, while a decline tends to lower them. Dynamics in the US, Chinese and Indian economies can also contribute to price swings: for the US and particularly China, their big industrial sectors use Silver in various processes; in India, consumers’ demand for the precious metal for jewellery also plays a key role in setting prices.
Silver prices tend to follow Gold's moves. When Gold prices rise, Silver typically follows suit, as their status as safe-haven assets is similar. The Gold/Silver ratio, which shows the number of ounces of Silver needed to equal the value of one ounce of Gold, may help to determine the relative valuation between both metals. Some investors may consider a high ratio as an indicator that Silver is undervalued, or Gold is overvalued. On the contrary, a low ratio might suggest that Gold is undervalued relative to Silver.

Acuity Trading
Acuity Trading은 2013년에 설립된 런던 기반 핀테크로, AI 기반 대체 데이터와 심리 분석을 통해 트레이딩과 투자를 지원합니다. 시각화된 뉴스와 심리 도구로 온라인 트레이딩 경험을 혁신했으며, 최신 AI 연구와 기술로 알파를 창출하는 대체 데이터와 높은 몰입도의 트레이딩 도구를 제공하며 시장을 선도하고 있습니다.
Read More


