
Trade The World
Silver Price Forecast: XAG/USD tests $38.00 support near nine-day EMA
작성자 Akhtar Faruqui
게시일: 22 Aug 2025 | 수정일: 22 Aug 2025


POPULAR ARTICLES

Silver price (XAG/USD) depreciates after two days of gains, trading around $38.10 per troy ounce during the European hours on Friday. The technical analysis of the daily chart suggests the price of the precious metal remains within a descending channel pattern, indicating a bearish bias is active.
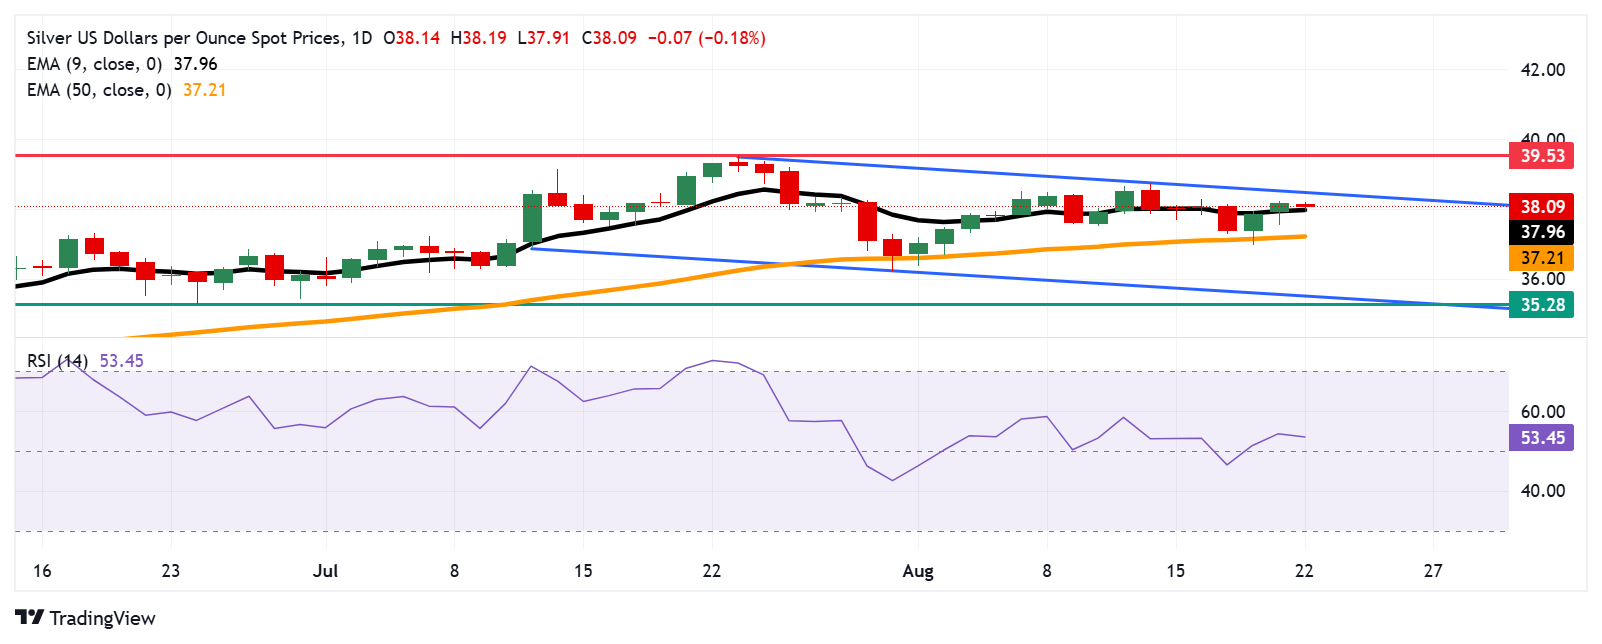
- Silver price tests initial support at the crucial level of $38.00, aligned with the nine-day EMA at $37.96.
- The 14-day Relative Strength Index remains above 50, indicating a potential bullish market outlook.
- The primary resistance appears at the descending channel’s upper boundary around $38.60.
Silver price (XAG/USD) depreciates after two days of gains, trading around $38.10 per troy ounce during the European hours on Friday. The technical analysis of the daily chart suggests the price of the precious metal remains within a descending channel pattern, indicating a bearish bias is active.
The 14-day Relative Strength Index (RSI) is positioned above the 50 level, suggesting the potential for a bullish market outlook. Additionally, the Silver price is trading slightly above the nine-day Exponential Moving Average (EMA), indicating that short-term price momentum is strengthening.
The Silver price is testing its immediate support at the psychological level of $38.00, aligned with the nine-day EMA at $37.96. A break below this crucial support zone may strengthen the bearish bias and prompt the pair to test the 50-day EMA of $37.21. Further declines would weaken the medium-term price momentum and put downward pressure on the XAG/USD pair to the descending channel’s lower boundary around $35.60, followed by the 11-week low at $35.28, recorded on June 24.
On the upside, the XAG/USD pair may find its initial barrier at the upper boundary of the descending channel around $38.60. A break above the channel could confirm the bullish bias and support the Silver price to explore the region around $39.53, the highest since September 2011, reached on July 23.
XAG/USD: Daily Chart
Silver FAQs
Silver is a precious metal highly traded among investors. It has been historically used as a store of value and a medium of exchange. Although less popular than Gold, traders may turn to Silver to diversify their investment portfolio, for its intrinsic value or as a potential hedge during high-inflation periods. Investors can buy physical Silver, in coins or in bars, or trade it through vehicles such as Exchange Traded Funds, which track its price on international markets.
Silver prices can move due to a wide range of factors. Geopolitical instability or fears of a deep recession can make Silver price escalate due to its safe-haven status, although to a lesser extent than Gold's. As a yieldless asset, Silver tends to rise with lower interest rates. Its moves also depend on how the US Dollar (USD) behaves as the asset is priced in dollars (XAG/USD). A strong Dollar tends to keep the price of Silver at bay, whereas a weaker Dollar is likely to propel prices up. Other factors such as investment demand, mining supply – Silver is much more abundant than Gold – and recycling rates can also affect prices.
Silver is widely used in industry, particularly in sectors such as electronics or solar energy, as it has one of the highest electric conductivity of all metals – more than Copper and Gold. A surge in demand can increase prices, while a decline tends to lower them. Dynamics in the US, Chinese and Indian economies can also contribute to price swings: for the US and particularly China, their big industrial sectors use Silver in various processes; in India, consumers’ demand for the precious metal for jewellery also plays a key role in setting prices.
Silver prices tend to follow Gold's moves. When Gold prices rise, Silver typically follows suit, as their status as safe-haven assets is similar. The Gold/Silver ratio, which shows the number of ounces of Silver needed to equal the value of one ounce of Gold, may help to determine the relative valuation between both metals. Some investors may consider a high ratio as an indicator that Silver is undervalued, or Gold is overvalued. On the contrary, a low ratio might suggest that Gold is undervalued relative to Silver.

Acuity Trading
Acuity Trading은 2013년에 설립된 런던 기반 핀테크로, AI 기반 대체 데이터와 심리 분석을 통해 트레이딩과 투자를 지원합니다. 시각화된 뉴스와 심리 도구로 온라인 트레이딩 경험을 혁신했으며, 최신 AI 연구와 기술로 알파를 창출하는 대체 데이터와 높은 몰입도의 트레이딩 도구를 제공하며 시장을 선도하고 있습니다.
Read More


