
Solana Price Forecast: SOL dips as hawkish Fed cuts dampen market sentiment
작성자 Manish Chhetri
게시일: 11 Dec 2025 | 수정일: 11 Dec 2025


인기 기사

Solana (SOL) price is trading below $130 at the time of writing on Thursday, after being rejected at the upper boundary of its falling wedge pattern. The broader market weakness following the Federal Reserve’s hawkish rate cut has added to downside momentum.
- Solana price trades lower on Thursday after rejecting the upper trendline of its falling wedge pattern.
- The Federal Reserve’s cautious, hawkish rate cut in December weighs on risk assets, such as SOL.
- On-chain data signals bearish momentum, with Spot Taker CVD showing clear sell-side dominance and rising retail activity.
Solana (SOL) price is trading below $130 at the time of writing on Thursday, after being rejected at the upper boundary of its falling wedge pattern. The broader market weakness following the Federal Reserve’s hawkish rate cut has added to downside momentum. Additionally, SOL's on-chain data suggest further downside, with rising sell-side dominance.
Fed’s cautious rate cut weighs on riskier assets
The broader crypto market softened after the Federal Open Market Committee (FOMC) meeting on Wednesday. In a widely expected move, the US Federal Reserve (Fed) lowered interest rates by 25 basis points to 3.50%-3.75% at the end of its two-day policy meeting but signaled a likely pause in January.
Adding to the cautious tone, policymakers projected only a one-quarter-percentage-point cut in 2026, the same outlook as in September, which tempered market expectations and contributed to short-term pressure on risk assets. This hawkish rate cut and the Fed’s cautious stance triggered a slight risk-off sentiment, weighing on riskier assets, with major cryptocurrencies such as Bitcoin, Ethereum, Ripple, and Solana trading lower as of Thursday.
On-chain data shows bearish signs
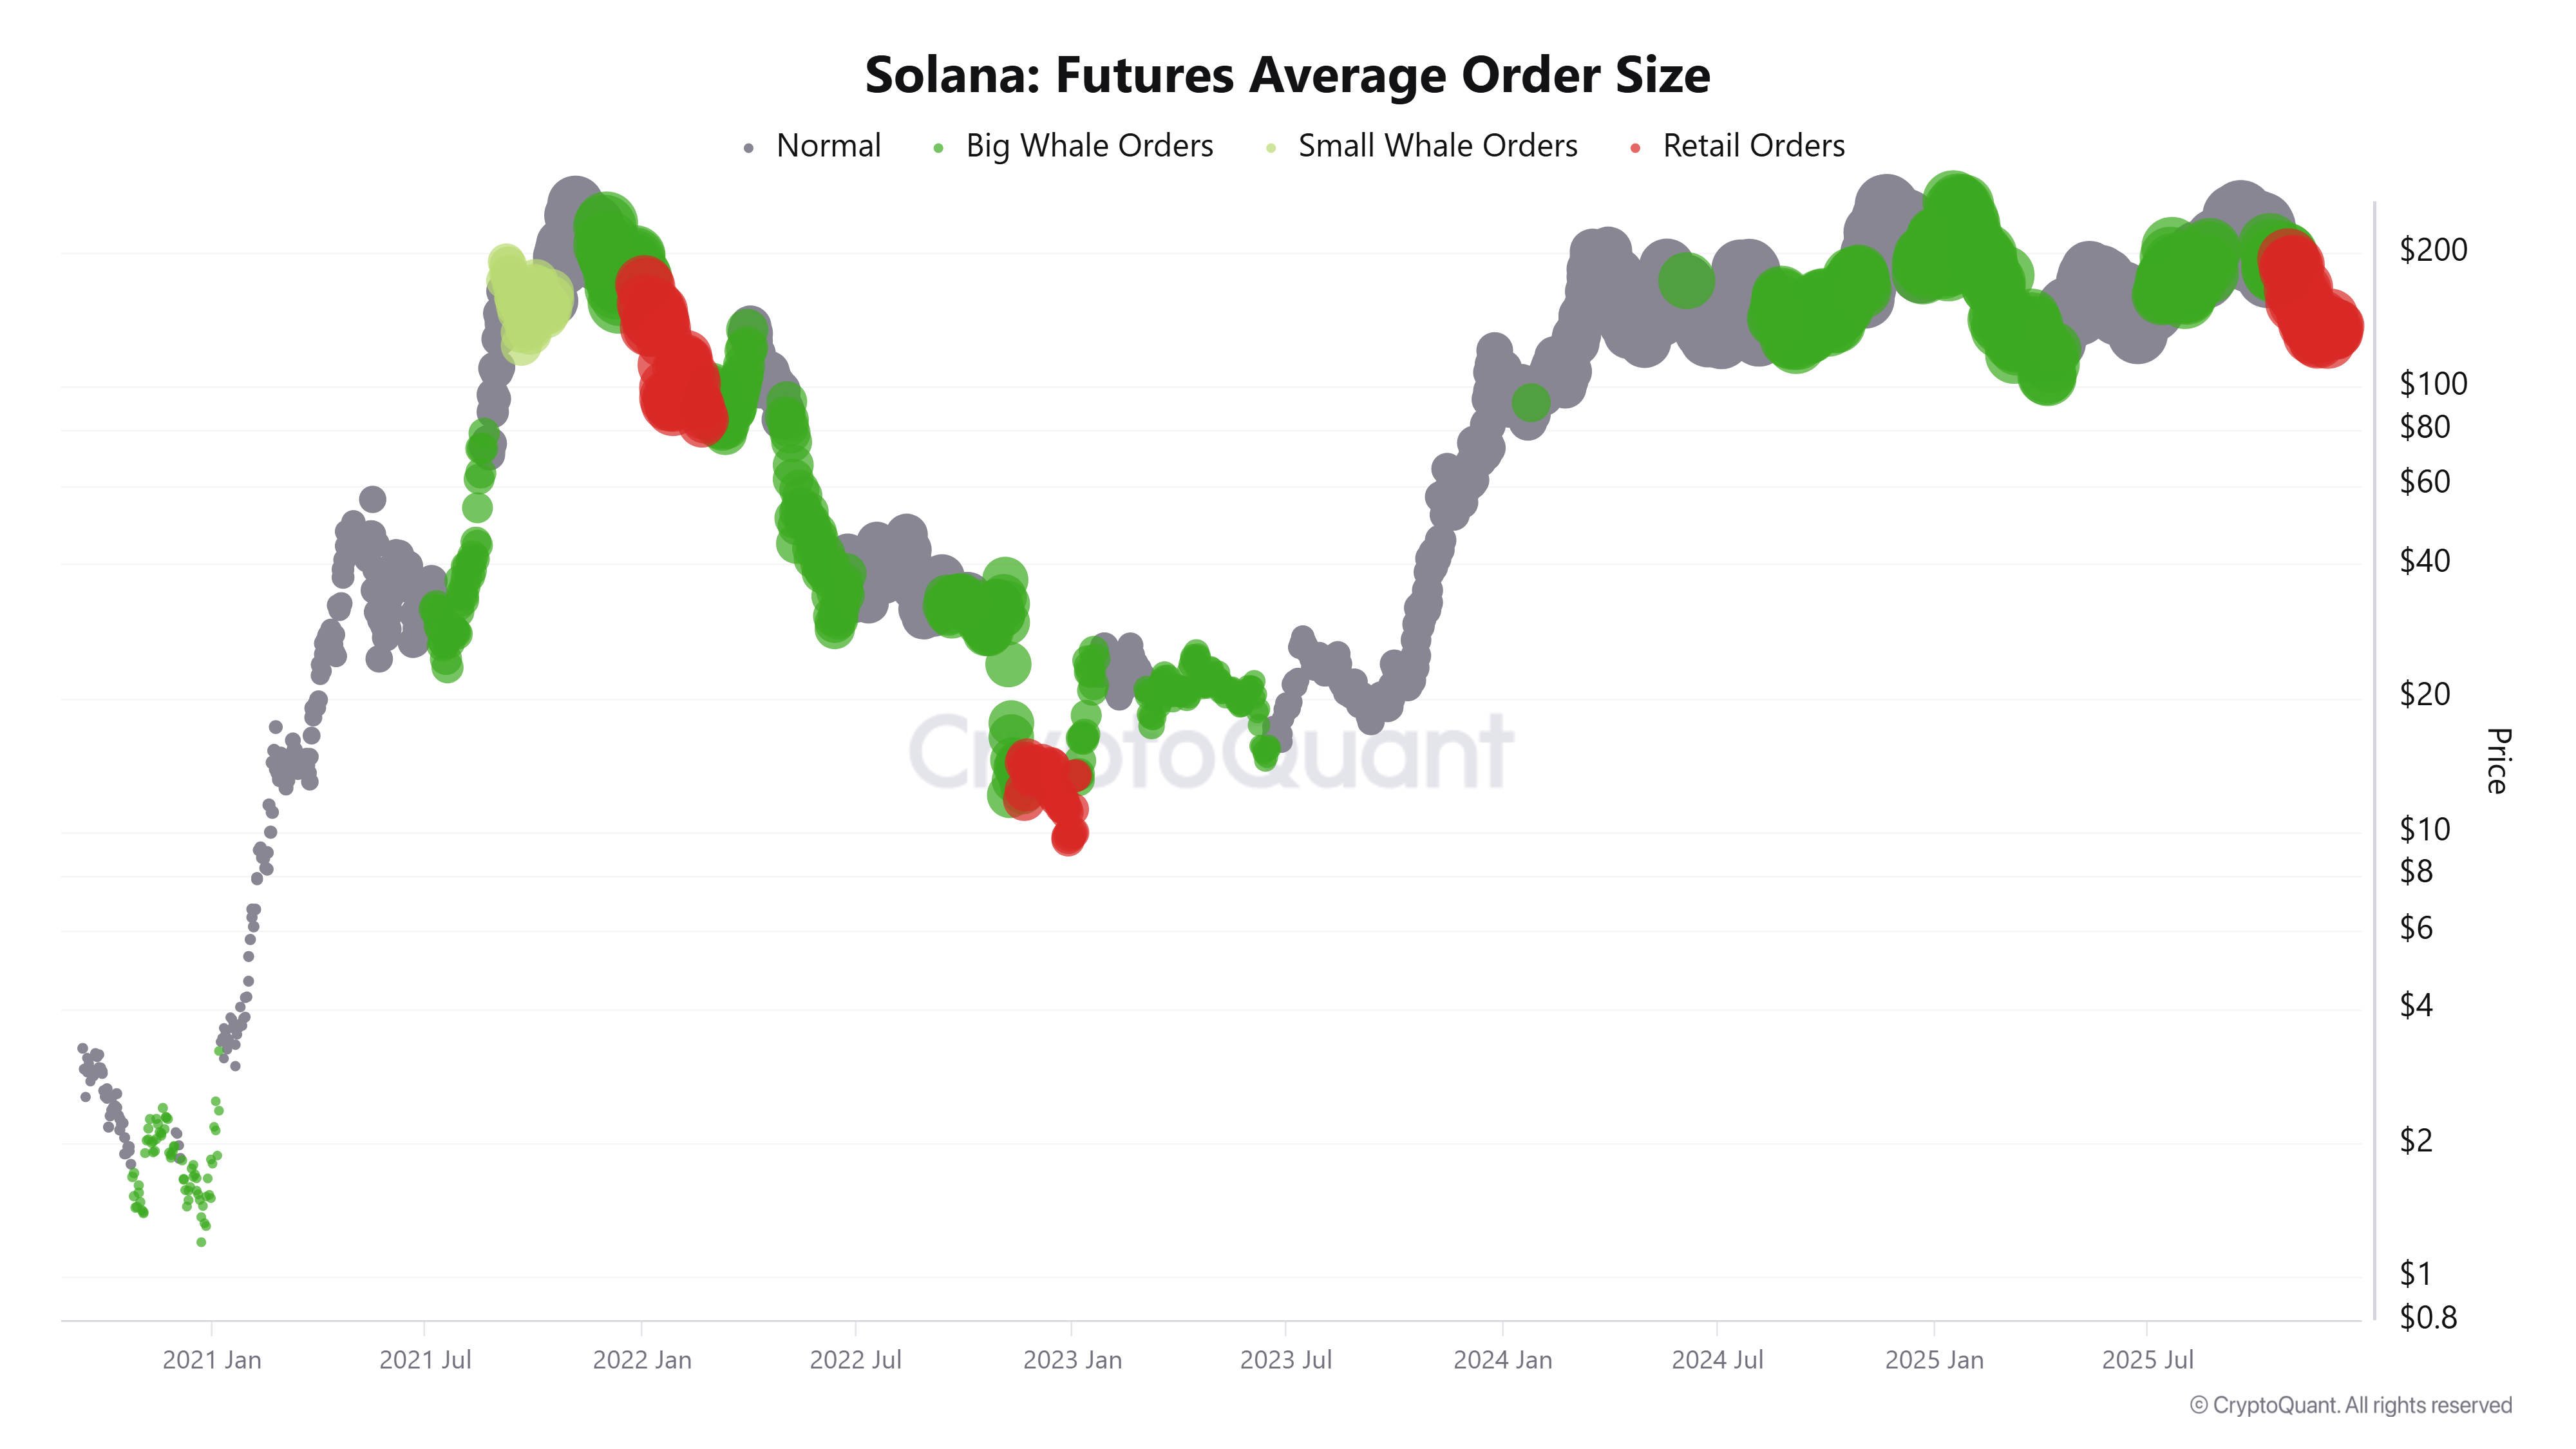
CryptoQuant data, as shown in the graph below, highlights selling pressure on Solana. The Taker CVD (Cumulative Volume Delta) for SOL turned negative on Wednesday. This indicator measures the cumulative difference between market buy and sell volumes over three months. When the 90-day CVD is positive and increasing, it suggests the Taker Buy Dominant Phase, while a negative and decreasing value indicates the Taker Sell Dominant Phase.
 (2)-1765430722962-1765430722964.png)
CryptoQuant’s Futures Average Order Size indicator — which tracks the average size of executed SOL futures trades — shows a rise in smaller order sizes, signaling increased retail activity in the market that does not bode well with the SOL price.
Solana Price Forecast: SOL faces rejection from key level
Solana price faced rejection from the upper trendline boundary of the falling wedge pattern (drawn ) on Wednesday. As of Thursday, SOL is down 3.87% to around $130.99.
If SOL continues its downward trend, it could extend the decline toward the November 21 low of $121.66.
The Relative Strength Index (RSI) on the daily reads 40, below its neutral level of 50 and pointing downward, indicating bearish momentum.
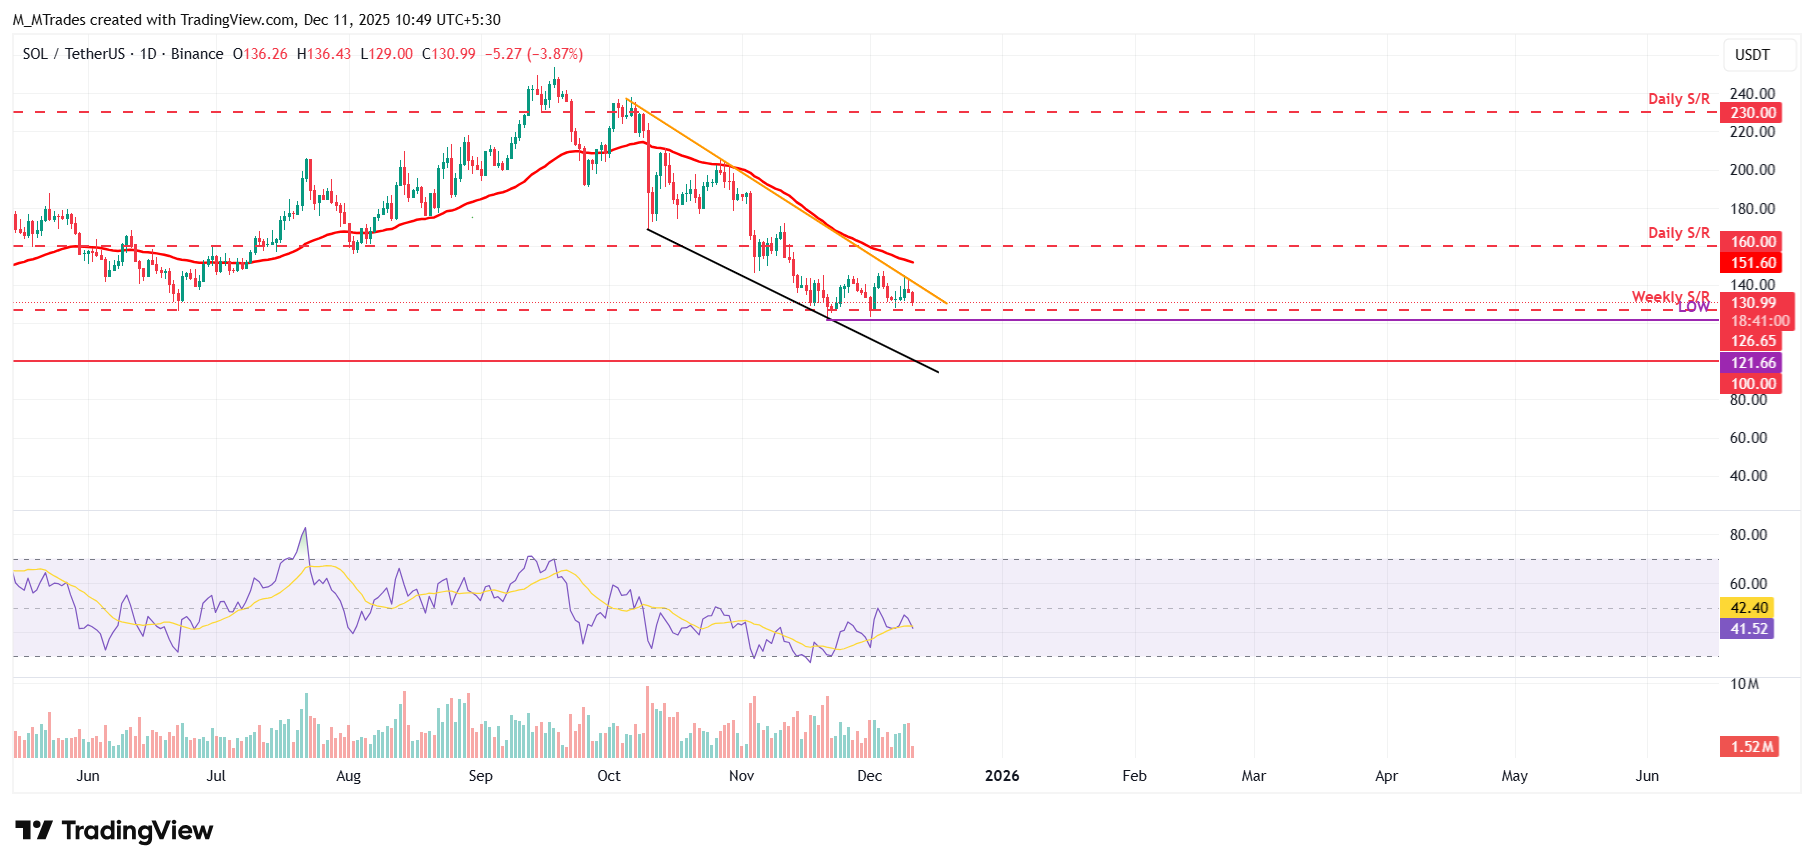
However, if SOL recovers, it could extend the recovery toward the 50-day EMA at $151.60.

Acuity Trading은 2013년에 설립된 런던 기반 핀테크로, AI 기반 대체 데이터와 심리 분석을 통해 트레이딩과 투자를 지원합니다. 시각화된 뉴스와 심리 도구로 온라인 트레이딩 경험을 혁신했으며, 최신 AI 연구와 기술로 알파를 창출하는 대체 데이터와 높은 몰입도의 트레이딩 도구를 제공하며 시장을 선도하고 있습니다.
더 읽기


