
Trade The World
Top 3 Price Prediction: Bitcoin, Ethereum, Ripple – BTC, ETH, and XRP attempt recovery after a sharp correction
작성자 Manish Chhetri
게시일: 19 Nov 2025 | 수정일: 19 Nov 2025


POPULAR ARTICLES

Bitcoin (BTC), Ethereum (ETH) and Ripple (XRP) stabilize mid-week after correcting sharply earlier this week. BTC hovers near $92,000 after briefly slipping below $90,000 earlier. Meanwhile, ETH and XRP are defending key support levels, suggesting a recovery in the coming days.
- Bitcoin price hovers around $92,000 on Wednesday after dipping below $90,000 earlier this week.
- Ethereum finds support at $3,017, holding above this level could signal the beginning of a recovery phase.
- XRP steadies around $2.23, pausing after a 6% correction in the previous week.
Bitcoin (BTC), Ethereum (ETH) and Ripple (XRP) stabilize mid-week after correcting sharply earlier this week. BTC hovers near $92,000 after briefly slipping below $90,000 earlier. Meanwhile, ETH and XRP are defending key support levels, suggesting a recovery in the coming days.
Bitcoin finds support around a key psychological level at $90,000
Bitcoin started the week on a negative note and extended its decline by 2%, closing below the 61.8% Fibonacci retracement level at $94,253 (drawn from the April 7 low of $74,508 to the all-time high of $126,299 set on October 6). On Tuesday, BTC dipped to $89,253 but rebounded from the key psychological $90,000 level, ultimately closing the day higher at $92,960. At the time of writing on Wednesday, BTC hovers at around $92,600.
If the psychological level at $90,000 continues to hold, BTC could extend the recovery toward the 61.8% Fibonacci retracement at $94,253.
The Relative Strength Index (RSI) on the daily chart is 30, hovering near oversold territory, suggesting bearish momentum may be slowing and a potential short-term rebound could emerge.
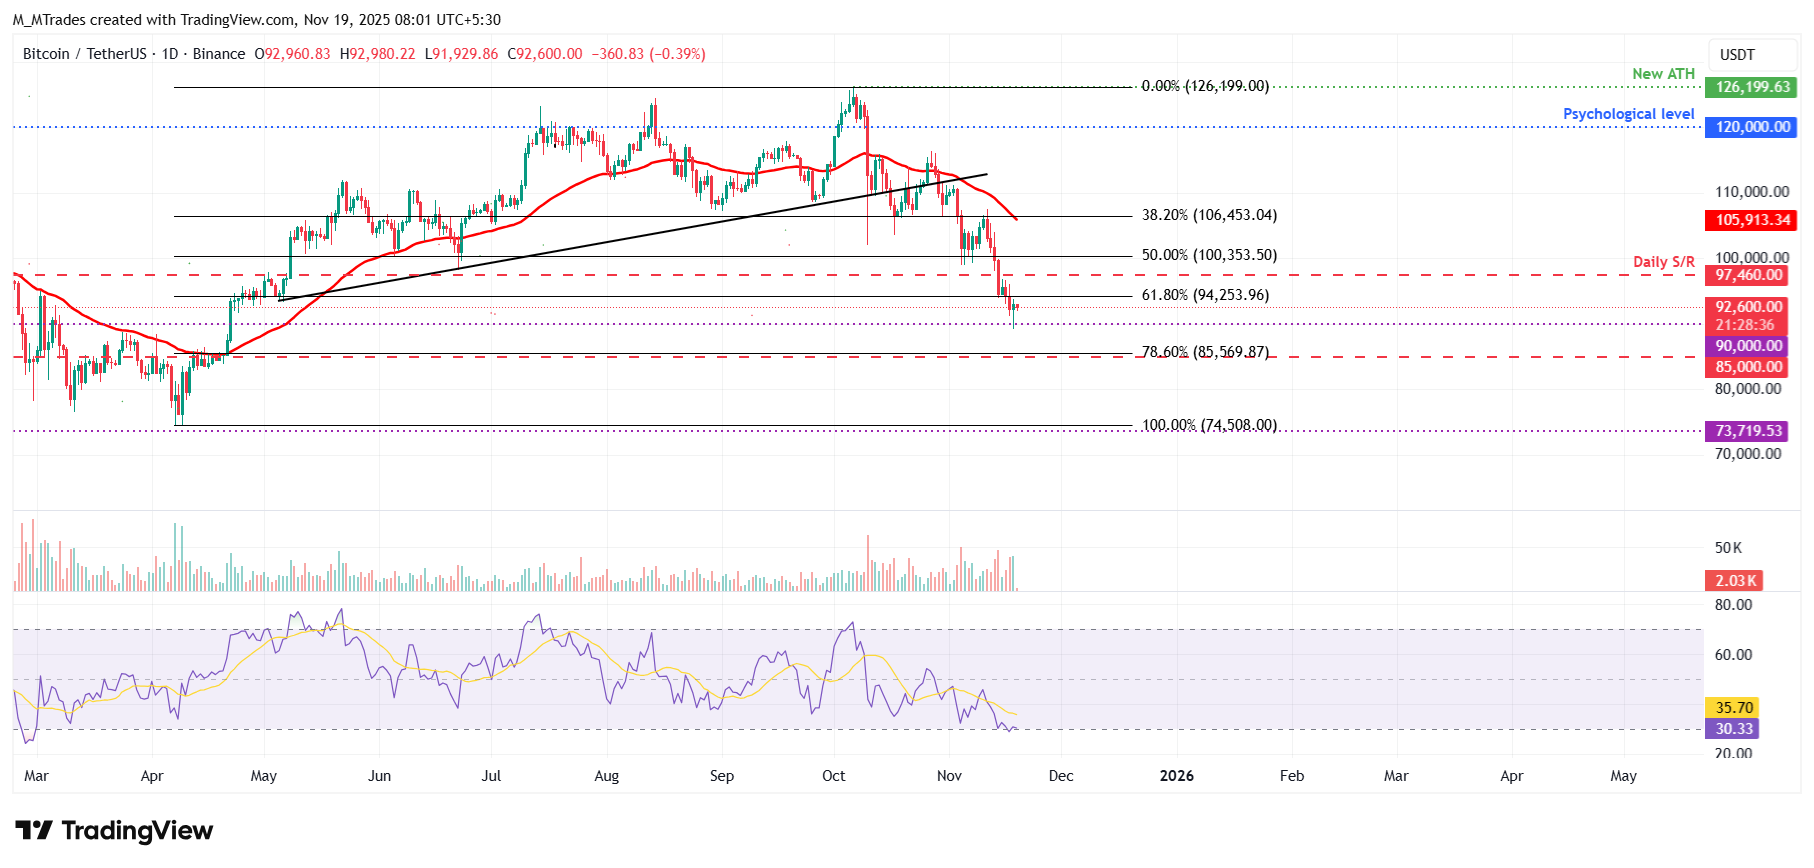
On the other hand, if BTC closes below $90,000, it could extend the correction toward the next daily support at $85,000.
Ethereum rebounds slightly after retesting the key support level
Ethereum price faced rejection at the previous broken trendline around $3,592 last week and declined by nearly 14%. ETH continued its correction at the start of this week, reaching a low of $2,946 on Tuesday, but rebounded slightly after retesting the low at $3,017. At the time of writing on Wednesday, ETH hovers at around $3,118.
If ETH finds support around $3,017, it could extend the recovery toward the key resistance level at $3,592.
Like Bitcoin, Ethereum’s RSI is rebounding from oversold territory, suggesting fading bearish momentum and early signs of recovery.
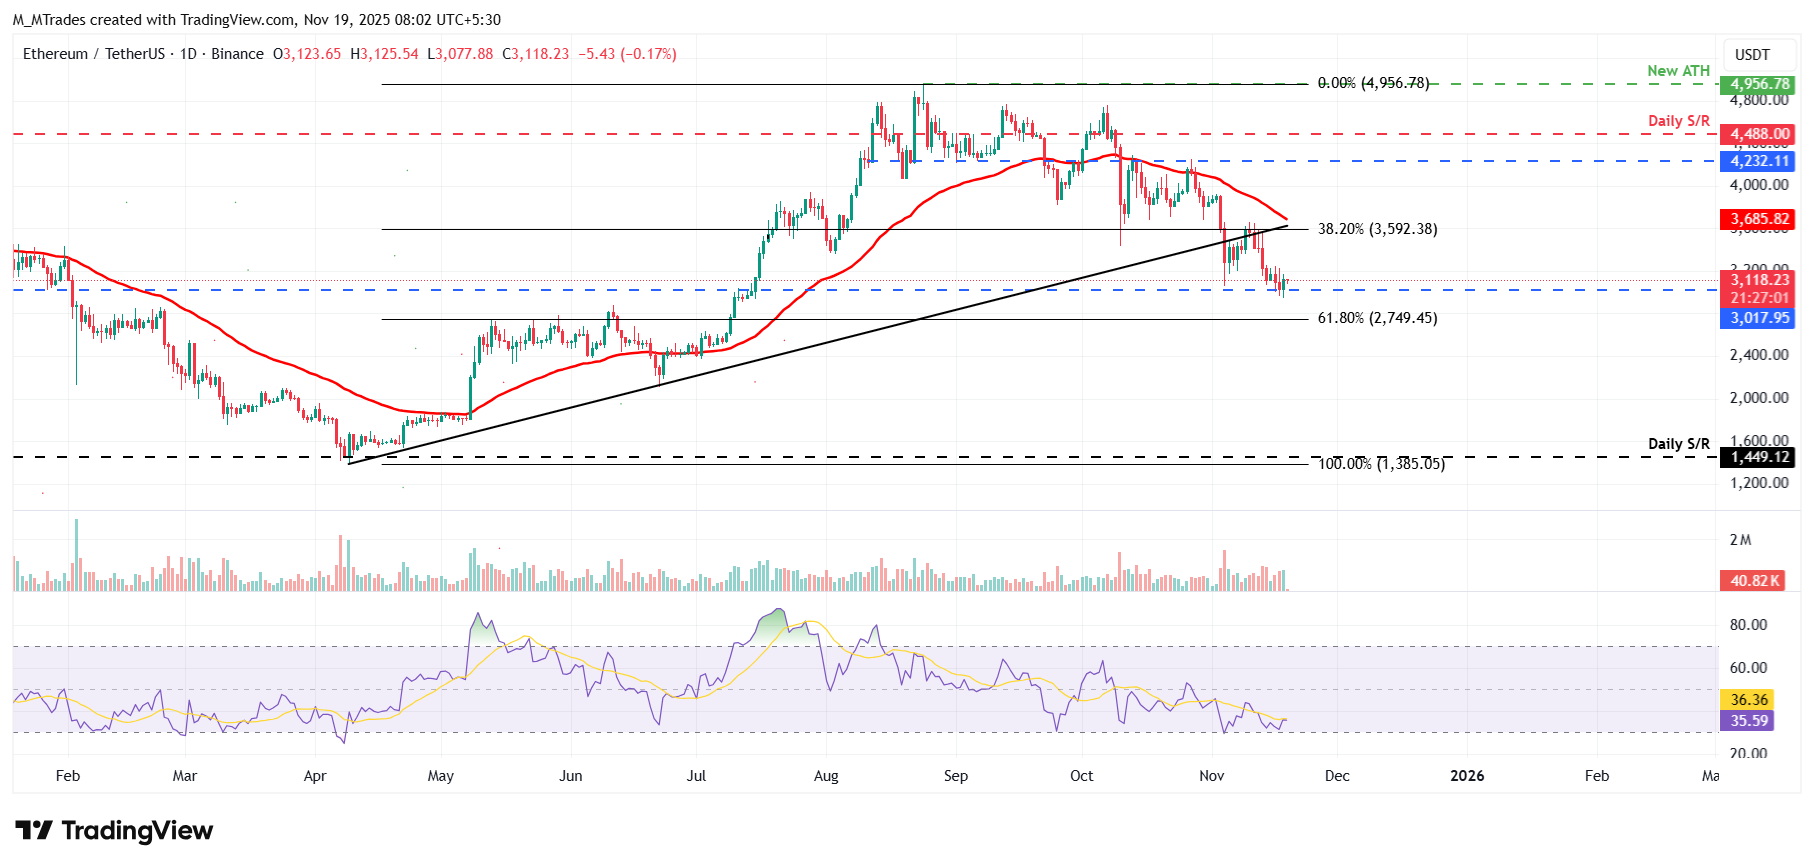
However, if ETH closes below $3,017, it could extend the decline toward the next key support at $2,749.
XRP’s momentum indicators hint at fading bearish strength
XRP price found rejection from the 50-day EMA at $2.47 last week and declined nearly 7%. XRP continued its correction on Monday, but recovered slightly the next day. At the time of writing on Wednesday, XRP hovers at around $2.21.
If XRP continues its recovery, it could extend the rally toward the 50-day EMA at $2.47.
The RSI on the daily chart is 41, near its neutral level of 50, suggesting fading bearish momentum. For the recovery rally to be sustained, the RSI must move above the neutral level.
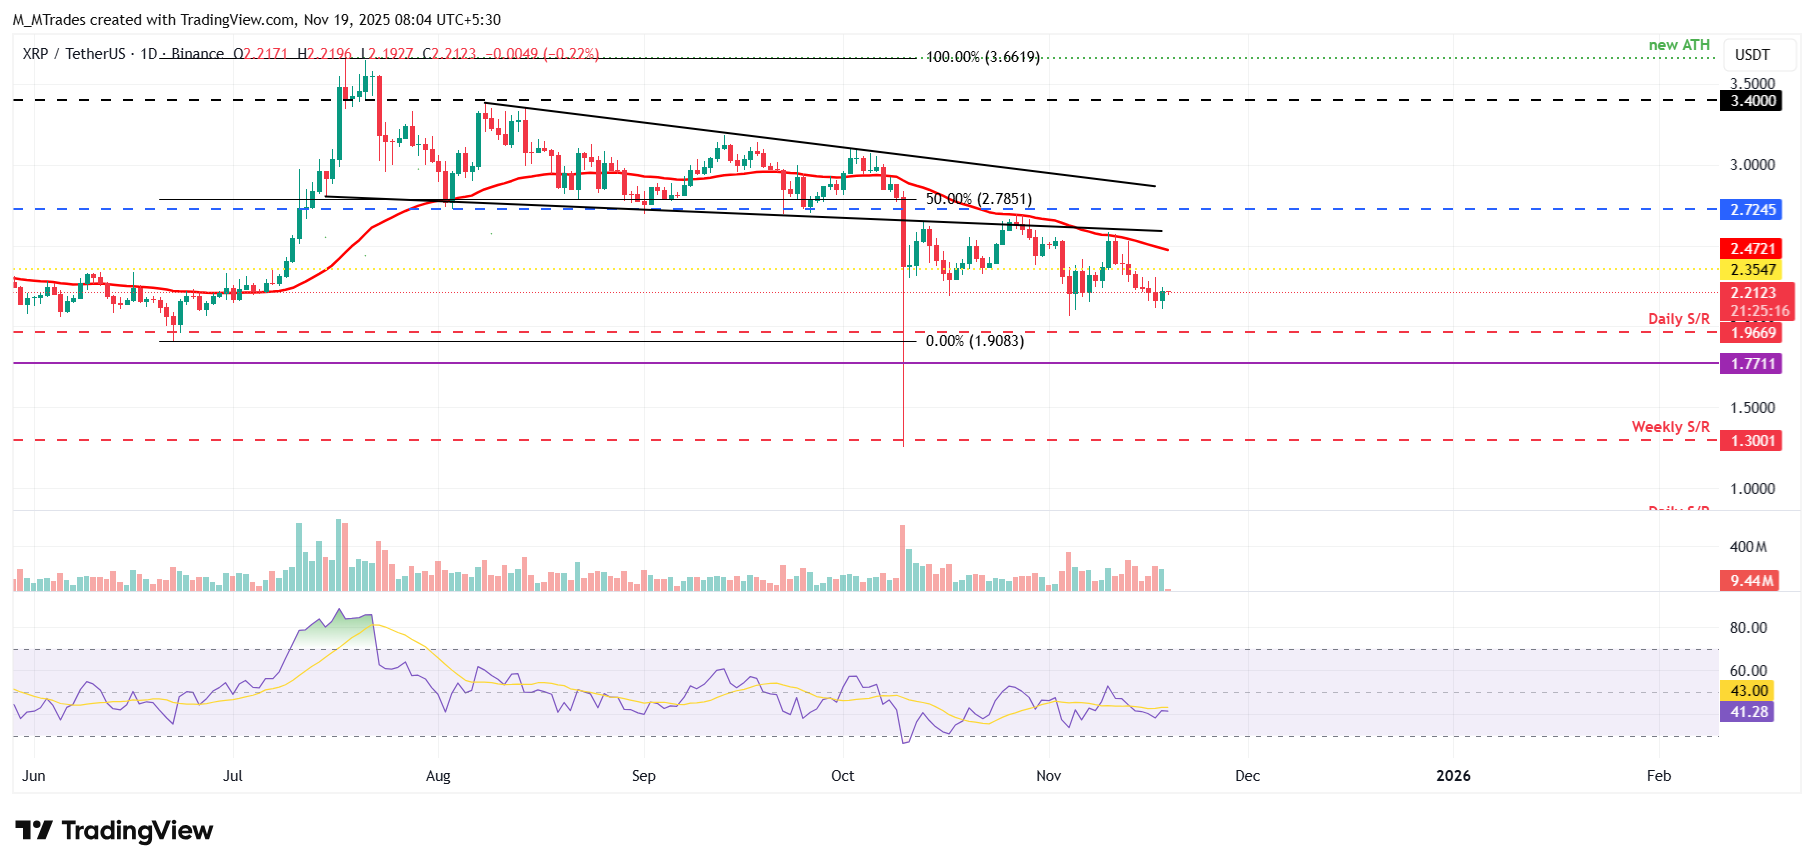
However, if XRP continues its correction, it could extend the decline toward the next daily support at $1.96.
Cryptocurrency metrics FAQs
The developer or creator of each cryptocurrency decides on the total number of tokens that can be minted or issued. Only a certain number of these assets can be minted by mining, staking or other mechanisms. This is defined by the algorithm of the underlying blockchain technology. On the other hand, circulating supply can also be decreased via actions such as burning tokens, or mistakenly sending assets to addresses of other incompatible blockchains.
Market capitalization is the result of multiplying the circulating supply of a certain asset by the asset’s current market value.
Trading volume refers to the total number of tokens for a specific asset that has been transacted or exchanged between buyers and sellers within set trading hours, for example, 24 hours. It is used to gauge market sentiment, this metric combines all volumes on centralized exchanges and decentralized exchanges. Increasing trading volume often denotes the demand for a certain asset as more people are buying and selling the cryptocurrency.
Funding rates are a concept designed to encourage traders to take positions and ensure perpetual contract prices match spot markets. It defines a mechanism by exchanges to ensure that future prices and index prices periodic payments regularly converge. When the funding rate is positive, the price of the perpetual contract is higher than the mark price. This means traders who are bullish and have opened long positions pay traders who are in short positions. On the other hand, a negative funding rate means perpetual prices are below the mark price, and hence traders with short positions pay traders who have opened long positions.

Acuity Trading
Acuity Trading은 2013년에 설립된 런던 기반 핀테크로, AI 기반 대체 데이터와 심리 분석을 통해 트레이딩과 투자를 지원합니다. 시각화된 뉴스와 심리 도구로 온라인 트레이딩 경험을 혁신했으며, 최신 AI 연구와 기술로 알파를 창출하는 대체 데이터와 높은 몰입도의 트레이딩 도구를 제공하며 시장을 선도하고 있습니다.
Read More


