
Trade The World
Top 3 Price Prediction: Bitcoin, Ethereum, Ripple – BTC, ETH, and XRP flash deeper downside risks as market selloff intensifies
작성자 Manish Chhetri
게시일: 14 Nov 2025 | 수정일: 14 Nov 2025


POPULAR ARTICLES

Bitcoin (BTC), Ethereum (ETH) and Ripple (XRP) trade in red on Friday after correcting more than 5%, 10% and 2%, respectively, so far this week.
- Bitcoin trades below $100,000 on Friday, extending its decline after correcting more than 5% so far this week.
- Ethereum dropped over 10% this week, slipping further after facing rejection at its previously broken trendline.
- XRP closes below its daily support at $2.35, signaling the possibility of a deeper correction ahead.
Bitcoin (BTC), Ethereum (ETH) and Ripple (XRP) trade in red on Friday after correcting more than 5%, 10% and 2%, respectively, so far this week. BTC has slipped below the $100,000 key level, while ETH and XRP have faced rejection at their resistance levels, signaling that bears remain firmly in control and that a deeper correction may be underway.
Bitcoin slips below $100,000 as bears tighten grip, signaling deeper correction
Bitcoin price faced rejection at the 38.20% Fibonacci retracement level at $106,453 (drawn from the April 7 low of $74,508 to the all-time high of $126,299 set on October 6) on Monday and declined nearly 6% by Thursday. At the time of writing on Friday, BTC is trading down around $99,300.
If BTC continues its correction and closes below the daily support at $97,460, it could extend the decline toward the key psychological level at $95,000.
The Relative Strength Index (RSI) is 35, below its neutral level of 50, indicating strong bearish momentum. The Moving Average Convergence Divergence also showed a bearish crossover, signaling a sell and further supporting the bearish view.
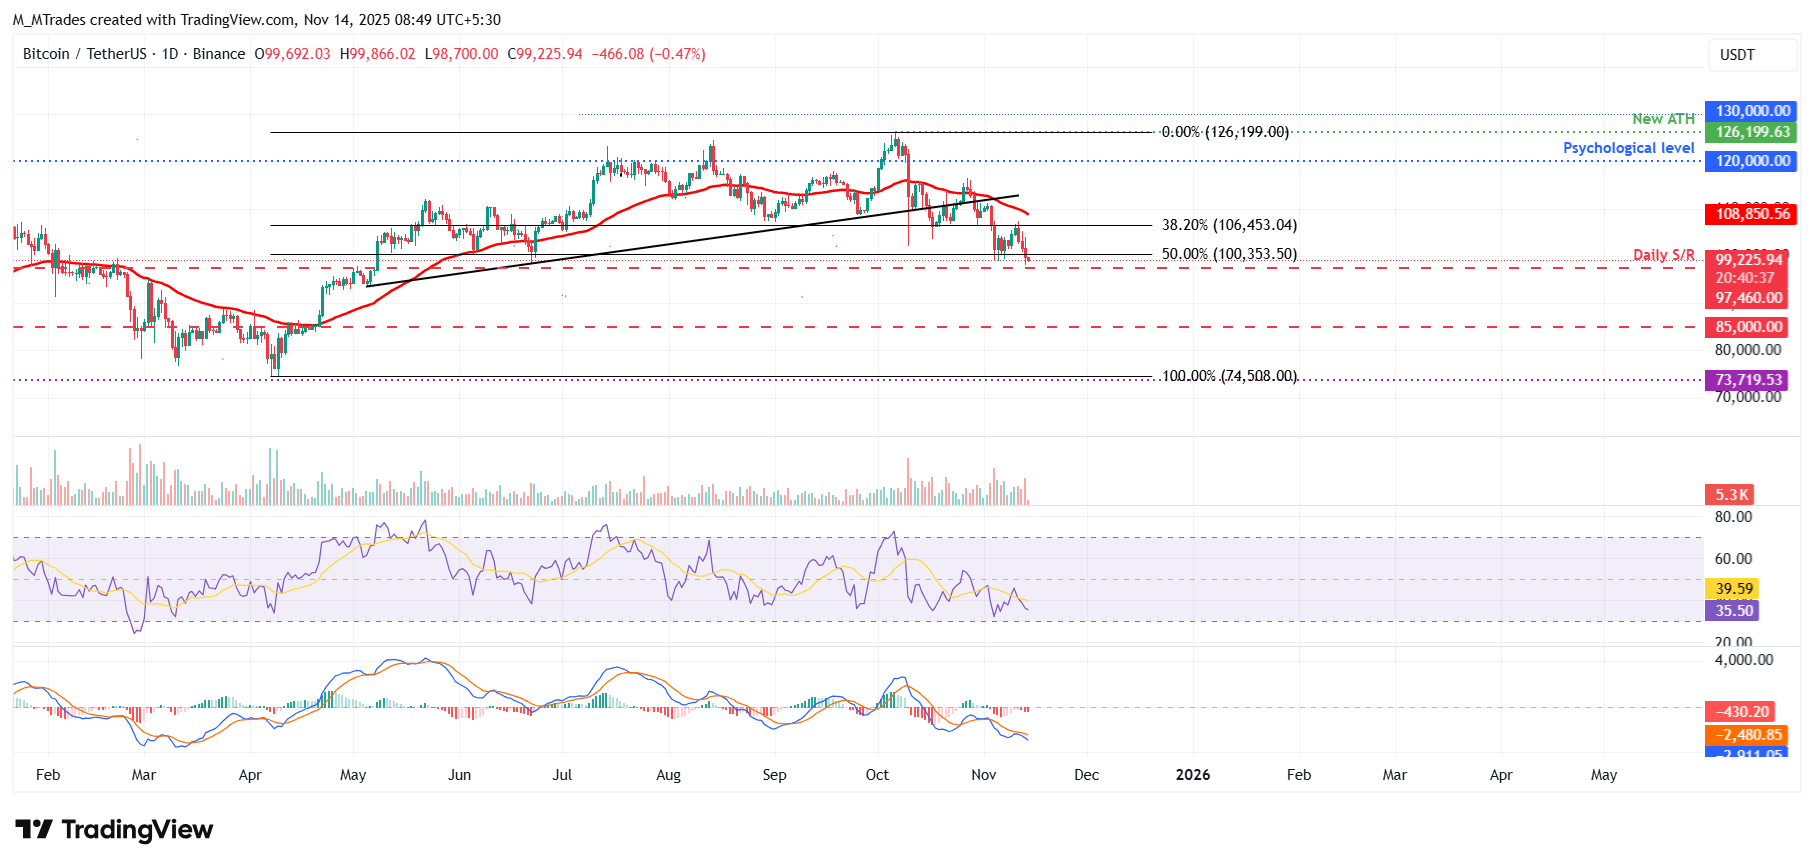
On the other hand, if BTC recovers, it could extend the recovery toward the 38.20% Fibonacci retracement at $106,453.
Ethereum corrects after facing rejection from the key resistance level
Ethereum price faced rejection at the previous broken trendline around $3,592 on Monday and declined by nearly 10% over the next three days. At the time of writing on Friday, ETH hovers at around $3,200.
If ETH continues its pullback and closes below the $3,170 support level, it could extend the decline toward the daily support at $3,017.
Like Bitcoin, Ethereum’s RSI and MACD indicate bearish momentum gaining traction, signaling a deeper correction ahead.
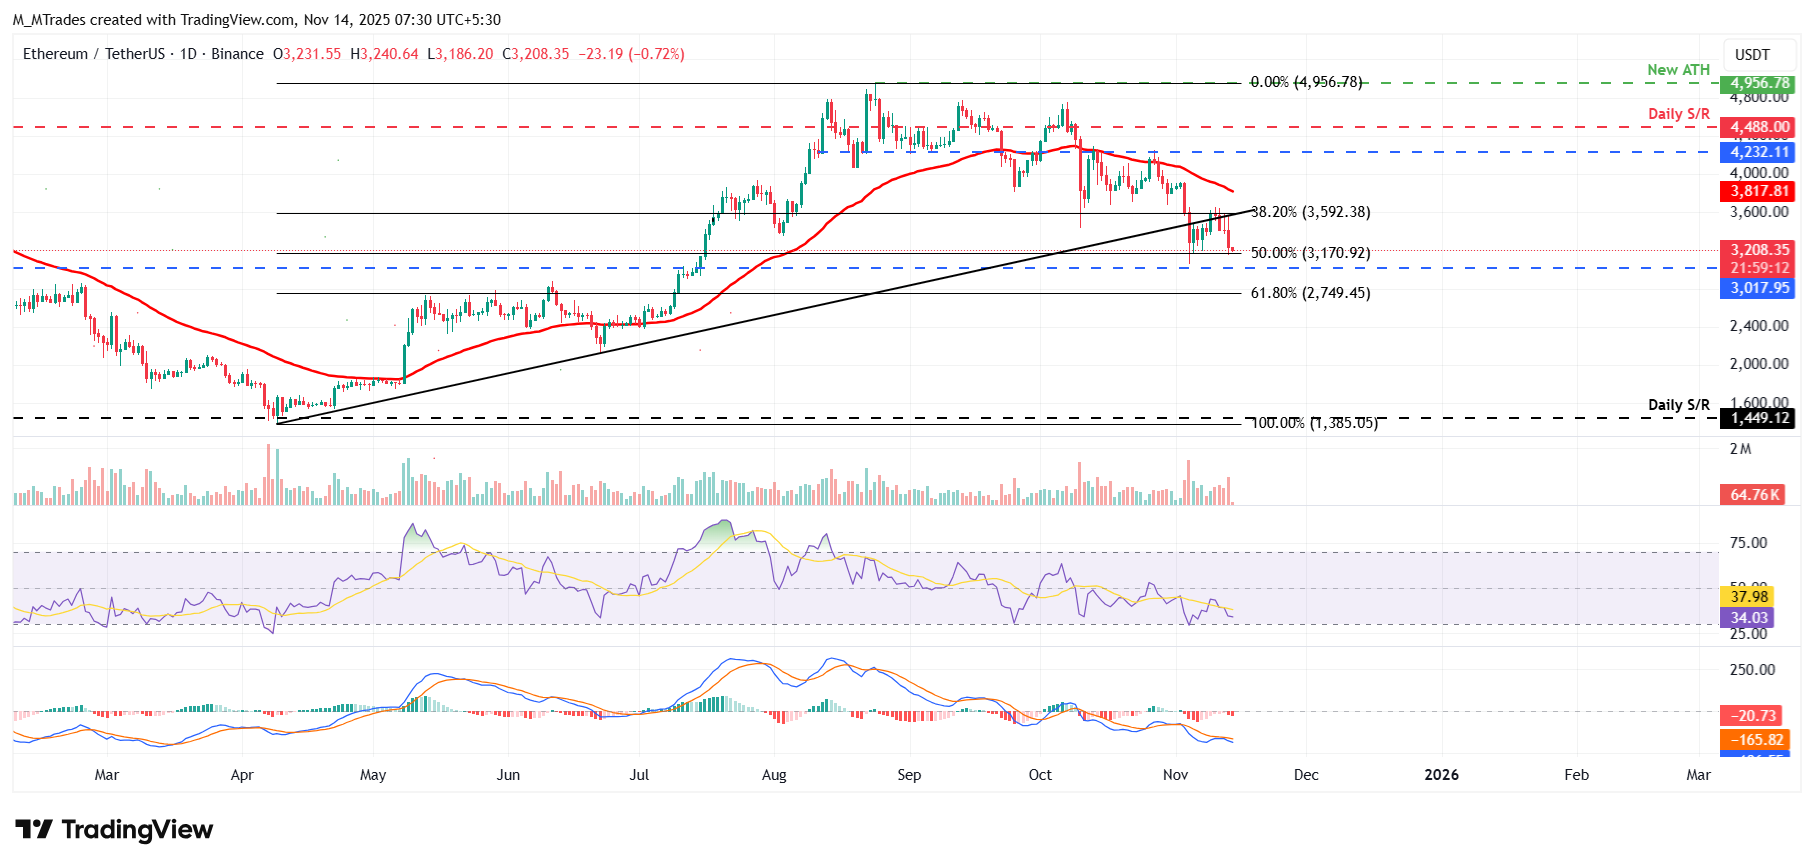
However, if ETH recovers, it could extend the recovery toward the 38.20% Fibonacci retracement level at $3,592.
XRP could correct further as it closes below daily support at $2.35
XRP price surged 6.75% on Monday, retesting the 50-day EMA at $2.53. However, it surrendered most of those gains on Tuesday after failing to break through that same resistance level. XRP again faced rejection from the 50-day EMA at $2.53 on Thursday and declined 2.74%, closing below the daily support at $2.35. At the time of writing on Friday, XRP trades down at around $2.30.
If XRP continues its correction, it could extend the decline toward the next daily support at $1.96.
Like Bitcoin and Ethereum, XRP’s RSI signals bearish momentum, while the MACD indicates indecision among traders.
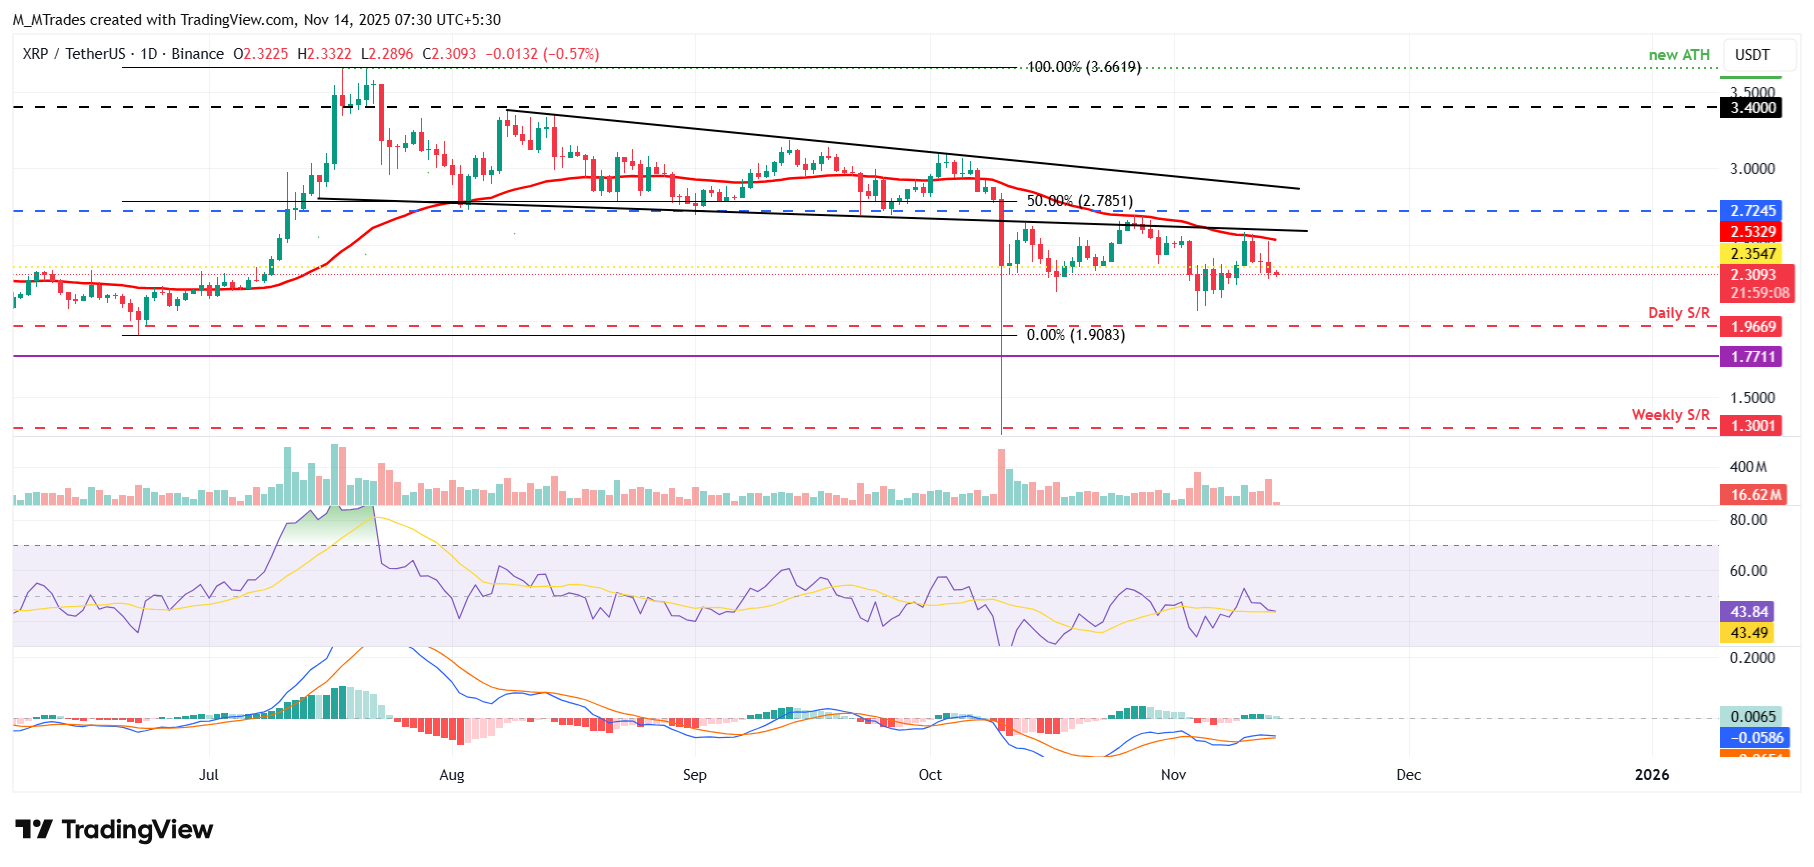
On the other hand, if XRP recovers, it could extend the recovery toward the 50-day EMA at $2.53.
Cryptocurrency metrics FAQs
The developer or creator of each cryptocurrency decides on the total number of tokens that can be minted or issued. Only a certain number of these assets can be minted by mining, staking or other mechanisms. This is defined by the algorithm of the underlying blockchain technology. On the other hand, circulating supply can also be decreased via actions such as burning tokens, or mistakenly sending assets to addresses of other incompatible blockchains.
Market capitalization is the result of multiplying the circulating supply of a certain asset by the asset’s current market value.
Trading volume refers to the total number of tokens for a specific asset that has been transacted or exchanged between buyers and sellers within set trading hours, for example, 24 hours. It is used to gauge market sentiment, this metric combines all volumes on centralized exchanges and decentralized exchanges. Increasing trading volume often denotes the demand for a certain asset as more people are buying and selling the cryptocurrency.
Funding rates are a concept designed to encourage traders to take positions and ensure perpetual contract prices match spot markets. It defines a mechanism by exchanges to ensure that future prices and index prices periodic payments regularly converge. When the funding rate is positive, the price of the perpetual contract is higher than the mark price. This means traders who are bullish and have opened long positions pay traders who are in short positions. On the other hand, a negative funding rate means perpetual prices are below the mark price, and hence traders with short positions pay traders who have opened long positions.

Acuity Trading
Acuity Trading은 2013년에 설립된 런던 기반 핀테크로, AI 기반 대체 데이터와 심리 분석을 통해 트레이딩과 투자를 지원합니다. 시각화된 뉴스와 심리 도구로 온라인 트레이딩 경험을 혁신했으며, 최신 AI 연구와 기술로 알파를 창출하는 대체 데이터와 높은 몰입도의 트레이딩 도구를 제공하며 시장을 선도하고 있습니다.
Read More


