
Trade The World
Top 3 Price Prediction: Bitcoin, Ethereum, Ripple – BTC eyes fresh upside while ETH and XRP consolidate
작성자 Manish Chhetri
게시일: 1 Oct 2025 | 수정일: 1 Oct 2025


POPULAR ARTICLES

Bitcoin (BTC) price trades above $114,000 on Wednesday after finding support around the key level the previous day. Meanwhile, Ethereum (ETH) and Ripple (XRP) are nearing their key resistance levels; a decisive close above could trigger a fresh rally.
- Bitcoin finds support around the 50-day EMA at $113,406, hinting at a potential bullish move ahead.
- Ethereum nears its key resistance at $4,232, a decisive close above could trigger a fresh rally.
- Ripple's XRP steadies around $2.85 as momentum tools indicate fading bearish pressure.
Bitcoin (BTC) price trades above $114,000 on Wednesday after finding support around the key level the previous day. Meanwhile, Ethereum (ETH) and Ripple (XRP) are nearing their key resistance levels; a decisive close above could trigger a fresh rally.
Bitcoin eyes fresh upside as it finds support around the 50-day EMA
Bitcoin price started the week on a positive note, rallying nearly 2% on Monday and closing above the 50-day Exponential Moving Average (EMA) at $113,402. On Tuesday, BTC edged slightly down and found support around the 50-day EMA. At the time of writing on Wednesday, it trades slightly higher at around $114,369.
If the 50-day EMA at $113,402 continues to hold as support, BTC could extend the recovery toward the daily resistance at $116,000.
The Relative Strength Index (RSI) on the daily chart reads 53, which is above its neutral level of 50, indicating that bullish momentum is gaining traction. Additionally, the Moving Average Convergence Divergence (MACD) is showing a bullish crossover on Wednesday, providing a buy signal and suggesting the start of an upward trend ahead.
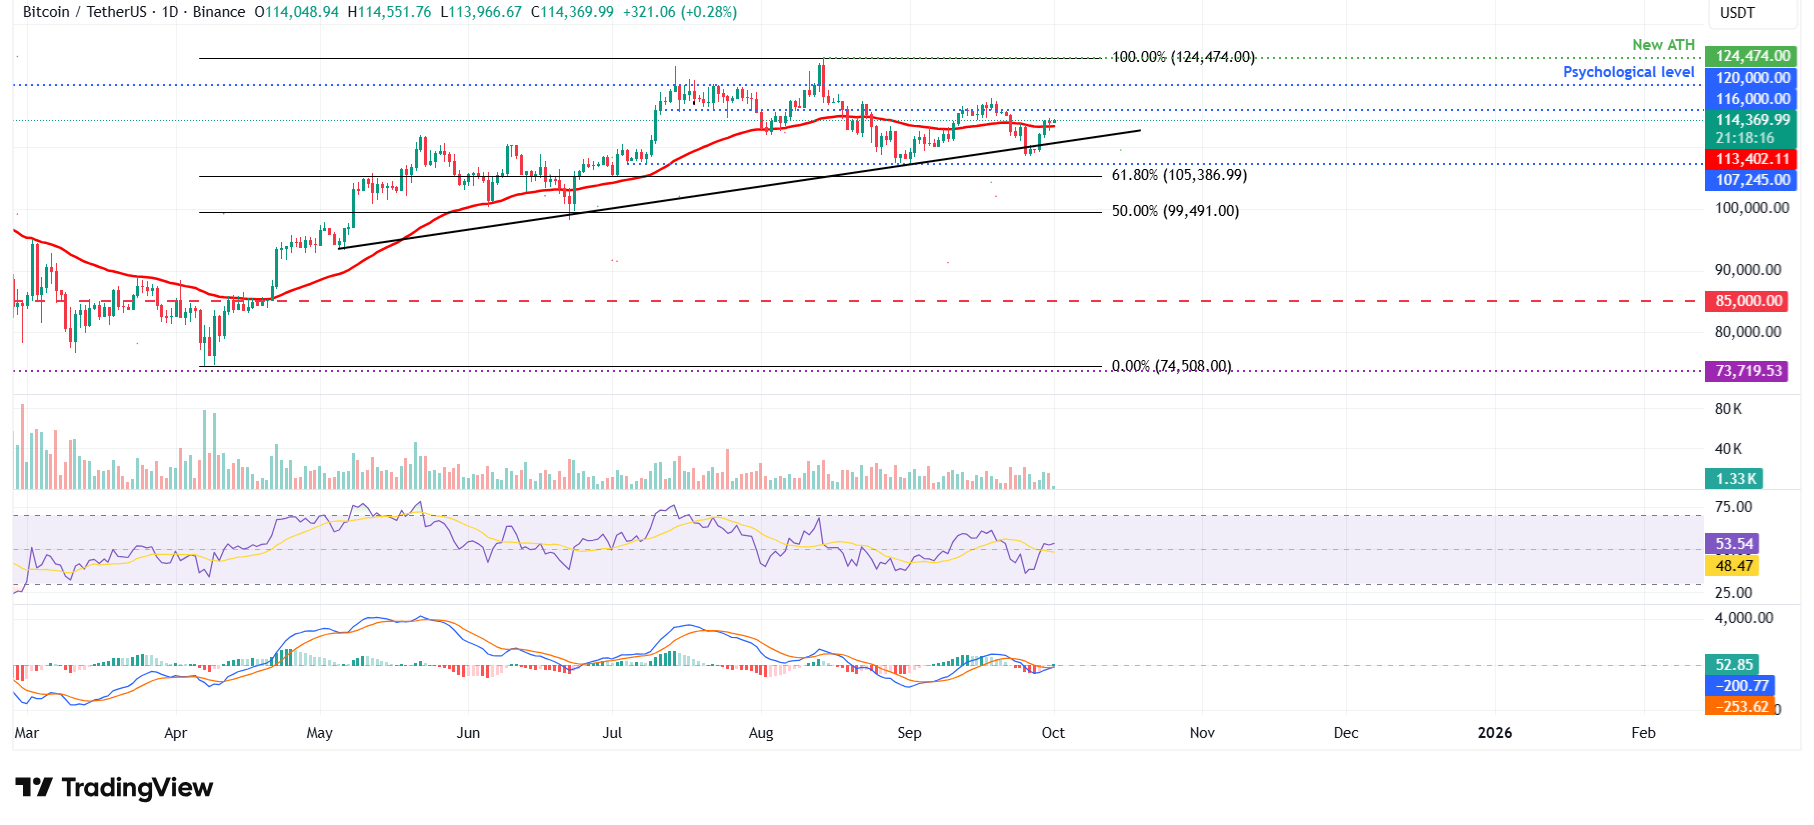
BTC/USDT daily chart
However, if BTC fails to find support around the 50-day EMA and closes below, BTC could extend the decline toward the daily support at $107,245.
Ethereum could rally if it closes above $4,232
Ethereum price found support around the 100-day EMA at $3,877 on Saturday and rallied 8.79% by Monday. ETH faced slight rejection after retesting the daily resistance level at $4,232 on Tuesday. At the time of writing on Wednesday, it hovers around $4,154.
If ETH breaks and closes above the daily resistance at $4,232 on a daily basis, it could extend the rally toward the next resistance at $4,488.
The RSI on the daily chart reads 44, pointing upwards and nearing its neutral level of 50, which indicates a fading bearish momentum. For the recovery rally to be sustained, the RSI must move above the neutral level.
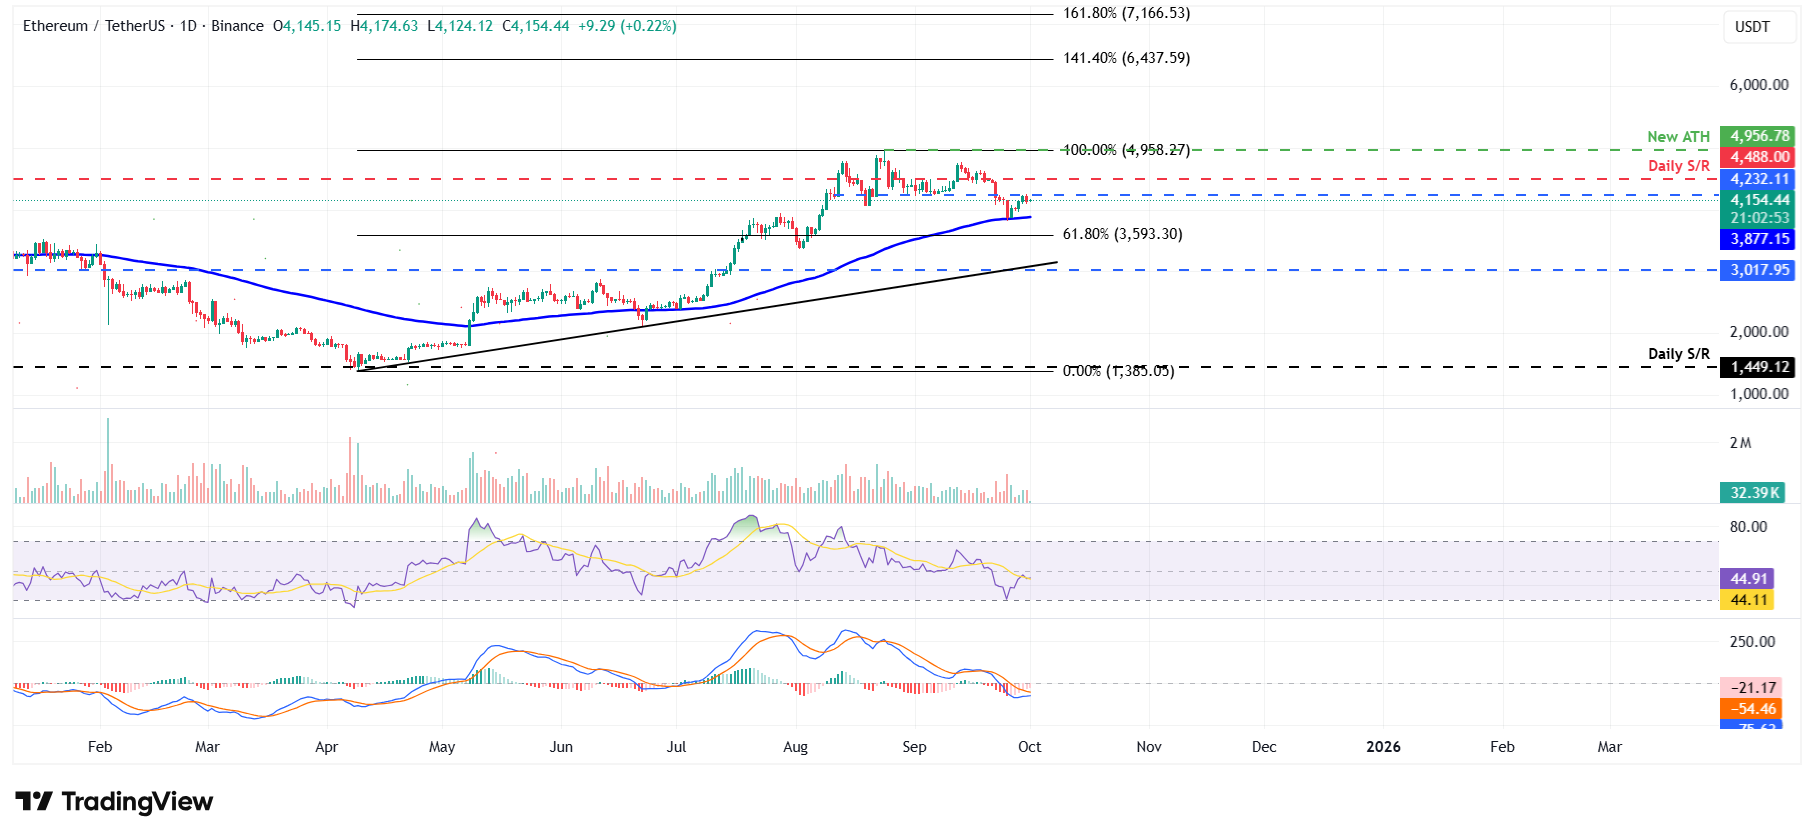
ETH/USDT daily chart
On the other hand, if ETH faces a correction, it could extend the decline toward the 100-day EMA at $3,863.
XRP shows signs of fading bearish momentum
XRP price found support around the daily level at $2.72 on Friday and rose nearly 5% by Monday. However, XRP faced rejection from its 50-day EMA at $2.91 the next day and declined 1.16%. At the time of writing on Wednesday, it hovers at around $2.84.
If XRP closes above the $2.91 resistance level, it could extend the rally toward the key psychological level at $3.
Like ETH, XRP RSI also shows fading bearish momentum. However, for the recovery rally to be sustained, the RSI must move above the neutral level. Moreover, the MACD lines are also about to flip to a bullish crossover, while the falling red histogram bars also indicate the fading of bearish momentum.
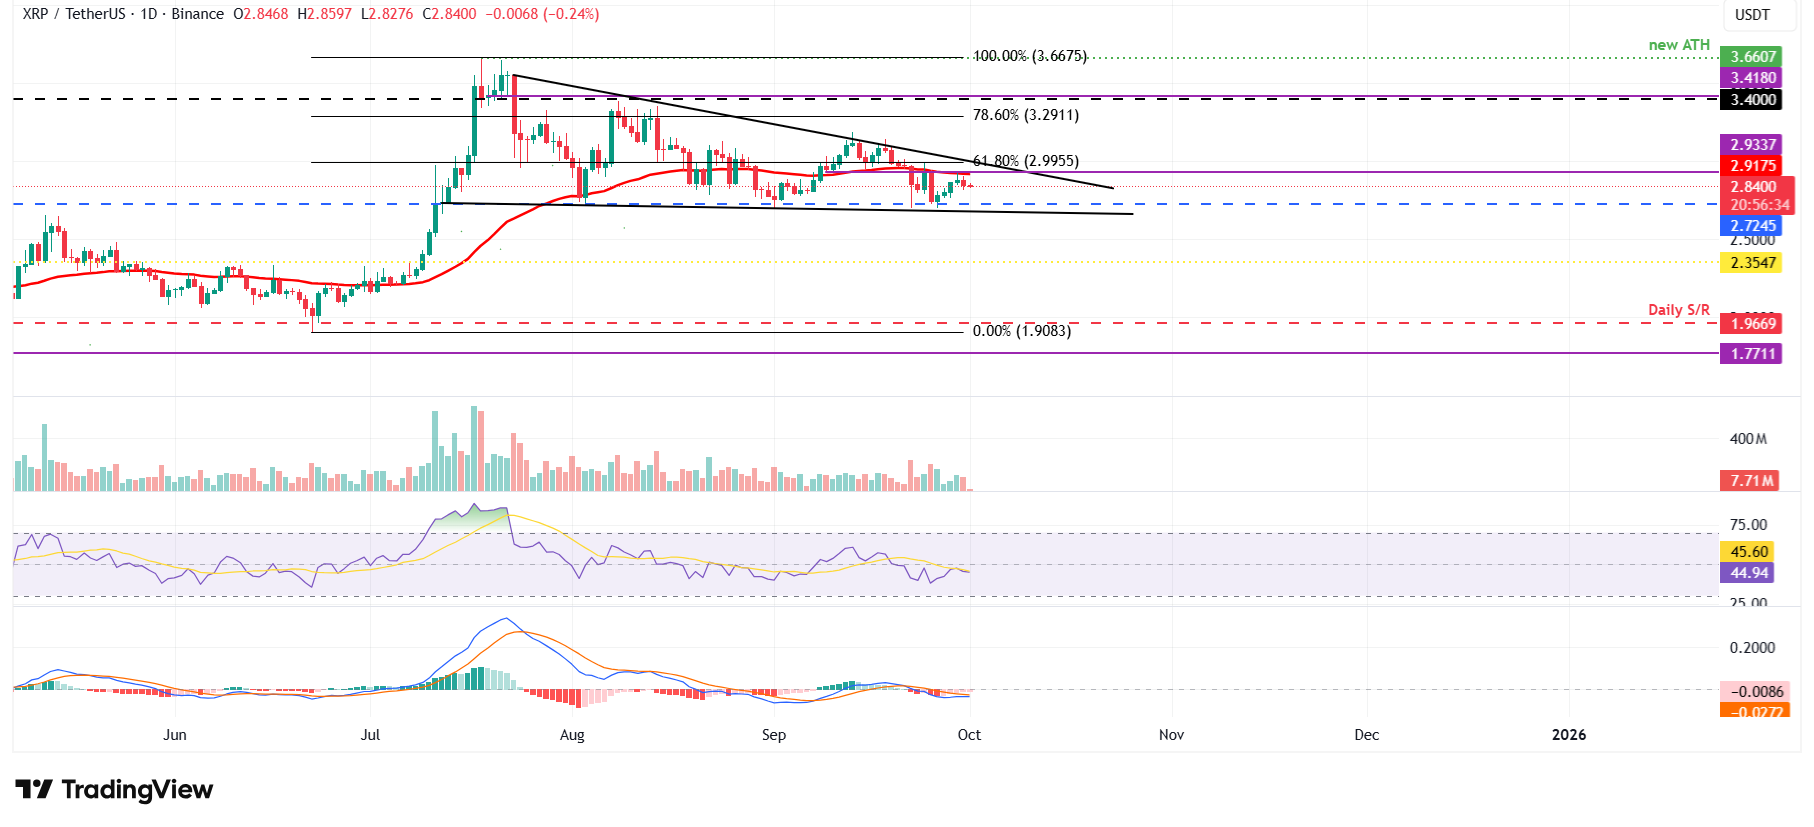
XRP/USDT daily chart
However, if XRP faces a correction, it could extend the decline toward the daily support at $2.72.
Cryptocurrency metrics FAQs
The developer or creator of each cryptocurrency decides on the total number of tokens that can be minted or issued. Only a certain number of these assets can be minted by mining, staking or other mechanisms. This is defined by the algorithm of the underlying blockchain technology. On the other hand, circulating supply can also be decreased via actions such as burning tokens, or mistakenly sending assets to addresses of other incompatible blockchains.
Market capitalization is the result of multiplying the circulating supply of a certain asset by the asset’s current market value.
Trading volume refers to the total number of tokens for a specific asset that has been transacted or exchanged between buyers and sellers within set trading hours, for example, 24 hours. It is used to gauge market sentiment, this metric combines all volumes on centralized exchanges and decentralized exchanges. Increasing trading volume often denotes the demand for a certain asset as more people are buying and selling the cryptocurrency.
Funding rates are a concept designed to encourage traders to take positions and ensure perpetual contract prices match spot markets. It defines a mechanism by exchanges to ensure that future prices and index prices periodic payments regularly converge. When the funding rate is positive, the price of the perpetual contract is higher than the mark price. This means traders who are bullish and have opened long positions pay traders who are in short positions. On the other hand, a negative funding rate means perpetual prices are below the mark price, and hence traders with short positions pay traders who have opened long positions.

Acuity Trading
Acuity Trading은 2013년에 설립된 런던 기반 핀테크로, AI 기반 대체 데이터와 심리 분석을 통해 트레이딩과 투자를 지원합니다. 시각화된 뉴스와 심리 도구로 온라인 트레이딩 경험을 혁신했으며, 최신 AI 연구와 기술로 알파를 창출하는 대체 데이터와 높은 몰입도의 트레이딩 도구를 제공하며 시장을 선도하고 있습니다.
Read More


