
Trade The World
Top 3 Price Prediction: Bitcoin, Ethereum, Ripple – BTC leads charge to $120K as ETH, XRP extend bullish run
작성자 Manish Chhetri
게시일: 11 Jul 2025 | 수정일: 11 Jul 2025


POPULAR ARTICLES

Bitcoin (BTC) is extending its bullish momentum, trading above $116,000 on Friday after surging to a new all-time high of $116,868 the previous day. Ethereum (ETH) and Ripple (XRP) followed BTC’s footsteps, rallying above their key resistances.
- Bitcoin price prints a fresh all-time high of $116,868, with bulls eyeing $120,000 as the next key milestone.
- Ethereum price flirts with the critical $3,000 resistance level, closing above could trigger a further rally.
- Ripple's XRP closes firmly above the $2.47 resistance, with bullish momentum building toward $2.72.
Bitcoin (BTC) is extending its bullish momentum, trading above $116,000 on Friday after surging to a new all-time high of $116,868 the previous day. Ethereum (ETH) and Ripple (XRP) followed BTC’s footsteps, rallying above their key resistances. With bullish structures forming across the top three cryptocurrencies, traders are eyeing higher targets, signaling further upside potential on the horizon.
Bitcoin prints fresh all-time high of $116,868
Bitcoin price consolidation around the upper boundary of a previously broken consolidation zone at $108,355 came to an end on Wednesday. It surged to reach a new all-time high of $116,868 on Thursday. At the time of writing on Friday, it hovers above $116,600.
As BTC enters into a price discovery mode, and if the upward trend continues, it could extend the rally toward its key psychological level of $120,000.
The Relative Strength Index (RSI) on the daily chart reads 71, above its overbought level of 70, indicating strong bullish momentum. However, traders should be cautious as the chances of a pullback are high due to its overbought condition. Meanwhile, the Moving Average Convergence Divergence (MACD) indicator displayed a bullish crossover at the end of June. It also shows rising green histogram bars above its neutral zero line, suggesting bullish momentum is gaining traction and continuing an upward trend.
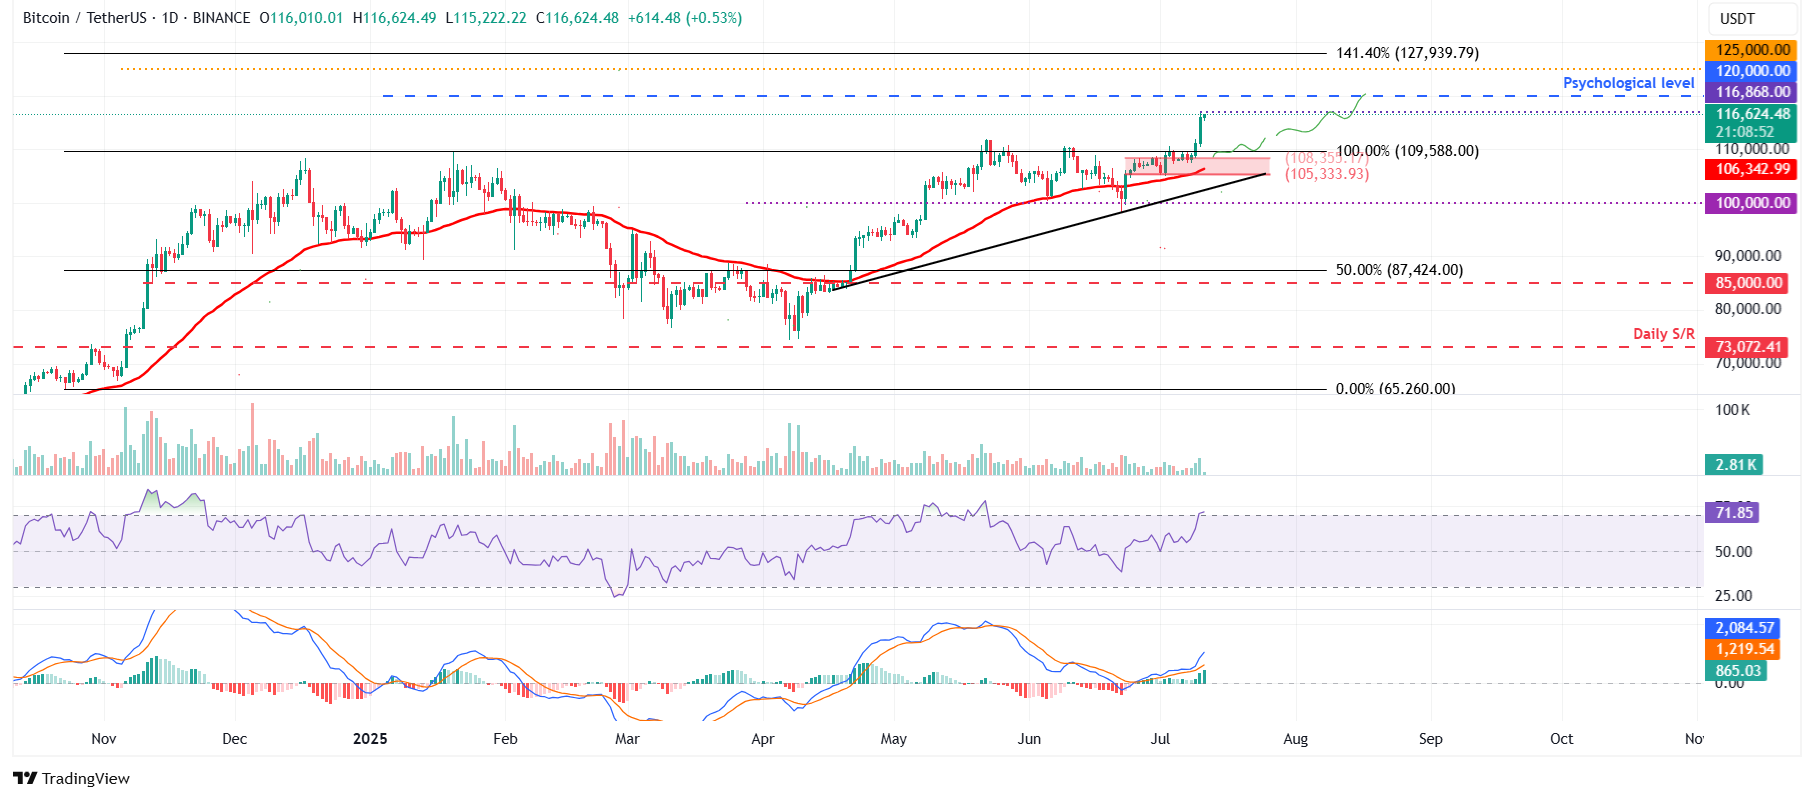
BTC/USDT daily chart
However, if BTC faces a correction, it could extend the decline to find support around the upper boundary of a previously broken consolidation zone at $108,355.
Ethereum could extend further gains if it closes above $3,000 resistance
Ethereum price rebounded after finding support around its daily level of $2,461 last week and rallied 10%, closing above its daily resistance at $2,724 on Wednesday. It continued its rally by 6.59% the next day and retested its key psychological level at $3,000. At the time of writing on Friday, it hovers at around $2,970.
If ETH closes above $3,000 on a daily basis, it could extend the rally toward its next daily resistance level at $3,730.
The RSI on the daily chart reads 72, above its overbought level of 70, indicating strong bullish momentum. Meanwhile, the MACD indicator displayed a bullish crossover last week. It also shows rising green histogram bars above its neutral zero line, suggesting bullish momentum is gaining traction and continuing an upward trend.
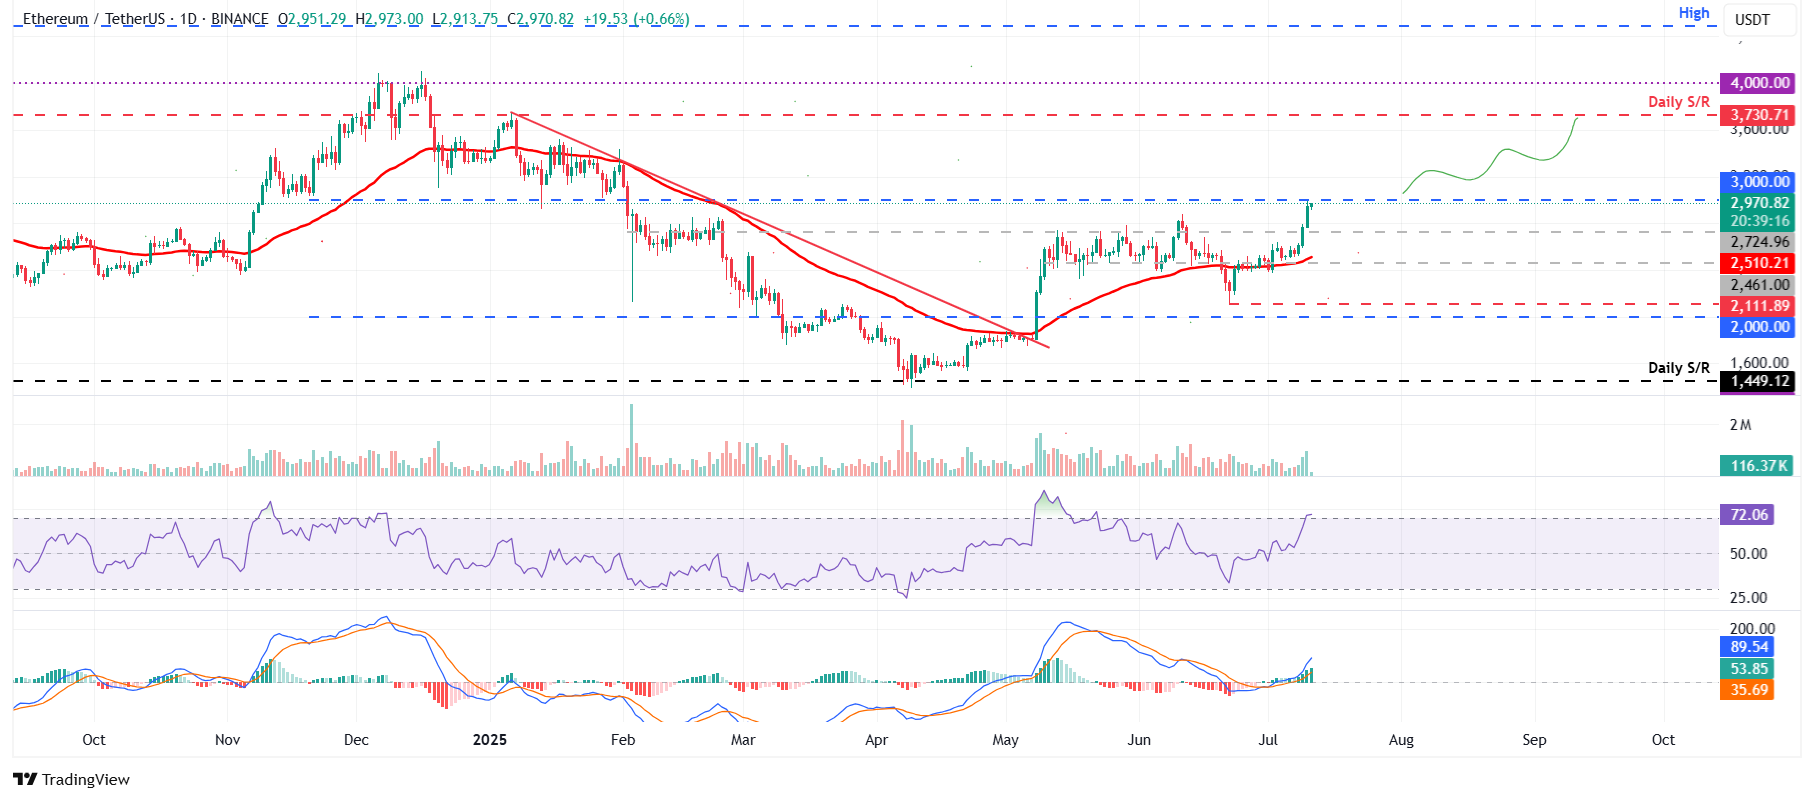
ETH/USDT daily chart
However, if ETH faces rejection from $3,000, it could extend the decline to find support around its daily level of $2,724.
XRP bulls are in control of the momentum
XRP price broke above the descending trendline (drawn by connecting multiple highs since mid-May) on June 30 and found support around its previous level over the next two days, rallying 4.5% until Sunday. As of this week, it continued to surge by nearly 13%, closing above its May 23 high of $2.47 on Thursday. At the time of writing on Friday, it hovers at around $2.57.
If XRP continues its upward momentum, it could extend the rally toward its daily resistance at $2.72, with eyes on $3.00 next.
The RSI on the daily chart reads 73, above its overbought level of 70, indicating strong bullish momentum. The MACD indicator on the daily chart displayed a bullish crossover last week and shows rising green histogram bars above its neutral level, suggesting bullish momentum and indicating an upward trend.
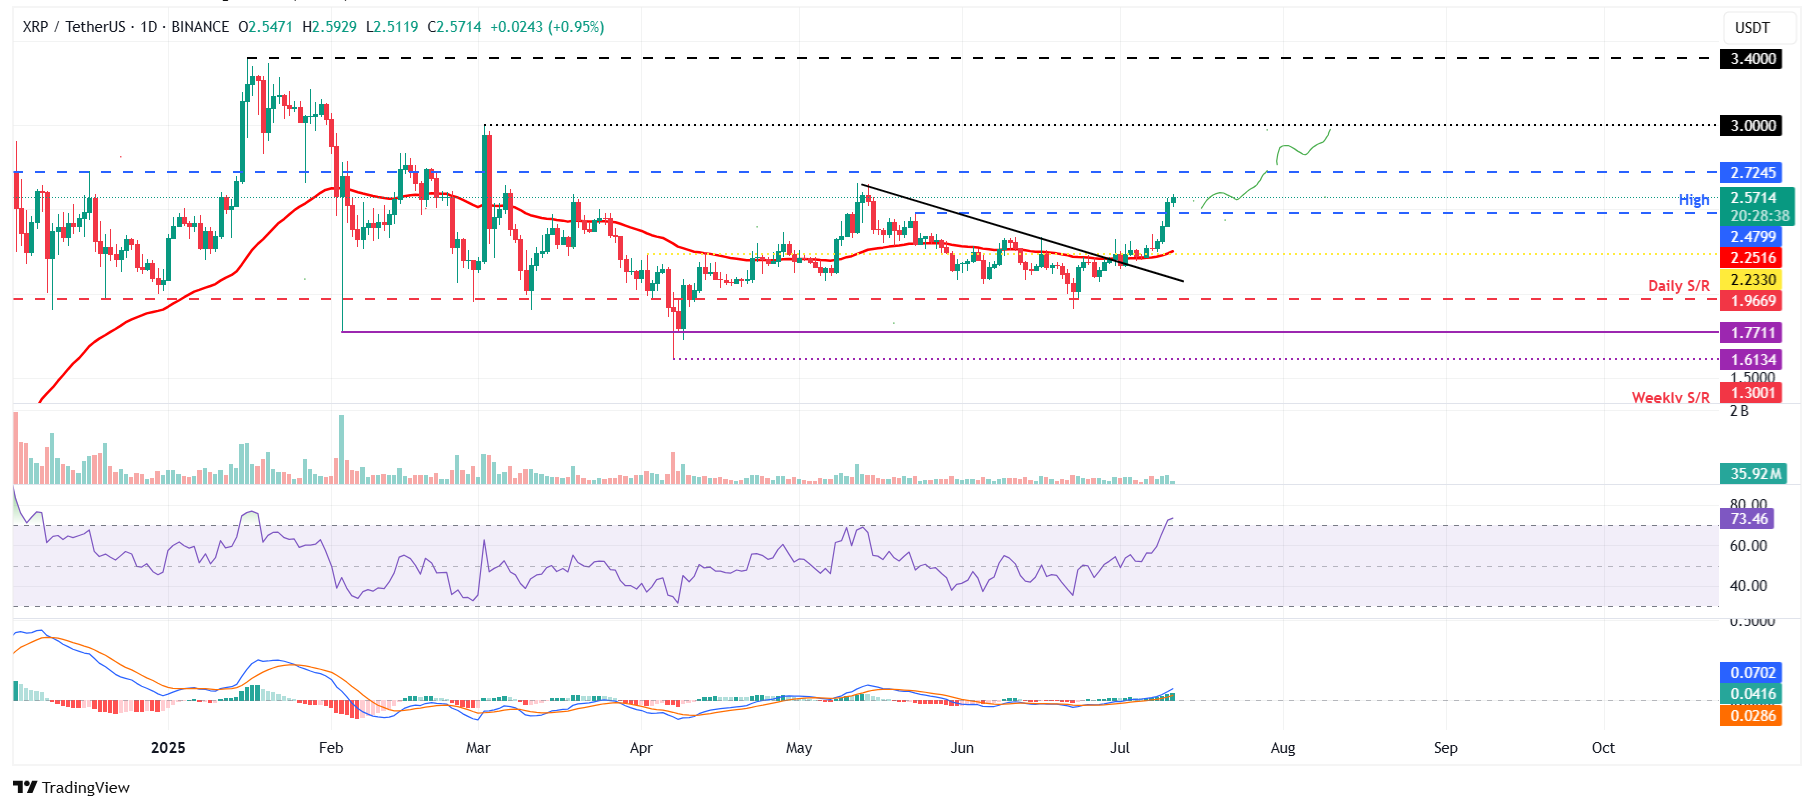
XRP/USDT daily chart
However, if XRP faces a correction, it could extend the decline to find support at $2.47.

Acuity Trading
Acuity Trading은 2013년에 설립된 런던 기반 핀테크로, AI 기반 대체 데이터와 심리 분석을 통해 트레이딩과 투자를 지원합니다. 시각화된 뉴스와 심리 도구로 온라인 트레이딩 경험을 혁신했으며, 최신 AI 연구와 기술로 알파를 창출하는 대체 데이터와 높은 몰입도의 트레이딩 도구를 제공하며 시장을 선도하고 있습니다.
Read More


